| Param | Original file | Final file |
|---|---|---|
| Filename | modeM0/AS1A11_049T03_9000005208_36482cztM0_level2.evt | modeM0/AS1A11_049T03_9000005208_36482cztM0_level2_quad_clean.evt |
| Size (bytes) | 467,625,600 | 63,195,840 |
| Size | 446.0 MB | 60.3 MB |
| Events in quadrant A | 2,574,916 | 405,030 |
| Events in quadrant B | 3,015,339 | 395,546 |
| Events in quadrant C | 4,554,293 | 373,046 |
| Events in quadrant D | 3,655,568 | 366,093 |
| Mode M9 | |||
|---|---|---|---|
| Quadrant | BADHDUFLAG | Total packets | Discarded packets |
| A | 0 | 22 | 0 |
| B | 0 | 22 | 0 |
| C | 0 | 22 | 0 |
| D | 0 | 23 | 0 |
| Mode M0 | |||
|---|---|---|---|
| Quadrant | BADHDUFLAG | Total packets | Discarded packets |
| A | 0 | 11128 | 2 |
| B | 0 | 12355 | 2 |
| C | 0 | 16918 | 2 |
| D | 0 | 14631 | 2 |
| Mode SS | |||
|---|---|---|---|
| Quadrant | BADHDUFLAG | Total packets | Discarded packets |
| A | 0 | 110 | 0 |
| B | 0 | 110 | 0 |
| C | 0 | 110 | 0 |
| D | 0 | 110 | 0 |
| Quadrant | Total seconds | Saturated seconds | Saturation percentage |
|---|---|---|---|
| A | 5328 | 13 | 0.243994% |
| B | 5328 | 107 | 2.008258% |
| C | 5328 | 382 | 7.169670% |
| D | 5328 | 353 | 6.625375% |
Noise dominated data is calculated using 1-second bins in cleaned event files. If a bin has >2000 counts, and if more than 50% of those come from <1% of pixels, then it is considered to be noise-dominated and hence unusable.
| Quadrant | # 1 sec bins | Bins with >0 counts | Bins with >2000 counts | High rate bins dominated by noise | Noise dominated (total time) | Noise dominated (detector-on time) | Marked lightcurve |
|---|---|---|---|---|---|---|---|
| A | 6850 | 5329 | 6 | 6 | 0.09% | 0.11% | 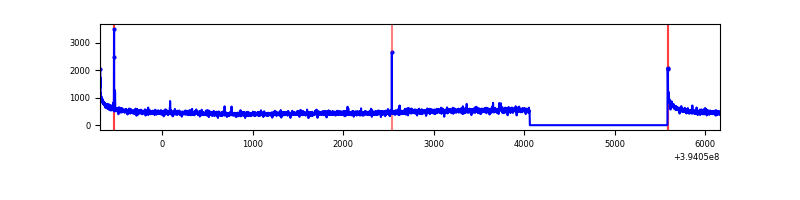 |
| B | 6850 | 5329 | 91 | 91 | 1.33% | 1.71% | 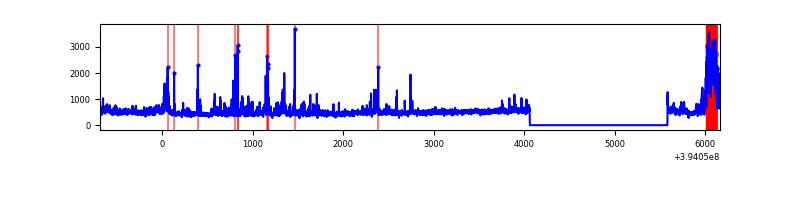 |
| C | 6850 | 5329 | 407 | 407 | 5.94% | 7.64% | 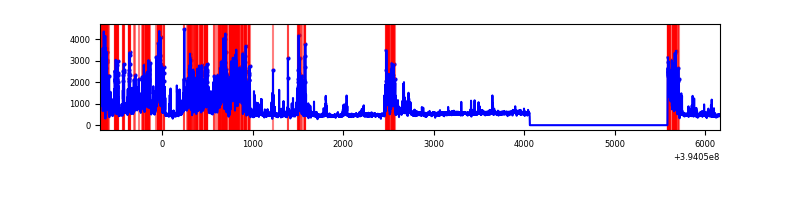 |
| D | 6850 | 5329 | 327 | 327 | 4.77% | 6.14% | 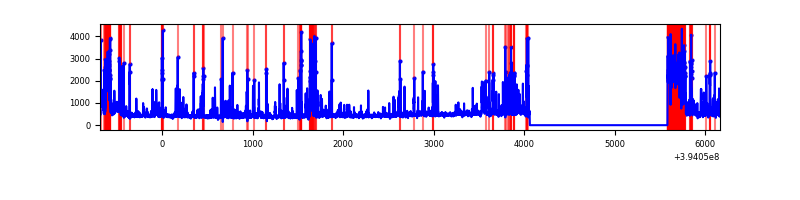 |
Top three noisy pixels from each quadrant. If the there are fewer than three noisy pixels in the level2.evt file, extra rows are filled as -1
| Pixel properties | Quadrant properties | ||||||
|---|---|---|---|---|---|---|---|
| Quadrant | DetID | PixID | Counts | Sigma | Mean | Median | Sigma |
| A | 10 | 83 | 196265 | 1583.01 | 607 | 596 | 123.6 |
| A | 15 | 233 | 10475 | 79.92 | 607 | 596 | 123.6 |
| A | 13 | 6 | 9074 | 68.59 | 607 | 596 | 123.6 |
| B | 5 | 172 | 377002 | 3299.8 | 595 | 580 | 114.1 |
| B | 5 | 255 | 122342 | 1067.39 | 595 | 580 | 114.1 |
| B | 0 | 189 | 55279 | 479.5 | 595 | 580 | 114.1 |
| C | 4 | 254 | 1539497 | 11550.25 | 568 | 570 | 133.2 |
| C | 0 | 10 | 357041 | 2675.45 | 568 | 570 | 133.2 |
| C | 15 | 214 | 227272 | 1701.49 | 568 | 570 | 133.2 |
| D | 13 | 249 | 657180 | 4699.3 | 569 | 552 | 139.7 |
| D | 12 | 227 | 443897 | 3172.9 | 569 | 552 | 139.7 |
| D | 13 | 171 | 125496 | 894.19 | 569 | 552 | 139.7 |
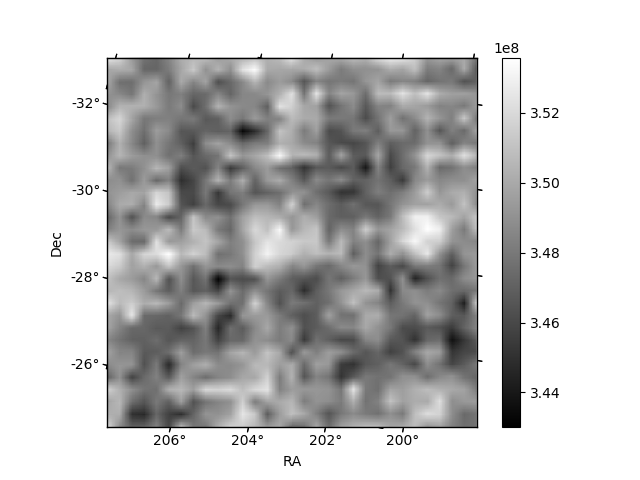
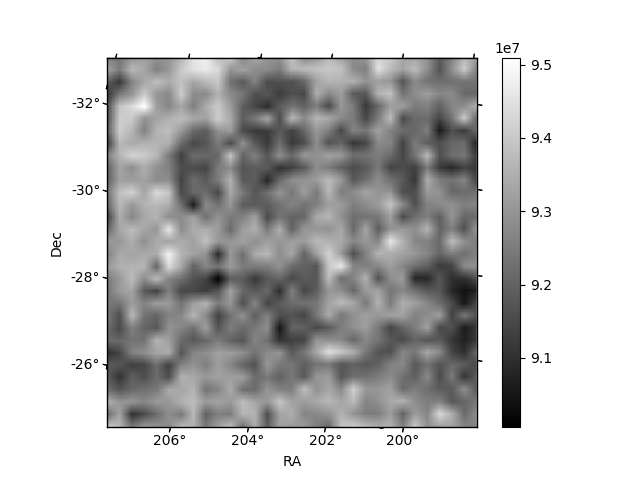
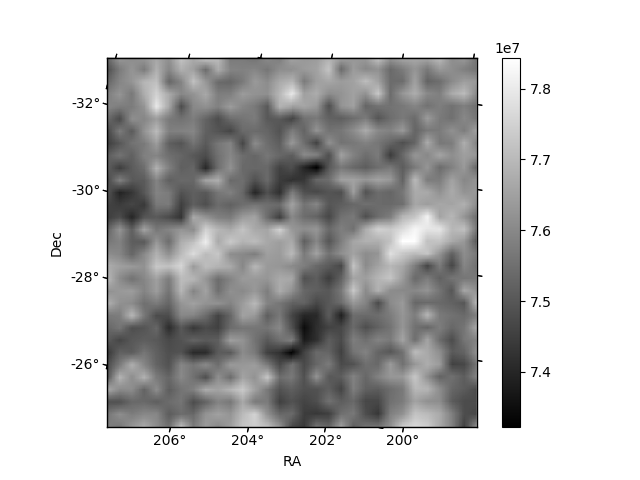
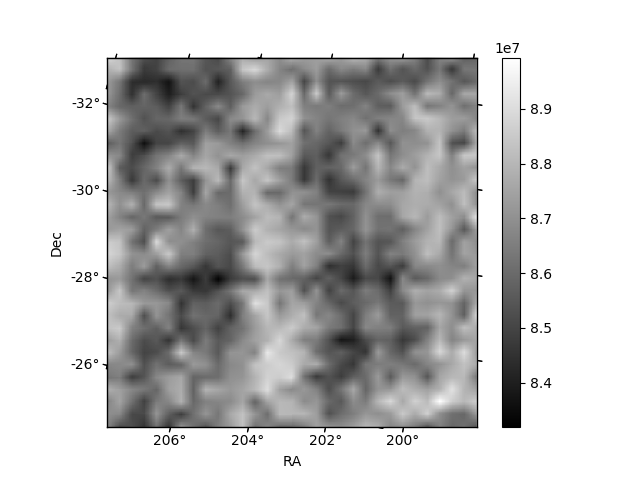
Histogram calculated using DETX and DETY for each event in the final _common_clean file
| Quadrant A | 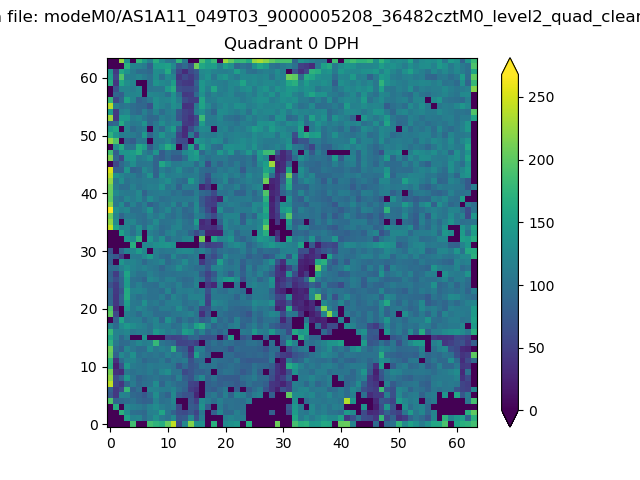 |
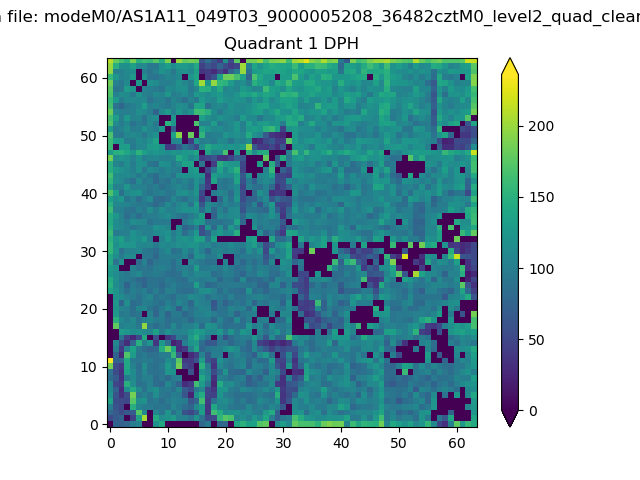 |
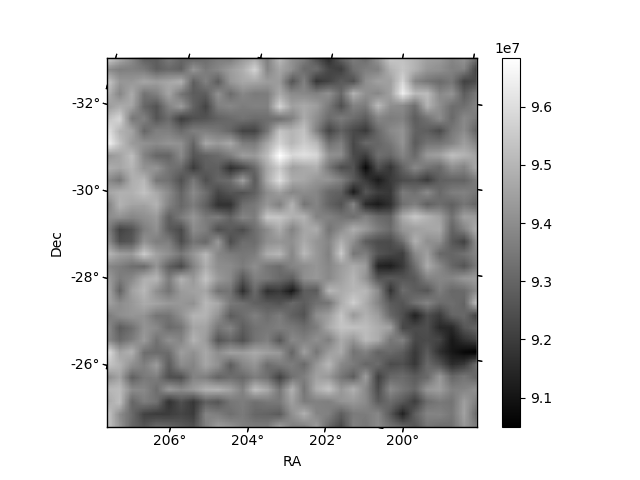
Quadrant B |
|---|---|---|---|
| Quadrant D | 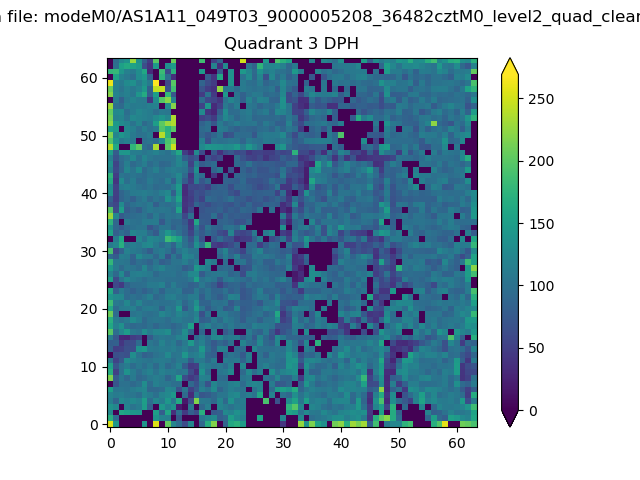 |
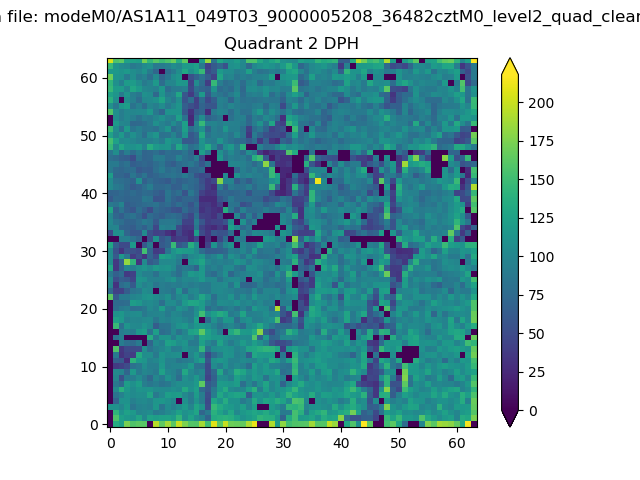 |
Quadrant C |
| Plot type | Count rate plots | Images |
|---|---|---|
| Comparison with Poisson distribution Blue bars denote a histogram of data divided into 1 sec bins. Red curve is a Poisson curve with rate = median count rate of data. |
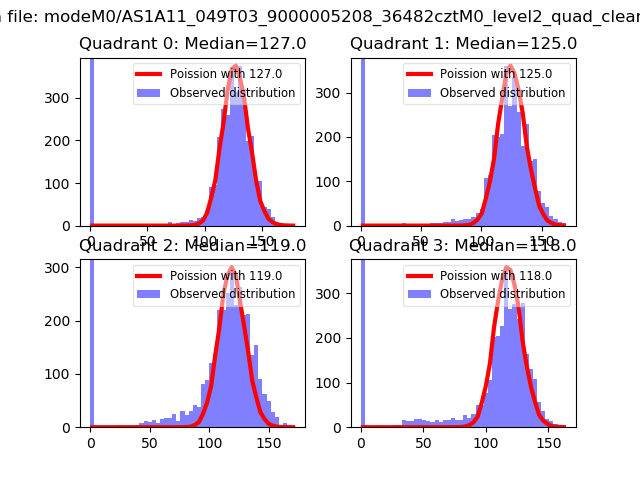 |
 |
| Quadrant-wise count rates Data is divided into 100 sec bins |
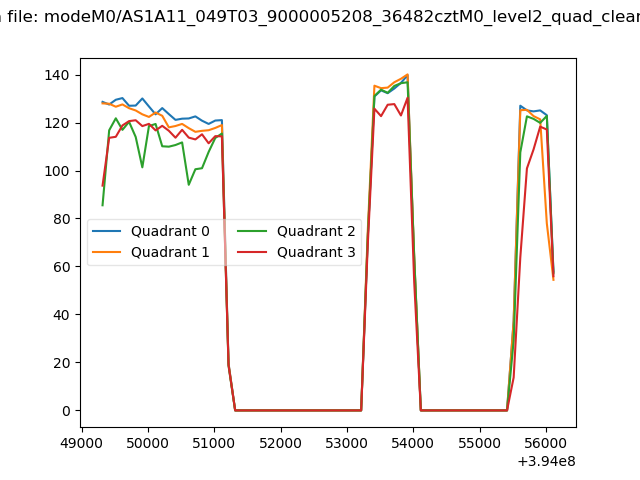 |
|
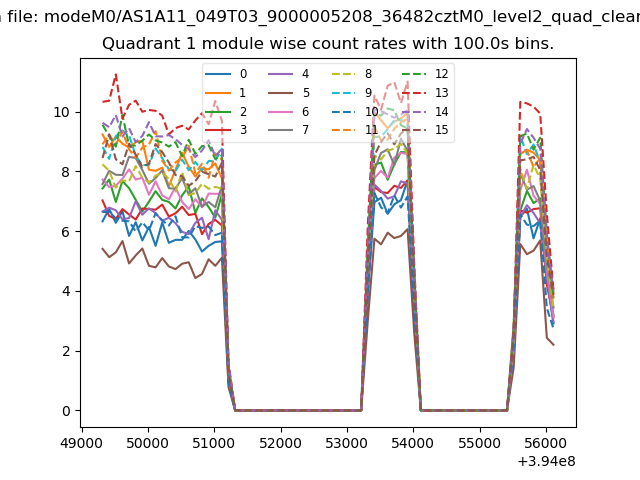
| Module-wise count rates for Quadrant A Data is divided into 100 sec bins |
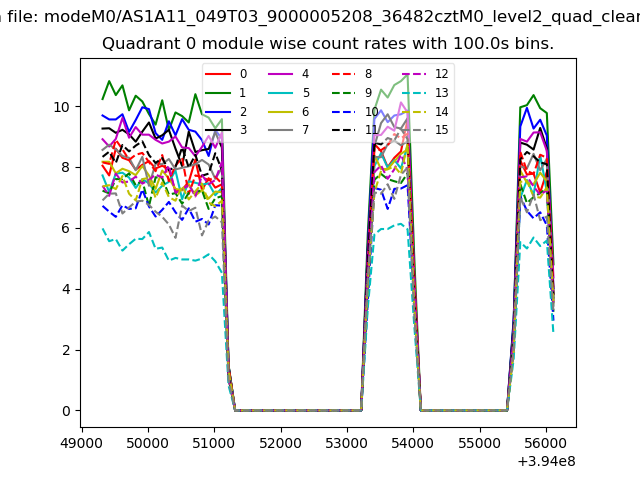 |
 |
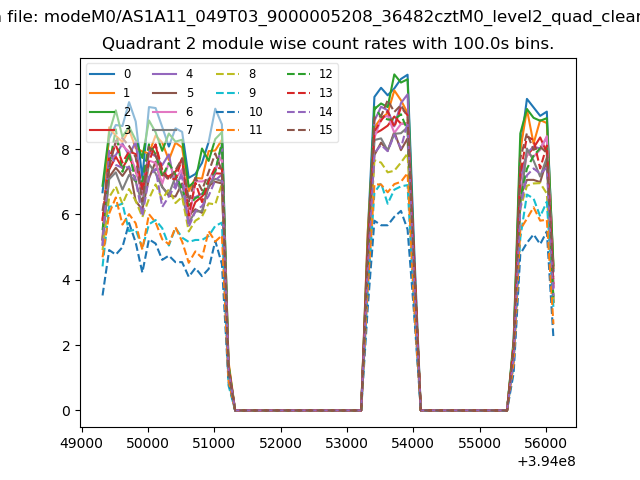
| Module-wise count rates for Quadrant B Data is divided into 100 sec bins |
 |
 |
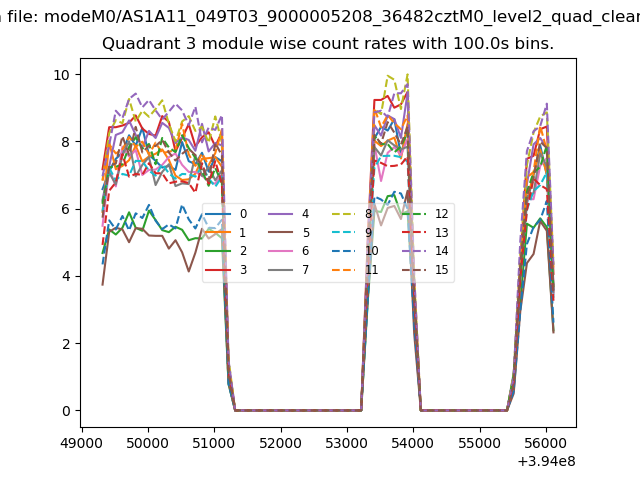
| Module-wise count rates for Quadrant C Data is divided into 100 sec bins |
 |
 |
| Module-wise count rates for Quadrant D Data is divided into 100 sec bins |
 |
 |
| Parameter | Plot |
|---|---|
| CZT HV Monitor | 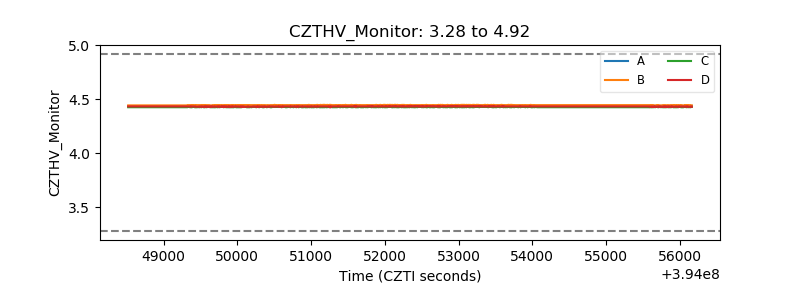 |
| D_VDD | 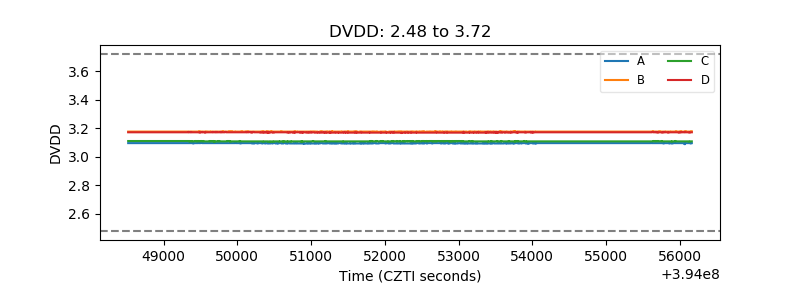 |
| Temperature 1 | 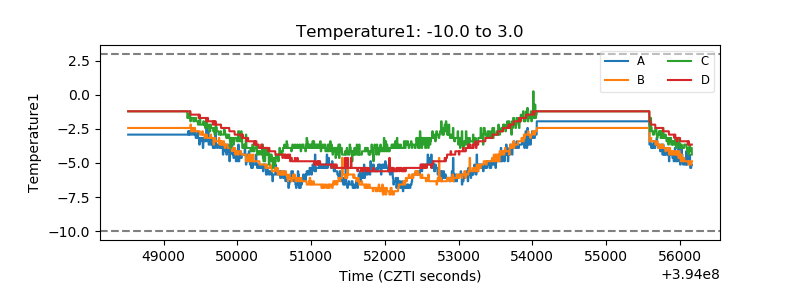 |
| Veto HV Monitor | 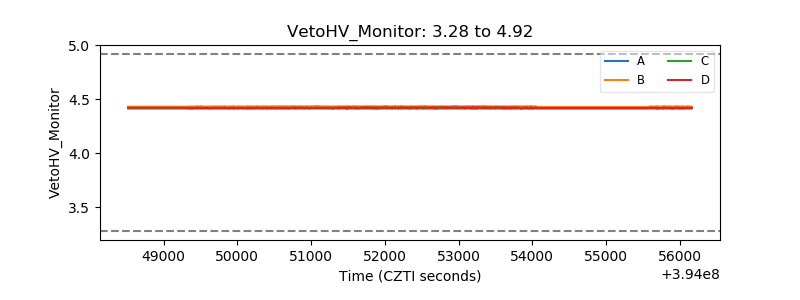 |
| Veto LLD | 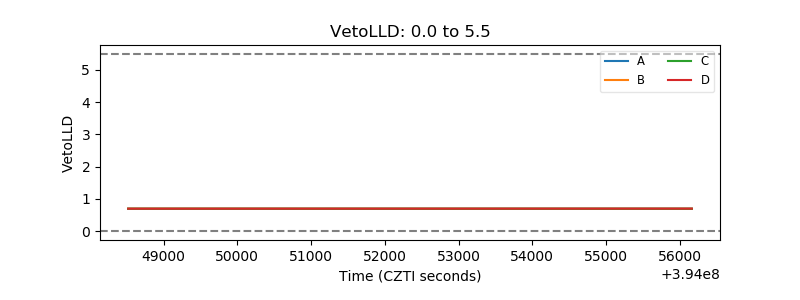 |
| Alpha Counter |  |
| _CPM_Rate | 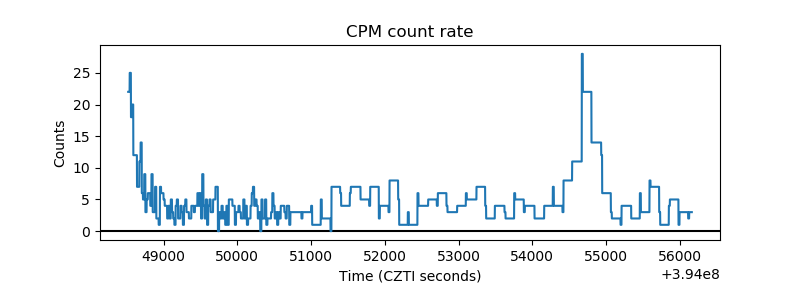 |
| CZT Counter | 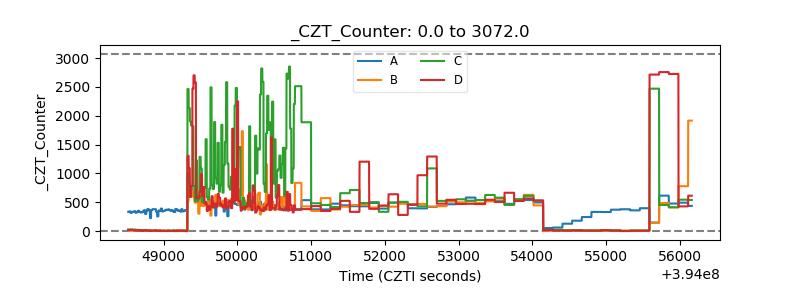 |
| +2.5 Volts monitor | 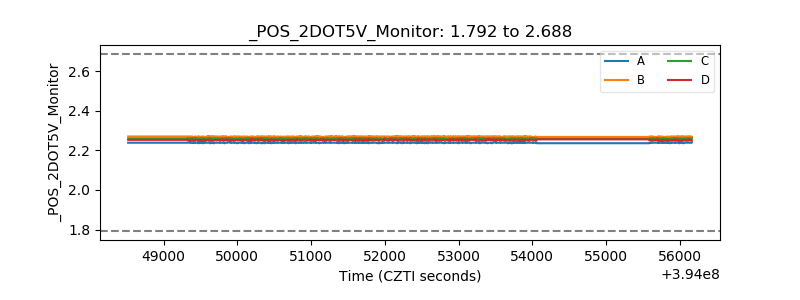 |
| +5 Volts monitor | 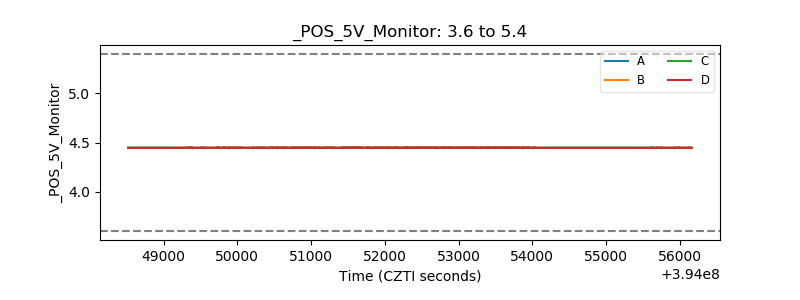 |
| _ROLL_ROT | 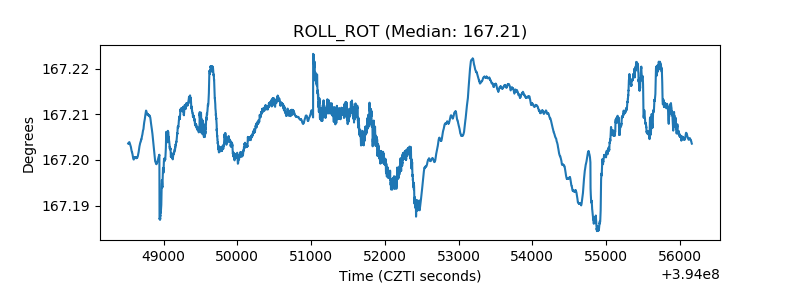 |
| _Roll_DEC | 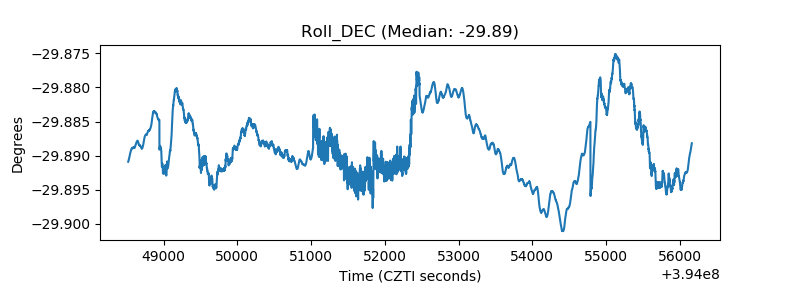 |
| _Roll_RA | 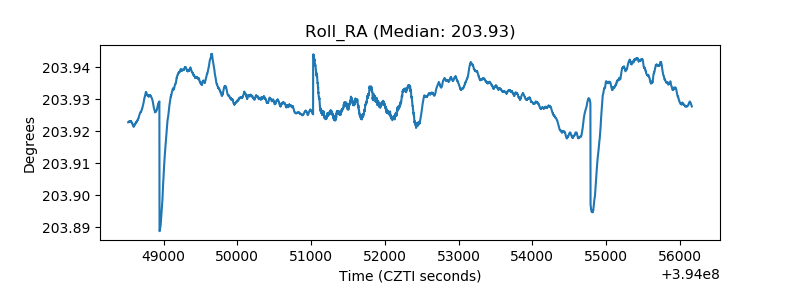 |
| Veto Counter | 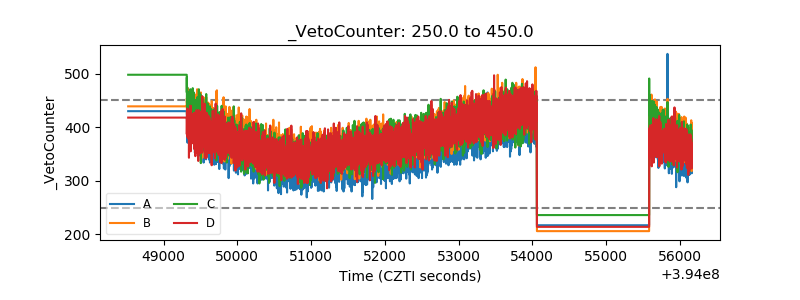 |