| Param | Original file | Final file |
|---|---|---|
| Filename | modeM0/AS1A11_049T03_9000005208_36480cztM0_level2.evt | modeM0/AS1A11_049T03_9000005208_36480cztM0_level2_quad_clean.evt |
| Size (bytes) | 430,214,400 | 74,917,440 |
| Size | 410.3 MB | 71.4 MB |
| Events in quadrant A | 2,533,623 | 500,526 |
| Events in quadrant B | 3,273,145 | 487,380 |
| Events in quadrant C | 3,334,606 | 463,192 |
| Events in quadrant D | 3,543,246 | 461,878 |
| Mode M9 | |||
|---|---|---|---|
| Quadrant | BADHDUFLAG | Total packets | Discarded packets |
| A | 0 | 26 | 0 |
| B | 0 | 26 | 0 |
| C | 0 | 26 | 0 |
| D | 0 | 27 | 0 |
| Mode M0 | |||
|---|---|---|---|
| Quadrant | BADHDUFLAG | Total packets | Discarded packets |
| A | 0 | 10730 | 3 |
| B | 0 | 13144 | 2 |
| C | 0 | 13032 | 2 |
| D | 0 | 13915 | 2 |
| Mode SS | |||
|---|---|---|---|
| Quadrant | BADHDUFLAG | Total packets | Discarded packets |
| A | 0 | 104 | 0 |
| B | 0 | 104 | 0 |
| C | 0 | 104 | 0 |
| D | 0 | 104 | 0 |
| Quadrant | Total seconds | Saturated seconds | Saturation percentage |
|---|---|---|---|
| A | 5069 | 4 | 0.078911% |
| B | 5069 | 113 | 2.229237% |
| C | 5069 | 241 | 4.754389% |
| D | 5069 | 240 | 4.734662% |
Noise dominated data is calculated using 1-second bins in cleaned event files. If a bin has >2000 counts, and if more than 50% of those come from <1% of pixels, then it is considered to be noise-dominated and hence unusable.
| Quadrant | # 1 sec bins | Bins with >0 counts | Bins with >2000 counts | High rate bins dominated by noise | Noise dominated (total time) | Noise dominated (detector-on time) | Marked lightcurve |
|---|---|---|---|---|---|---|---|
| A | 7161 | 5070 | 1 | 1 | 0.01% | 0.02% | 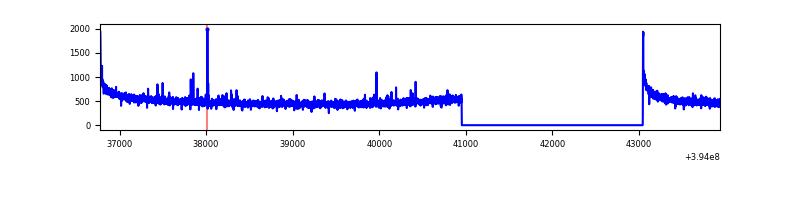 |
| B | 7161 | 5070 | 74 | 74 | 1.03% | 1.46% | 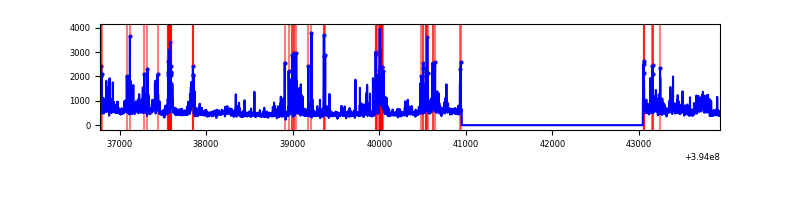 |
| C | 7161 | 5070 | 175 | 175 | 2.44% | 3.45% | 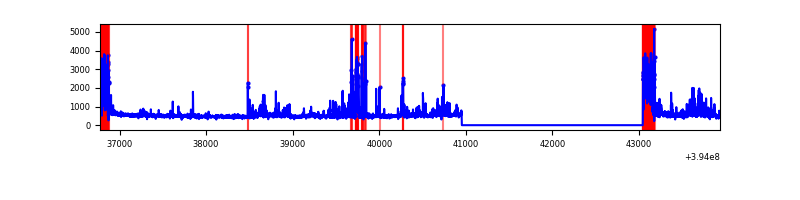 |
| D | 7161 | 5070 | 211 | 211 | 2.95% | 4.16% | 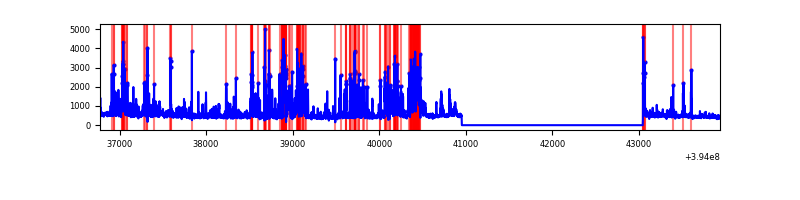 |
Top three noisy pixels from each quadrant. If the there are fewer than three noisy pixels in the level2.evt file, extra rows are filled as -1
| Pixel properties | Quadrant properties | ||||||
|---|---|---|---|---|---|---|---|
| Quadrant | DetID | PixID | Counts | Sigma | Mean | Median | Sigma |
| A | 10 | 83 | 197106 | 1620.66 | 597 | 587 | 121.3 |
| A | 9 | 143 | 20863 | 167.21 | 597 | 587 | 121.3 |
| A | 13 | 254 | 9453 | 73.12 | 597 | 587 | 121.3 |
| B | 5 | 172 | 637324 | 5740.21 | 581 | 567 | 110.9 |
| B | 5 | 255 | 187321 | 1683.54 | 581 | 567 | 110.9 |
| B | 0 | 190 | 49231 | 438.69 | 581 | 567 | 110.9 |
| C | 0 | 10 | 534681 | 4189.19 | 548 | 551 | 127.5 |
| C | 0 | 207 | 443290 | 3472.41 | 548 | 551 | 127.5 |
| C | 15 | 214 | 216448 | 1693.28 | 548 | 551 | 127.5 |
| D | 13 | 249 | 701973 | 5110.85 | 561 | 546 | 137.2 |
| D | 10 | 118 | 294121 | 2139.09 | 561 | 546 | 137.2 |
| D | 2 | 250 | 126966 | 921.14 | 561 | 546 | 137.2 |
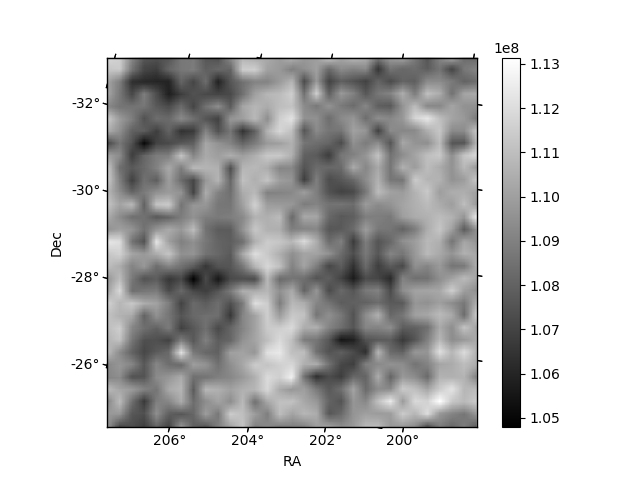
Histogram calculated using DETX and DETY for each event in the final _common_clean file
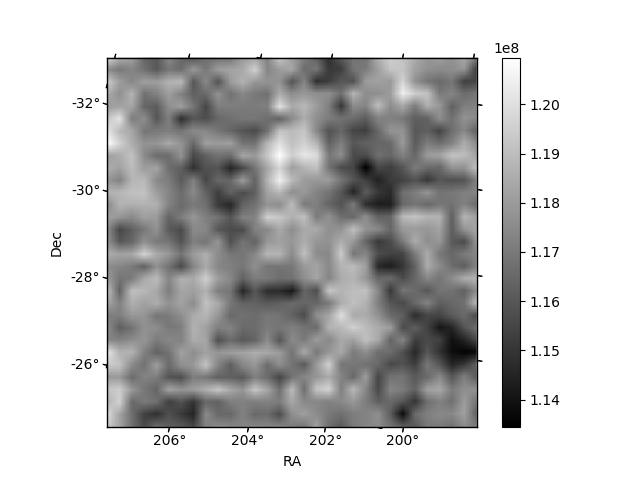
| Quadrant A | 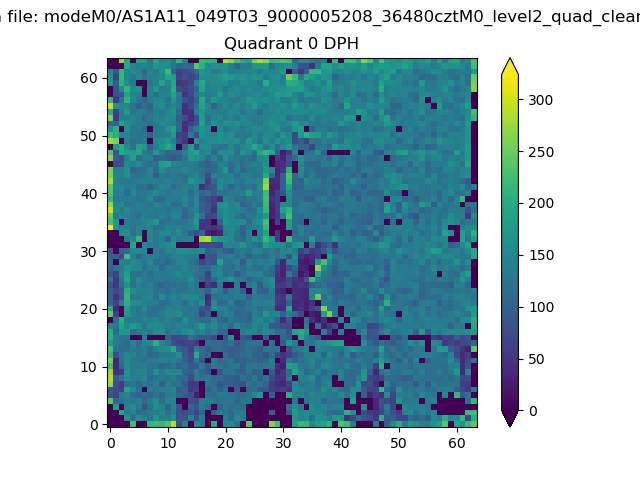 |
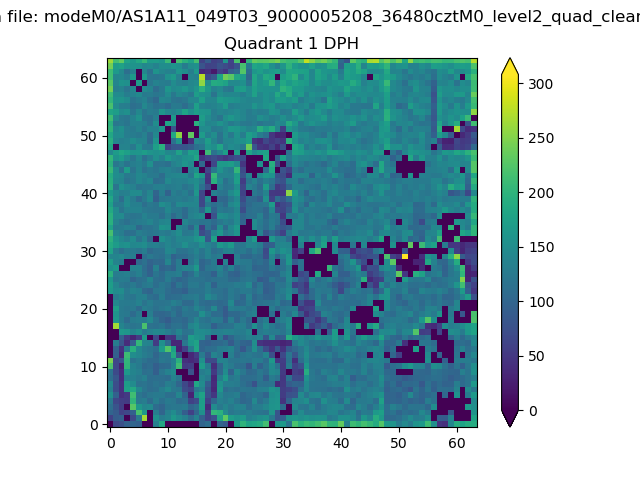 |
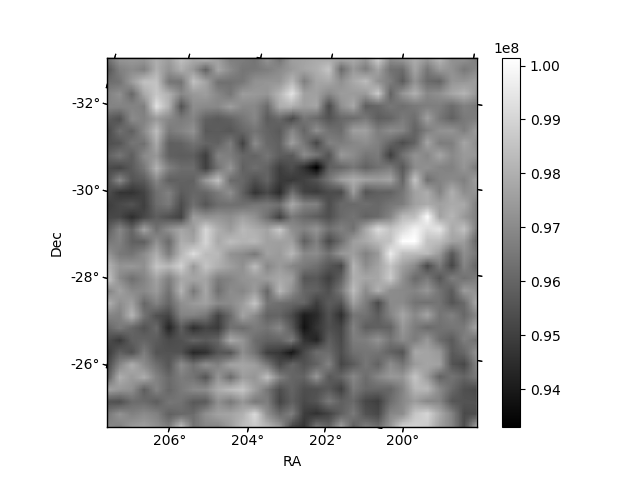
Quadrant B |
|---|---|---|---|
| Quadrant D | 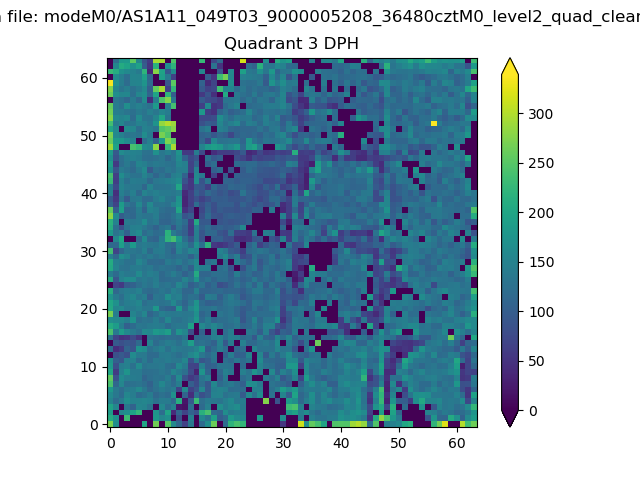 |
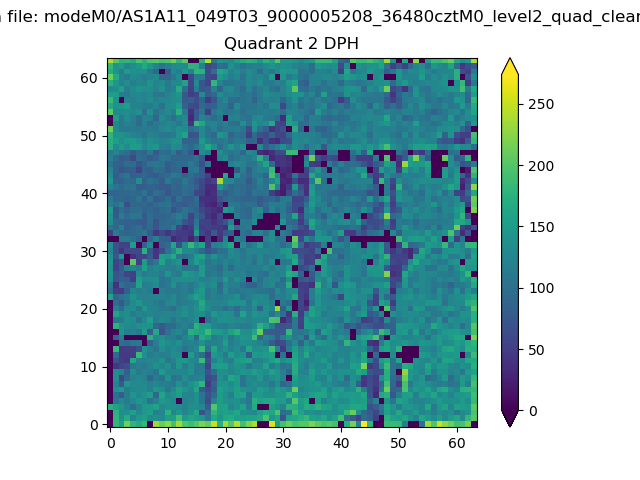 |
Quadrant C |
| Plot type | Count rate plots | Images |
|---|---|---|
| Comparison with Poisson distribution Blue bars denote a histogram of data divided into 1 sec bins. Red curve is a Poisson curve with rate = median count rate of data. |
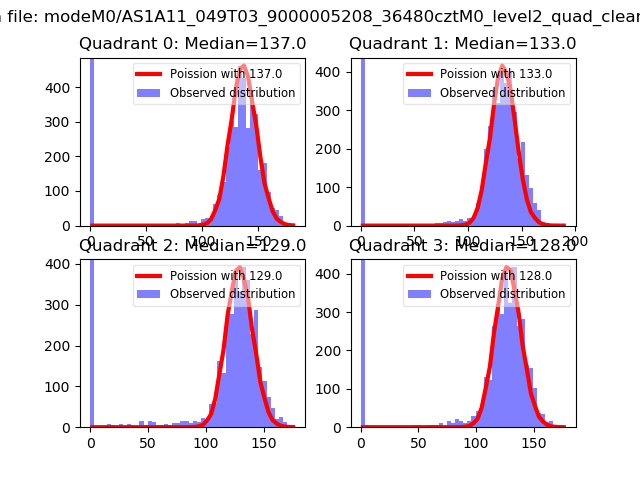 |
 |
| Quadrant-wise count rates Data is divided into 100 sec bins |
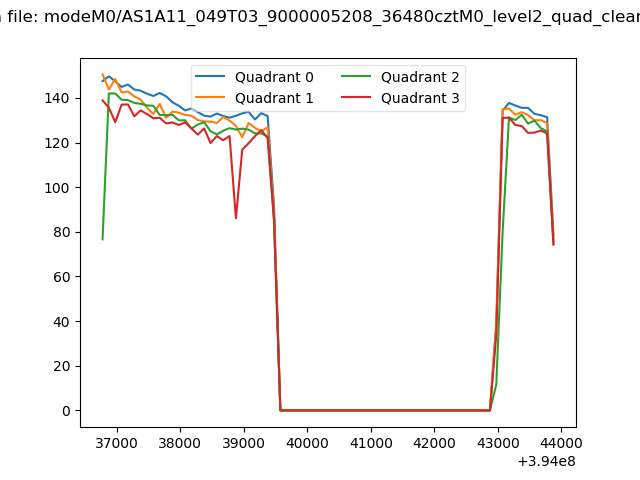 |
|
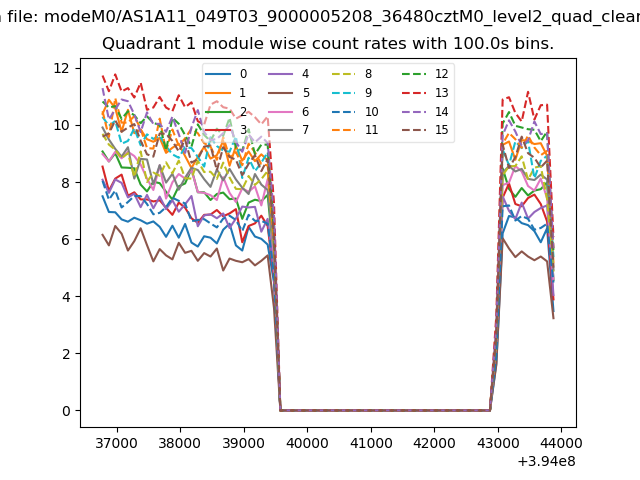
| Module-wise count rates for Quadrant A Data is divided into 100 sec bins |
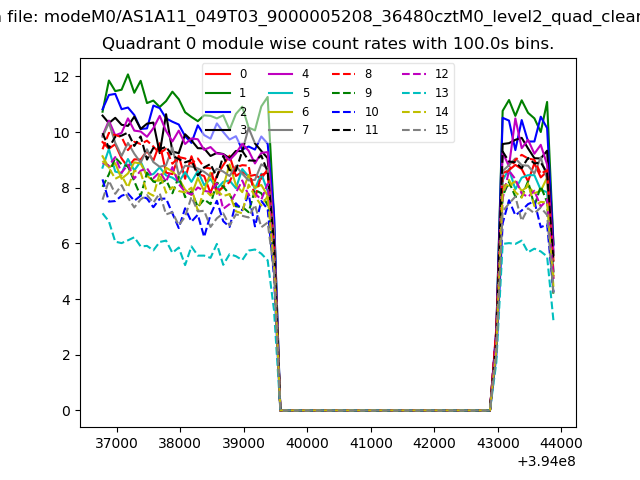 |
 |
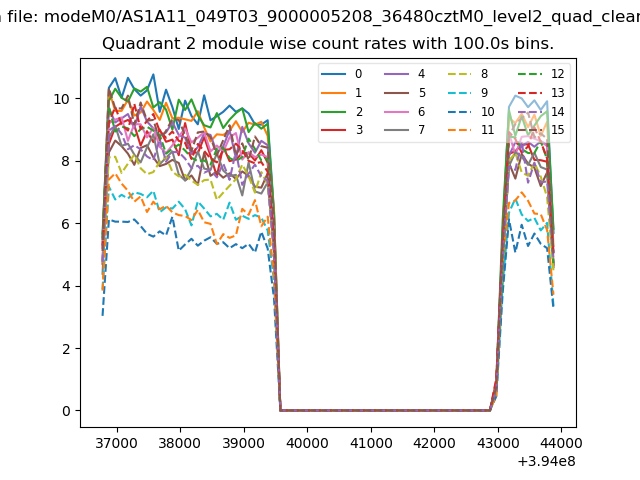
| Module-wise count rates for Quadrant B Data is divided into 100 sec bins |
 |
 |
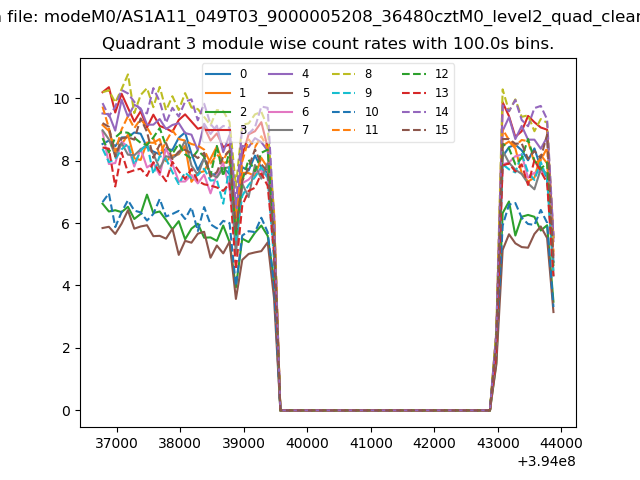
| Module-wise count rates for Quadrant C Data is divided into 100 sec bins |
 |
 |
| Module-wise count rates for Quadrant D Data is divided into 100 sec bins |
 |
 |
| Parameter | Plot |
|---|---|
| CZT HV Monitor | 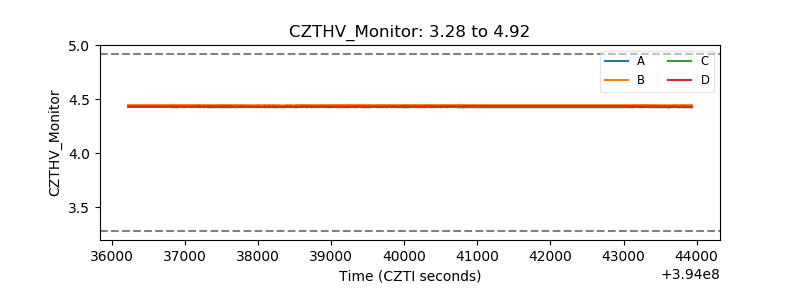 |
| D_VDD | 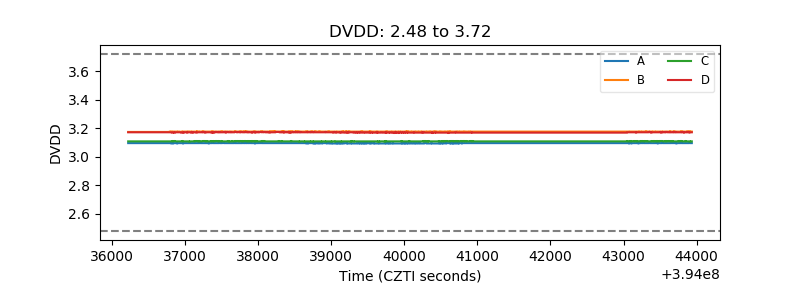 |
| Temperature 1 | 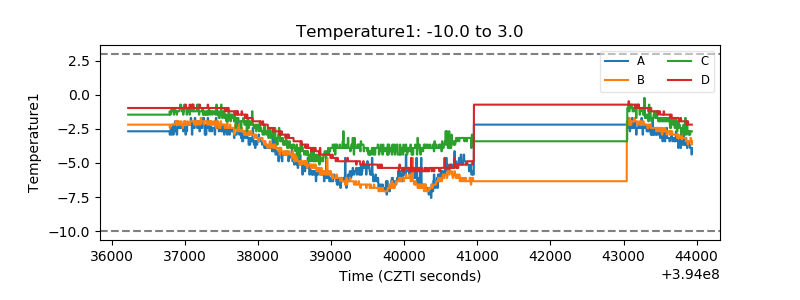 |
| Veto HV Monitor | 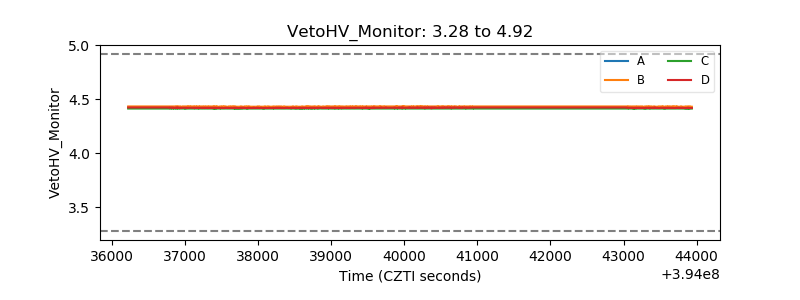 |
| Veto LLD | 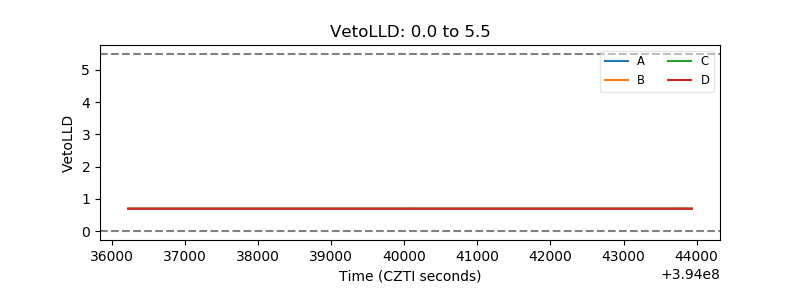 |
| Alpha Counter | 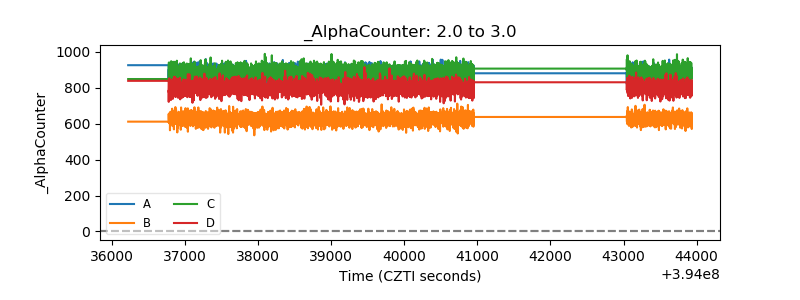 |
| _CPM_Rate | 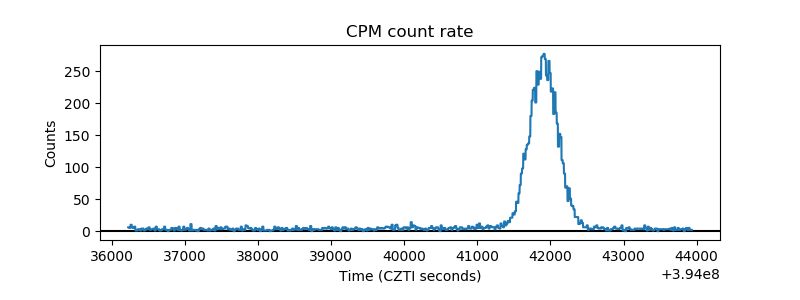 |
| CZT Counter | 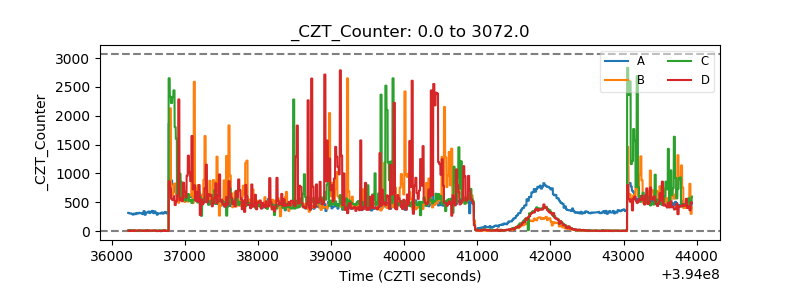 |
| +2.5 Volts monitor | 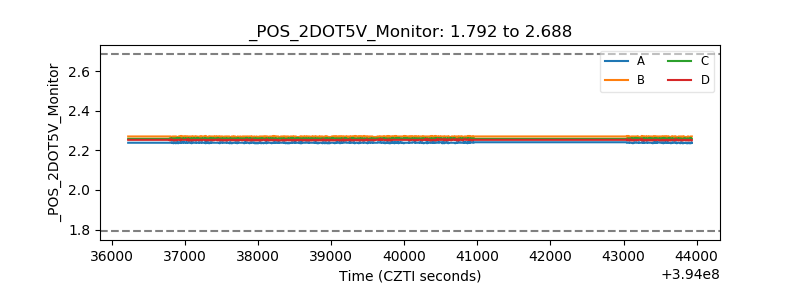 |
| +5 Volts monitor | 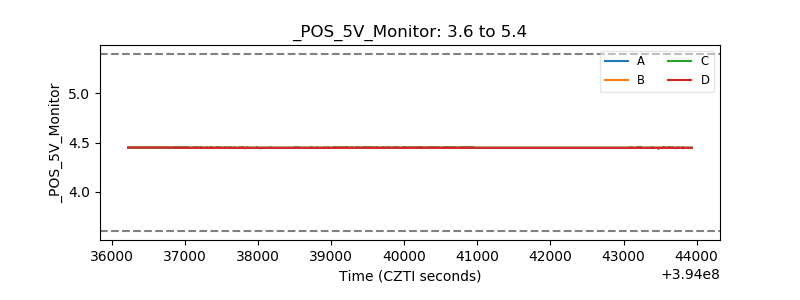 |
| _ROLL_ROT | 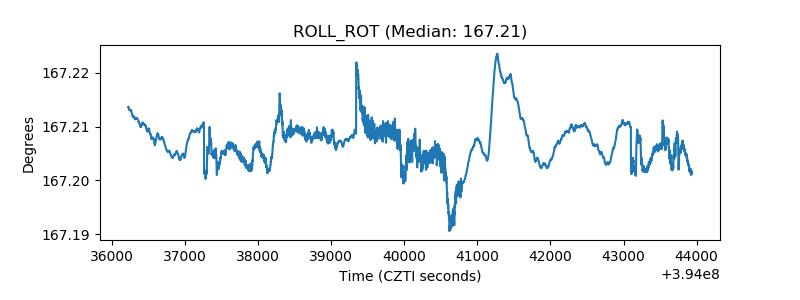 |
| _Roll_DEC | 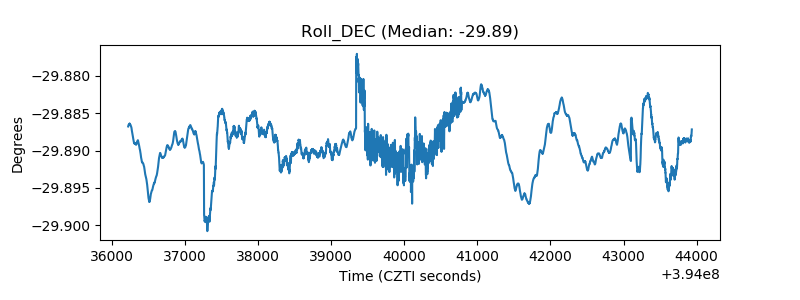 |
| _Roll_RA | 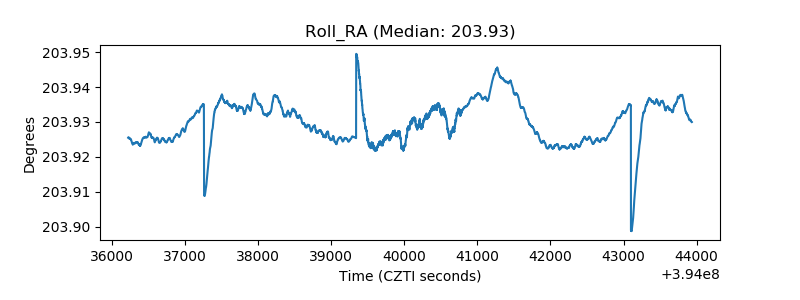 |
| Veto Counter | 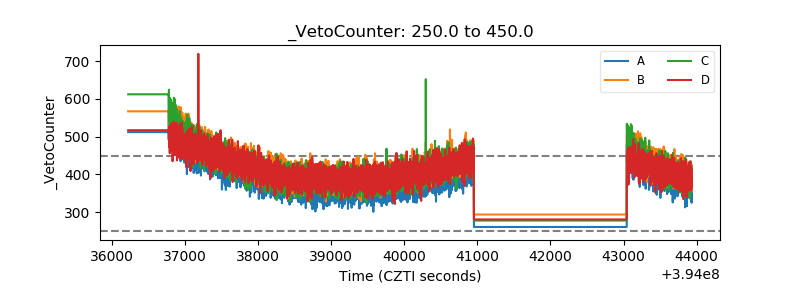 |