| Param | Original file | Final file |
|---|---|---|
| Filename | modeM0/AS1A11_049T03_9000005208_36478cztM0_level2.evt | modeM0/AS1A11_049T03_9000005208_36478cztM0_level2_quad_clean.evt |
| Size (bytes) | 432,599,040 | 95,483,520 |
| Size | 412.6 MB | 91.1 MB |
| Events in quadrant A | 2,688,225 | 664,136 |
| Events in quadrant B | 3,211,507 | 646,528 |
| Events in quadrant C | 3,532,280 | 620,958 |
| Events in quadrant D | 3,332,474 | 612,044 |
| Mode M9 | |||
|---|---|---|---|
| Quadrant | BADHDUFLAG | Total packets | Discarded packets |
| A | 0 | 33 | 0 |
| B | 0 | 33 | 0 |
| C | 0 | 33 | 0 |
| D | 0 | 34 | 0 |
| Mode M0 | |||
|---|---|---|---|
| Quadrant | BADHDUFLAG | Total packets | Discarded packets |
| A | 0 | 10984 | 3 |
| B | 0 | 12714 | 2 |
| C | 0 | 13721 | 2 |
| D | 0 | 13186 | 2 |
| Mode SS | |||
|---|---|---|---|
| Quadrant | BADHDUFLAG | Total packets | Discarded packets |
| A | 0 | 100 | 0 |
| B | 0 | 100 | 0 |
| C | 0 | 100 | 0 |
| D | 0 | 100 | 0 |
| Quadrant | Total seconds | Saturated seconds | Saturation percentage |
|---|---|---|---|
| A | 4963 | 9 | 0.181342% |
| B | 4963 | 152 | 3.062664% |
| C | 4963 | 181 | 3.646988% |
| D | 4963 | 177 | 3.566391% |
Noise dominated data is calculated using 1-second bins in cleaned event files. If a bin has >2000 counts, and if more than 50% of those come from <1% of pixels, then it is considered to be noise-dominated and hence unusable.
| Quadrant | # 1 sec bins | Bins with >0 counts | Bins with >2000 counts | High rate bins dominated by noise | Noise dominated (total time) | Noise dominated (detector-on time) | Marked lightcurve |
|---|---|---|---|---|---|---|---|
| A | 7055 | 4964 | 1 | 1 | 0.01% | 0.02% | 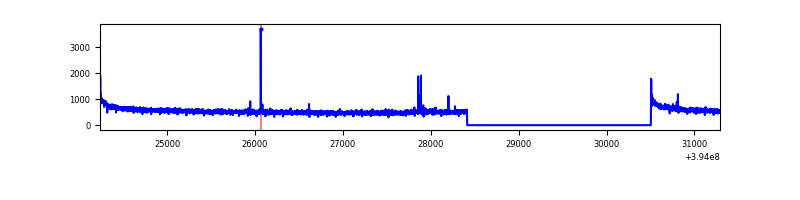 |
| B | 7055 | 4964 | 106 | 106 | 1.50% | 2.14% | 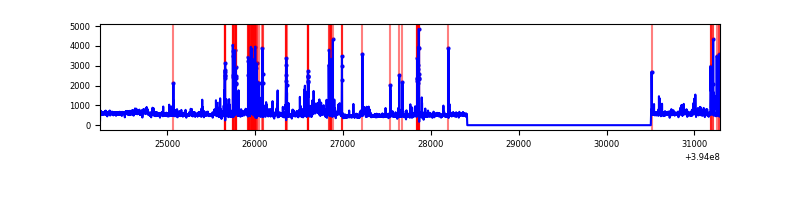 |
| C | 7055 | 4964 | 129 | 129 | 1.83% | 2.60% | 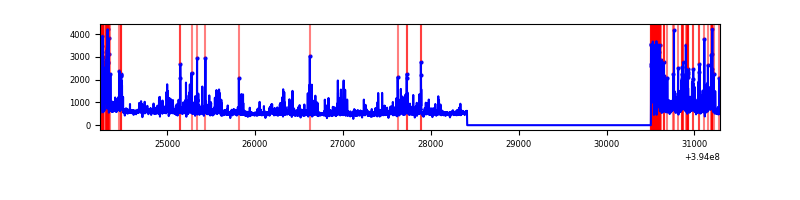 |
| D | 7055 | 4964 | 123 | 123 | 1.74% | 2.48% | 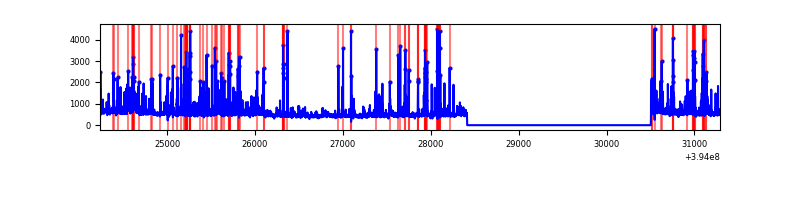 |
Top three noisy pixels from each quadrant. If the there are fewer than three noisy pixels in the level2.evt file, extra rows are filled as -1
| Pixel properties | Quadrant properties | ||||||
|---|---|---|---|---|---|---|---|
| Quadrant | DetID | PixID | Counts | Sigma | Mean | Median | Sigma |
| A | 10 | 83 | 191063 | 1496.92 | 637 | 626 | 127.2 |
| A | 9 | 143 | 22299 | 170.36 | 637 | 626 | 127.2 |
| A | 13 | 6 | 11582 | 86.12 | 637 | 626 | 127.2 |
| B | 5 | 172 | 402602 | 3495.65 | 611 | 599 | 115.0 |
| B | 0 | 189 | 114043 | 986.46 | 611 | 599 | 115.0 |
| B | 5 | 255 | 106986 | 925.1 | 611 | 599 | 115.0 |
| C | 0 | 10 | 940762 | 6936.01 | 589 | 594 | 135.5 |
| C | 15 | 214 | 215004 | 1581.79 | 589 | 594 | 135.5 |
| C | 0 | 207 | 44867 | 326.62 | 589 | 594 | 135.5 |
| D | 13 | 249 | 533849 | 3663.47 | 606 | 591 | 145.6 |
| D | 10 | 199 | 85498 | 583.31 | 606 | 591 | 145.6 |
| D | 12 | 6 | 83628 | 570.46 | 606 | 591 | 145.6 |
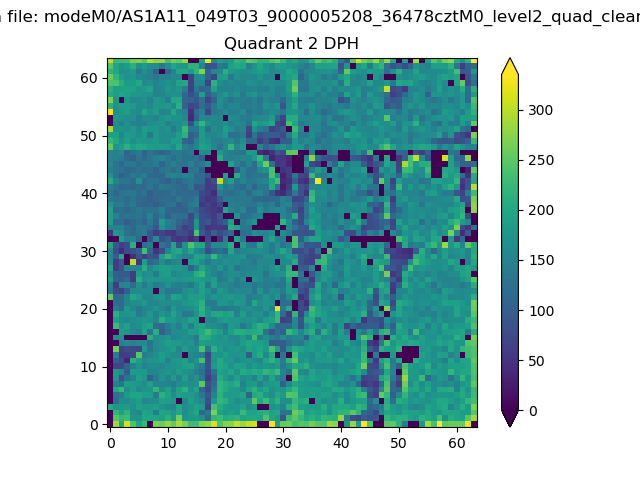
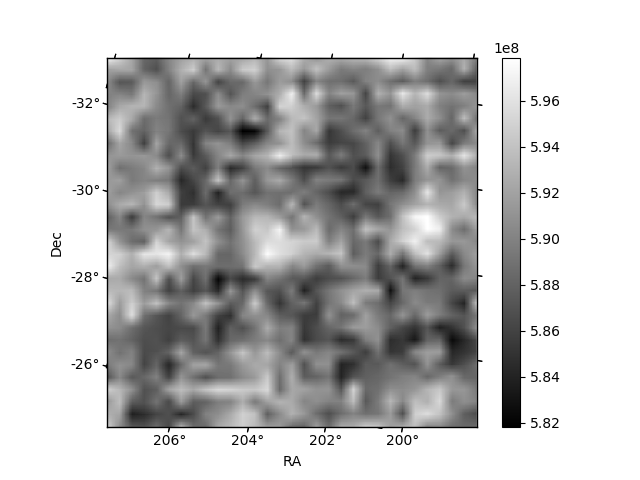
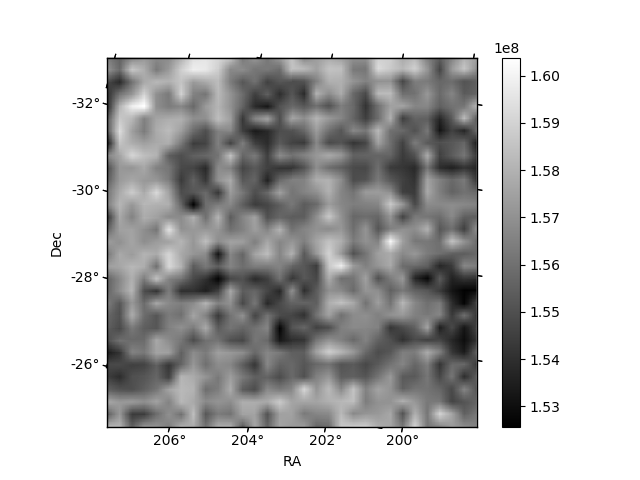
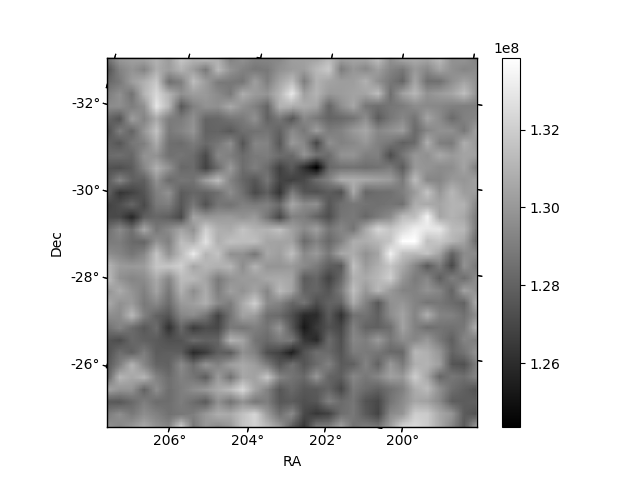
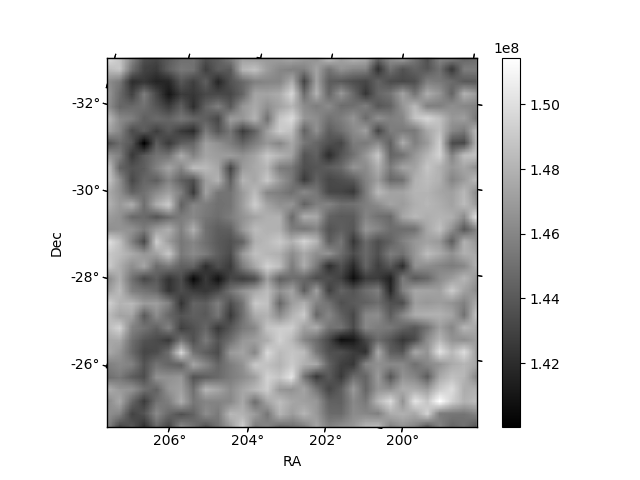
Histogram calculated using DETX and DETY for each event in the final _common_clean file
| Quadrant A | 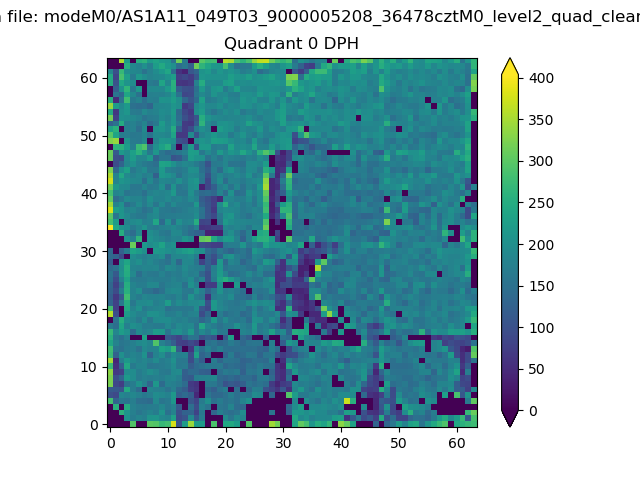 |
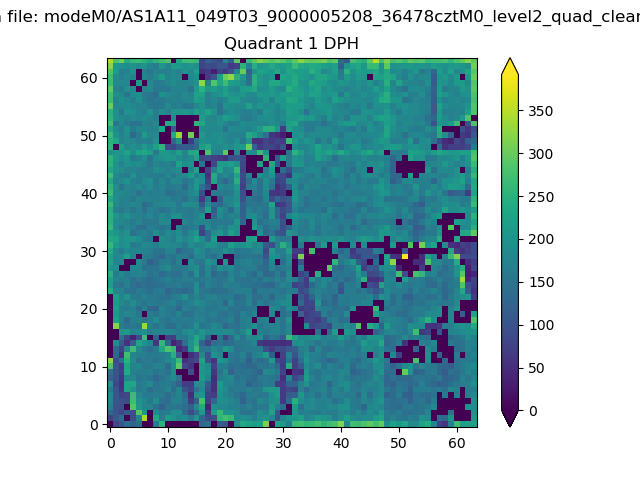 |
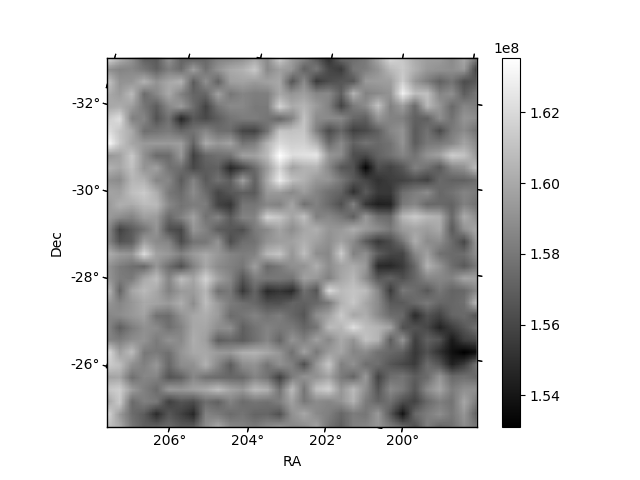
Quadrant B |
|---|---|---|---|
| Quadrant D | 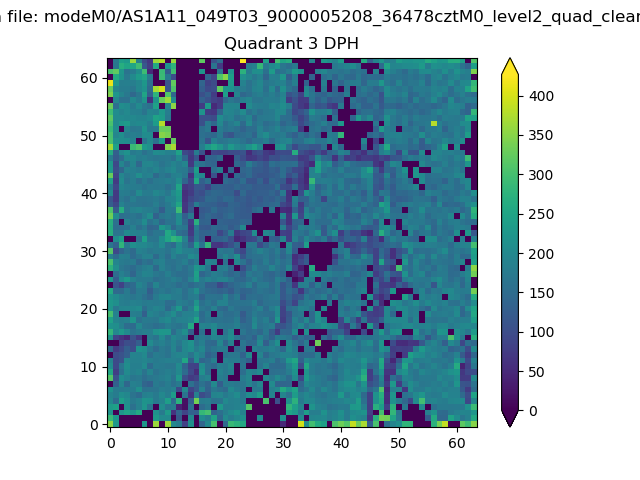 |
 |
Quadrant C |
| Plot type | Count rate plots | Images |
|---|---|---|
| Comparison with Poisson distribution Blue bars denote a histogram of data divided into 1 sec bins. Red curve is a Poisson curve with rate = median count rate of data. |
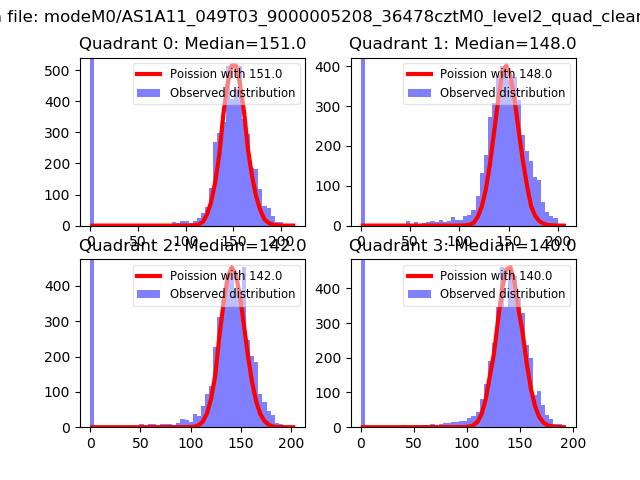 |
 |
| Quadrant-wise count rates Data is divided into 100 sec bins |
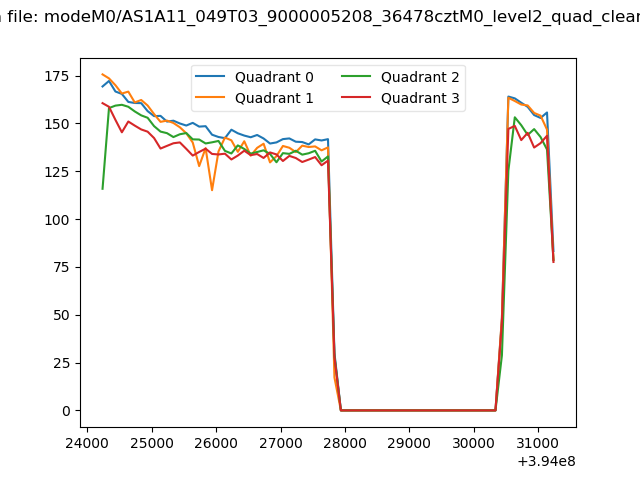 |
|
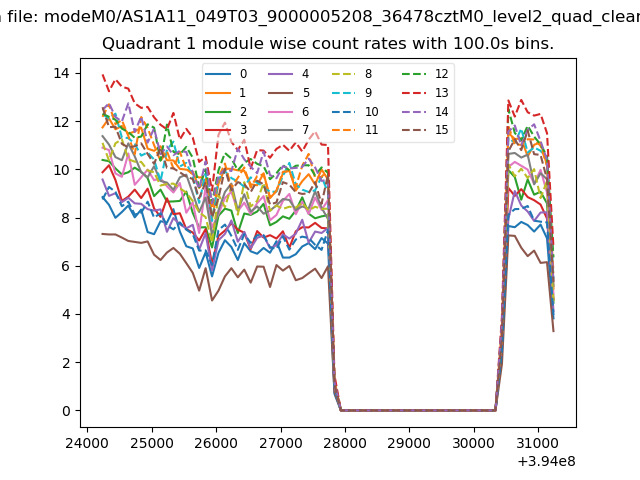
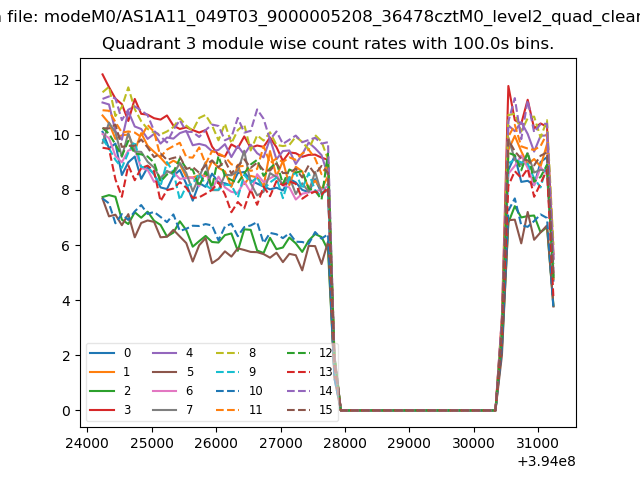
| Module-wise count rates for Quadrant A Data is divided into 100 sec bins |
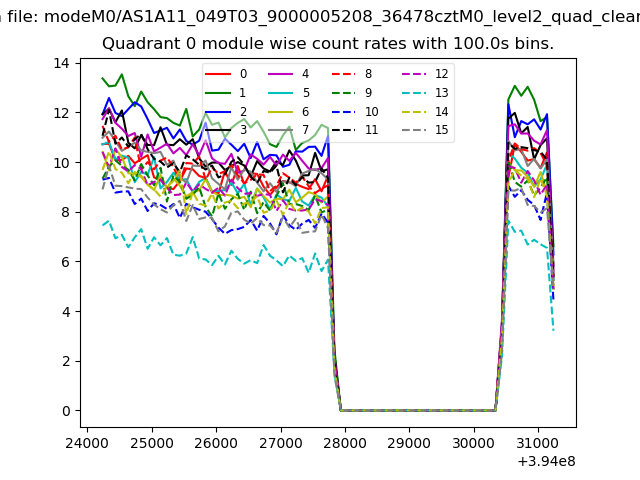 |
 |
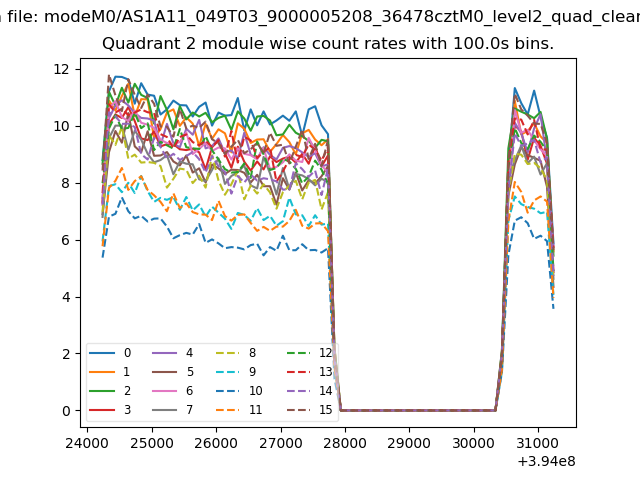
| Module-wise count rates for Quadrant B Data is divided into 100 sec bins |
 |
 |
| Module-wise count rates for Quadrant C Data is divided into 100 sec bins |
 |
 |
| Module-wise count rates for Quadrant D Data is divided into 100 sec bins |
 |
 |
| Parameter | Plot |
|---|---|
| CZT HV Monitor | 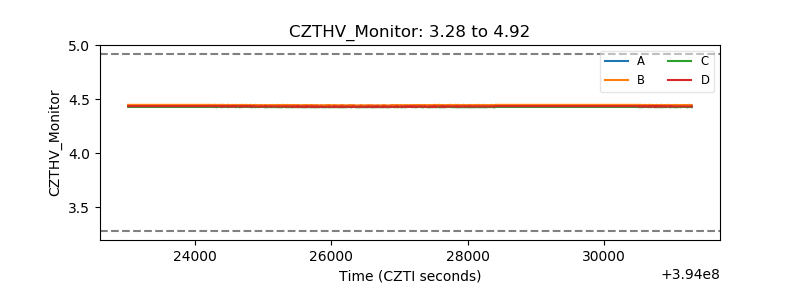 |
| D_VDD | 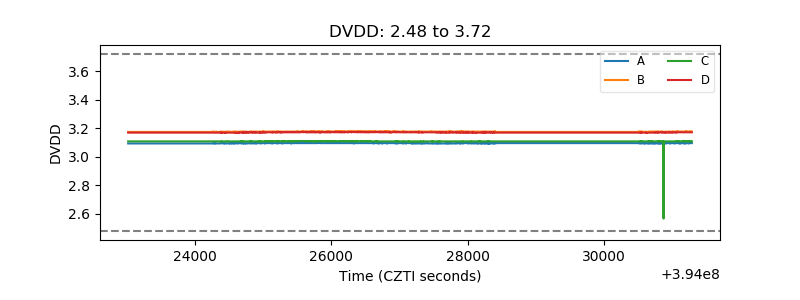 |
| Temperature 1 | 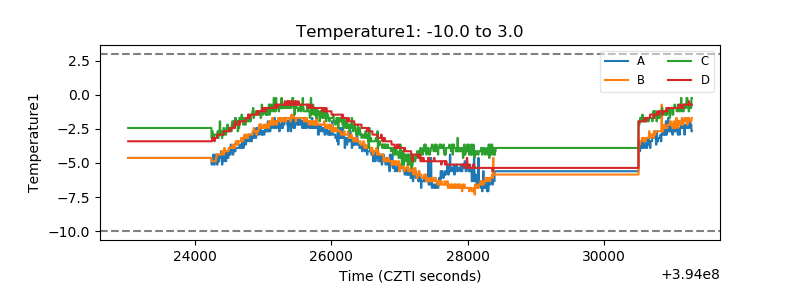 |
| Veto HV Monitor | 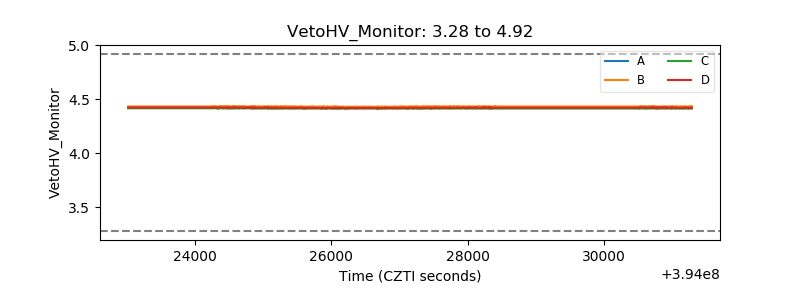 |
| Veto LLD | 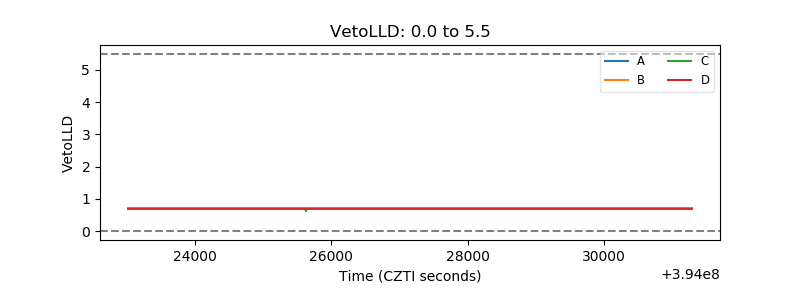 |
| Alpha Counter | 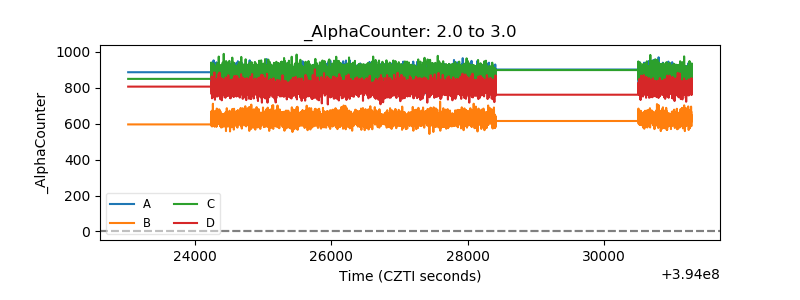 |
| _CPM_Rate | 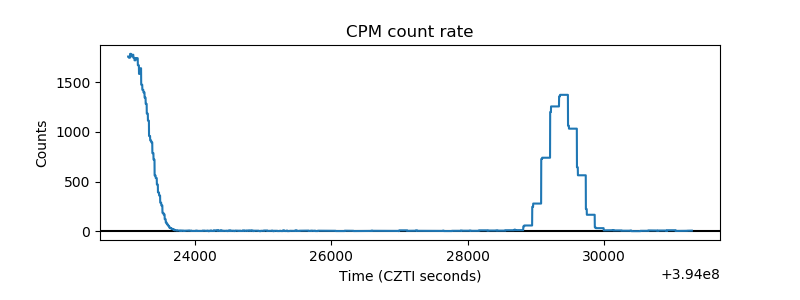 |
| CZT Counter | 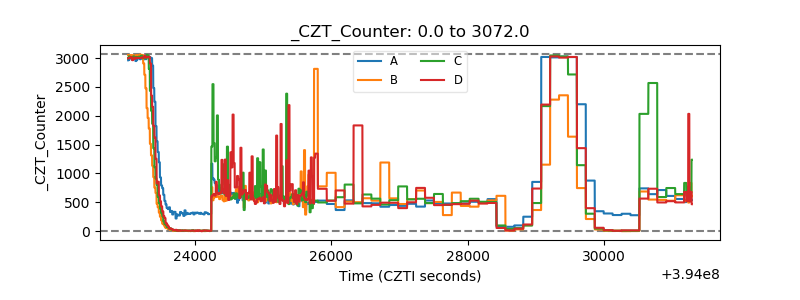 |
| +2.5 Volts monitor | 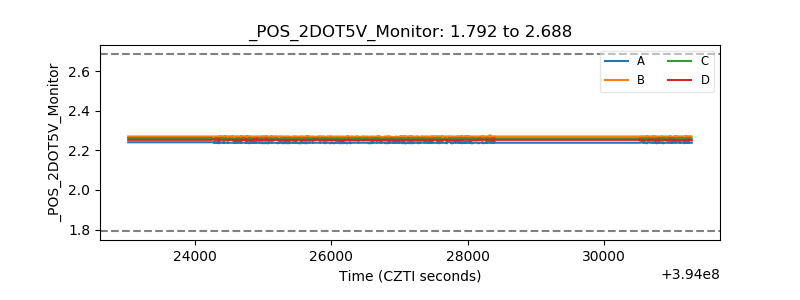 |
| +5 Volts monitor | 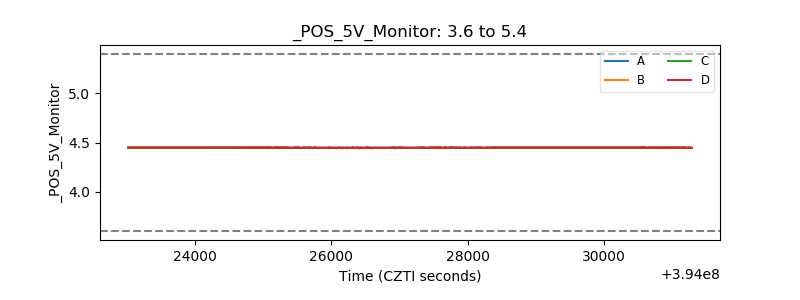 |
| _ROLL_ROT | 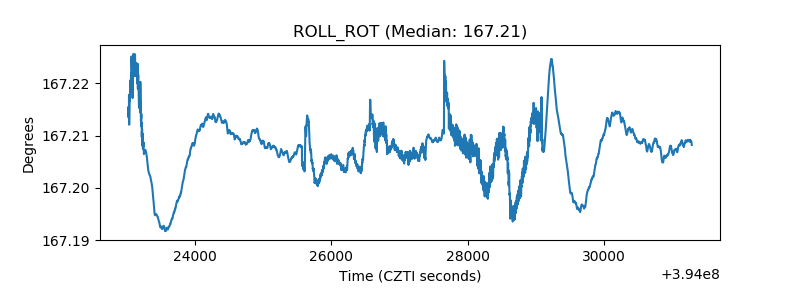 |
| _Roll_DEC | 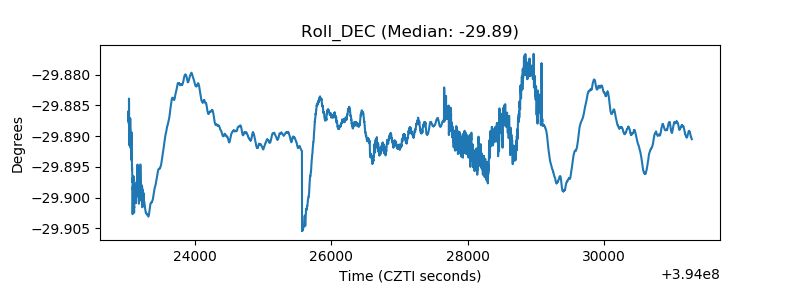 |
| _Roll_RA | 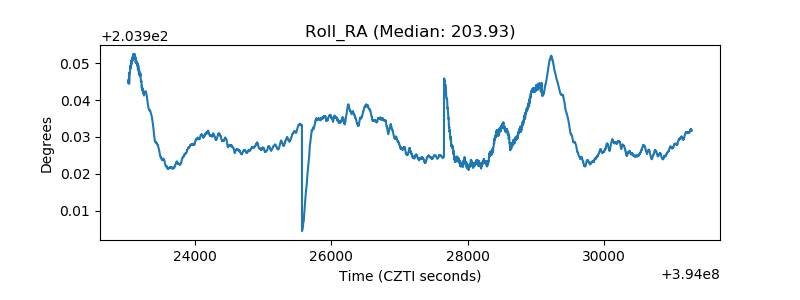 |
| Veto Counter | 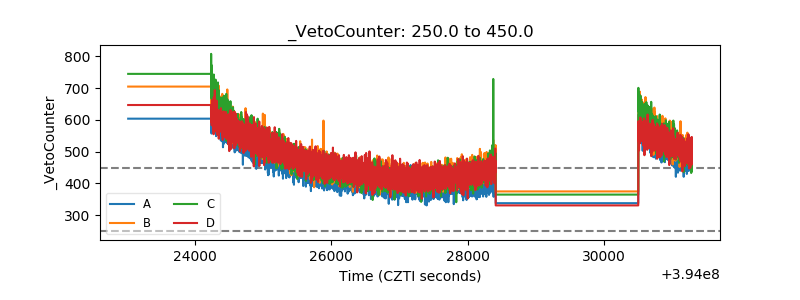 |