| Param | Original file | Final file |
|---|---|---|
| Filename | modeM0/AS1A11_049T03_9000005208_36477cztM0_level2.evt | modeM0/AS1A11_049T03_9000005208_36477cztM0_level2_quad_clean.evt |
| Size (bytes) | 429,180,480 | 97,286,400 |
| Size | 409.3 MB | 92.8 MB |
| Events in quadrant A | 2,769,432 | 665,999 |
| Events in quadrant B | 2,836,622 | 667,271 |
| Events in quadrant C | 3,107,172 | 644,013 |
| Events in quadrant D | 3,939,002 | 612,359 |
| Mode M9 | |||
|---|---|---|---|
| Quadrant | BADHDUFLAG | Total packets | Discarded packets |
| A | 0 | 32 | 0 |
| B | 0 | 32 | 0 |
| C | 0 | 32 | 0 |
| D | 0 | 33 | 0 |
| Mode M0 | |||
|---|---|---|---|
| Quadrant | BADHDUFLAG | Total packets | Discarded packets |
| A | 0 | 11330 | 3 |
| B | 0 | 11605 | 2 |
| C | 0 | 12367 | 2 |
| D | 0 | 15042 | 2 |
| Mode SS | |||
|---|---|---|---|
| Quadrant | BADHDUFLAG | Total packets | Discarded packets |
| A | 0 | 104 | 0 |
| B | 0 | 104 | 0 |
| C | 0 | 104 | 0 |
| D | 0 | 104 | 0 |
| Quadrant | Total seconds | Saturated seconds | Saturation percentage |
|---|---|---|---|
| A | 5088 | 11 | 0.216195% |
| B | 5088 | 15 | 0.294811% |
| C | 5088 | 121 | 2.378145% |
| D | 5088 | 198 | 3.891509% |
Noise dominated data is calculated using 1-second bins in cleaned event files. If a bin has >2000 counts, and if more than 50% of those come from <1% of pixels, then it is considered to be noise-dominated and hence unusable.
| Quadrant | # 1 sec bins | Bins with >0 counts | Bins with >2000 counts | High rate bins dominated by noise | Noise dominated (total time) | Noise dominated (detector-on time) | Marked lightcurve |
|---|---|---|---|---|---|---|---|
| A | 7092 | 5089 | 1 | 1 | 0.01% | 0.02% | 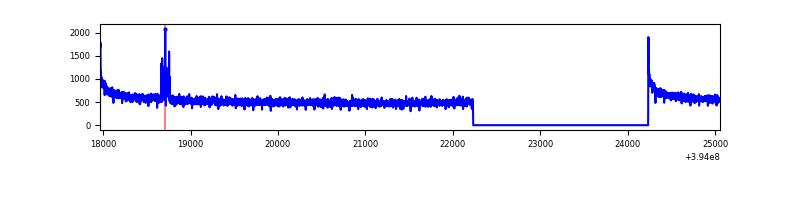 |
| B | 7092 | 5089 | 11 | 11 | 0.16% | 0.22% | 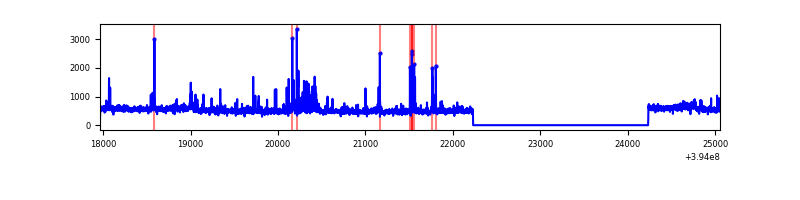 |
| C | 7092 | 5089 | 71 | 71 | 1.00% | 1.40% | 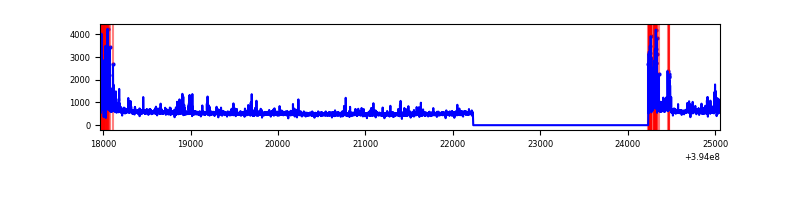 |
| D | 7092 | 5089 | 167 | 167 | 2.35% | 3.28% | 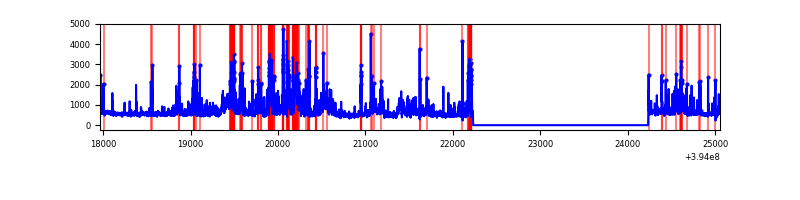 |
Top three noisy pixels from each quadrant. If the there are fewer than three noisy pixels in the level2.evt file, extra rows are filled as -1
| Pixel properties | Quadrant properties | ||||||
|---|---|---|---|---|---|---|---|
| Quadrant | DetID | PixID | Counts | Sigma | Mean | Median | Sigma |
| A | 10 | 83 | 193841 | 1483.24 | 654 | 645 | 130.3 |
| A | 10 | 248 | 35800 | 269.9 | 654 | 645 | 130.3 |
| A | 13 | 254 | 8646 | 61.43 | 654 | 645 | 130.3 |
| B | 0 | 189 | 80168 | 654.52 | 638 | 623 | 121.5 |
| B | 5 | 172 | 58730 | 478.12 | 638 | 623 | 121.5 |
| B | 4 | 171 | 53640 | 436.24 | 638 | 623 | 121.5 |
| C | 0 | 10 | 450427 | 3194.82 | 613 | 620 | 140.8 |
| C | 15 | 214 | 219838 | 1557.03 | 613 | 620 | 140.8 |
| C | 0 | 207 | 36650 | 255.91 | 613 | 620 | 140.8 |
| D | 12 | 235 | 659335 | 4369.18 | 623 | 608 | 150.8 |
| D | 13 | 249 | 430791 | 2853.3 | 623 | 608 | 150.8 |
| D | 10 | 199 | 95304 | 628.1 | 623 | 608 | 150.8 |
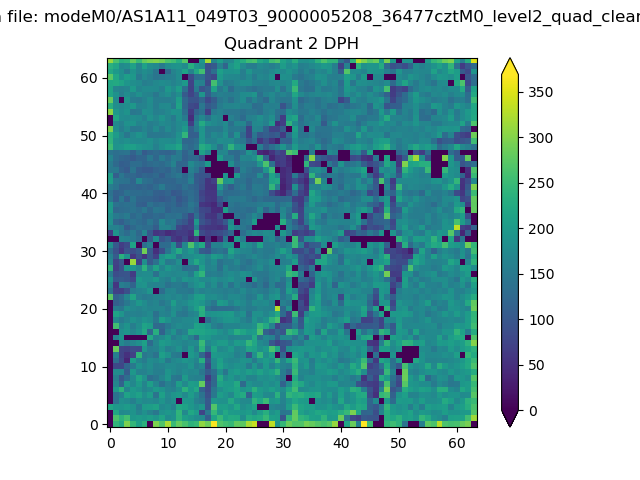
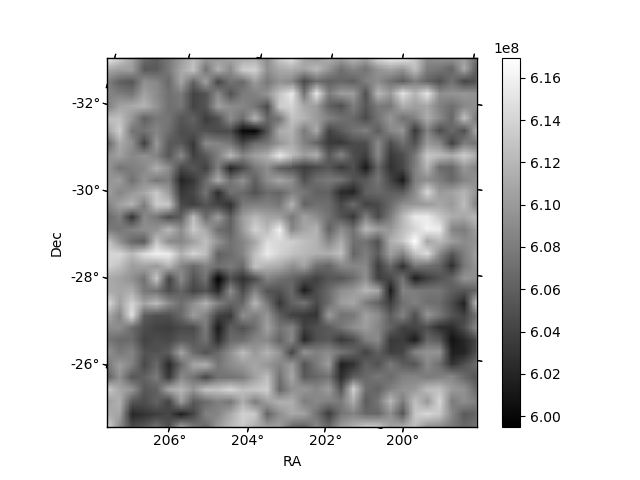
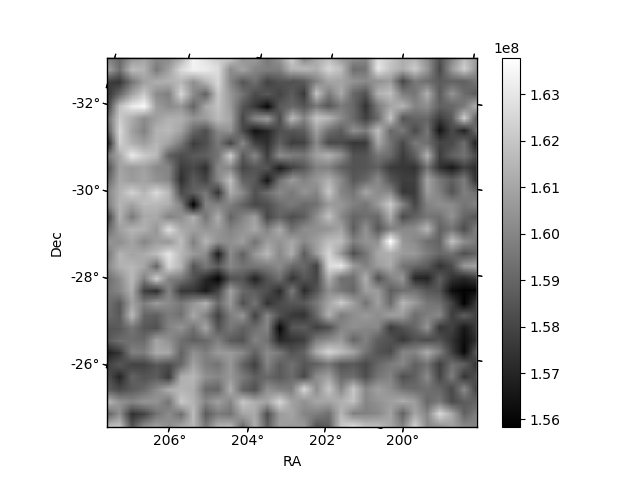
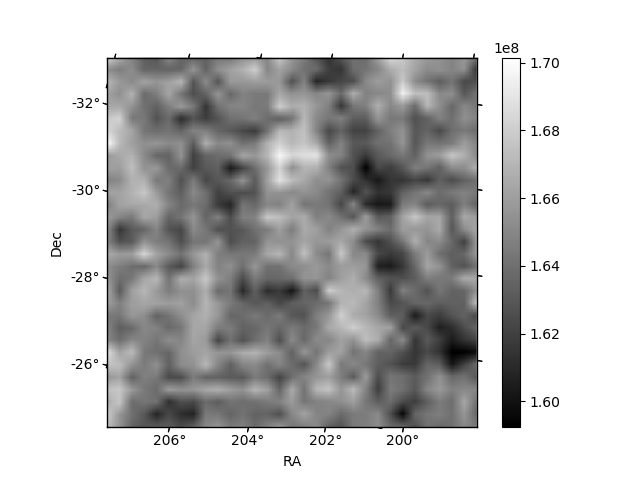
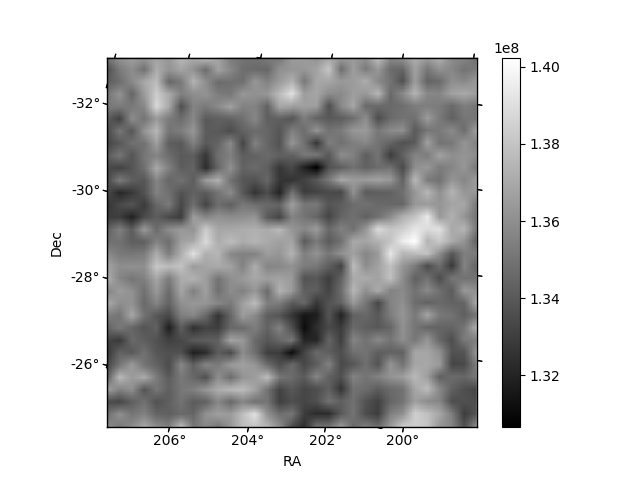
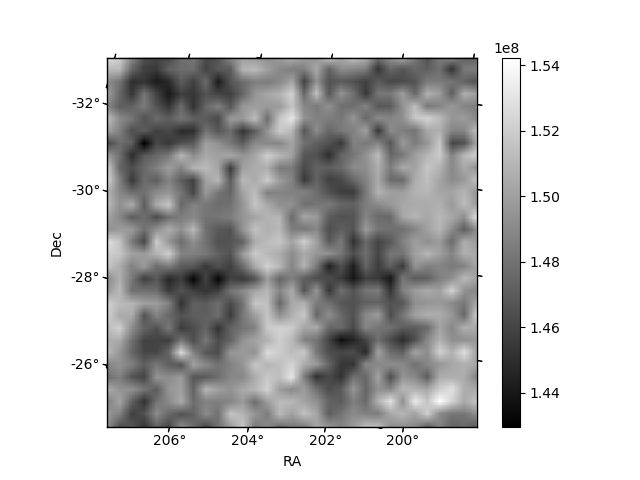
Histogram calculated using DETX and DETY for each event in the final _common_clean file
| Quadrant A | 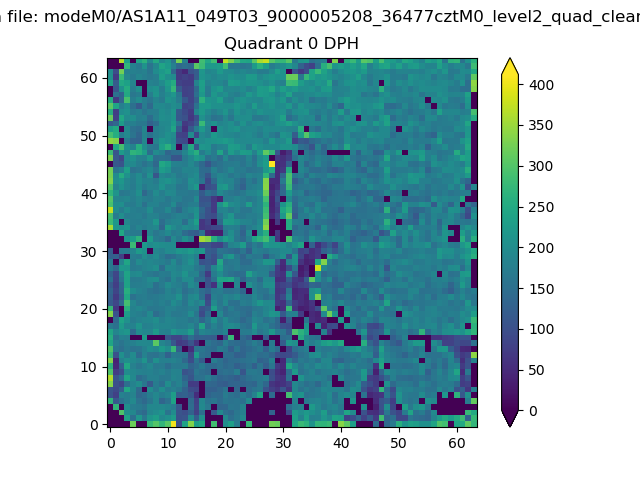 |
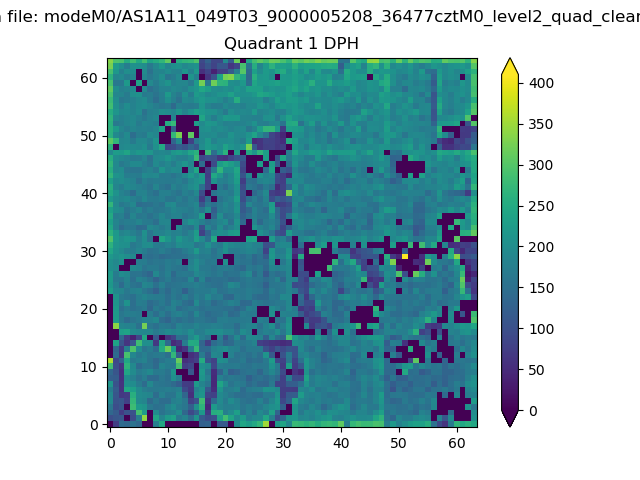 |
Quadrant B |
|---|---|---|---|
| Quadrant D | 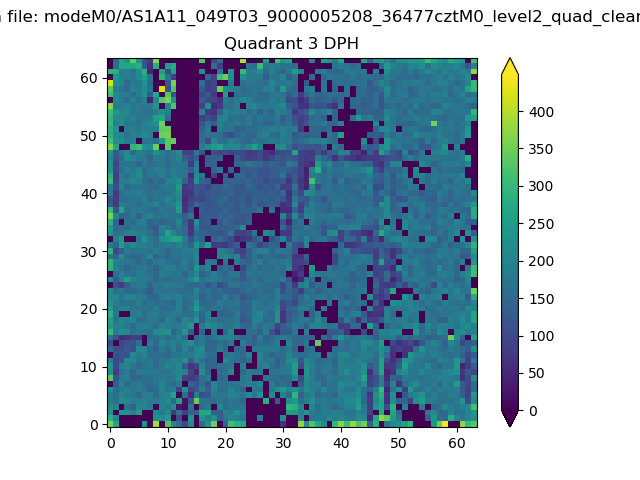 |
 |
Quadrant C |
| Plot type | Count rate plots | Images |
|---|---|---|
| Comparison with Poisson distribution Blue bars denote a histogram of data divided into 1 sec bins. Red curve is a Poisson curve with rate = median count rate of data. |
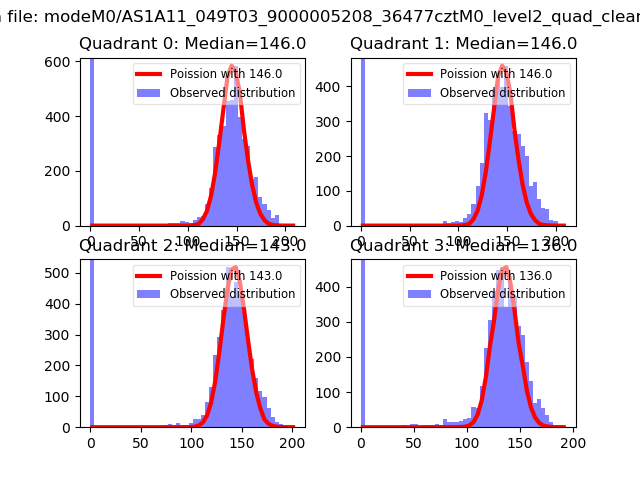 |
 |
| Quadrant-wise count rates Data is divided into 100 sec bins |
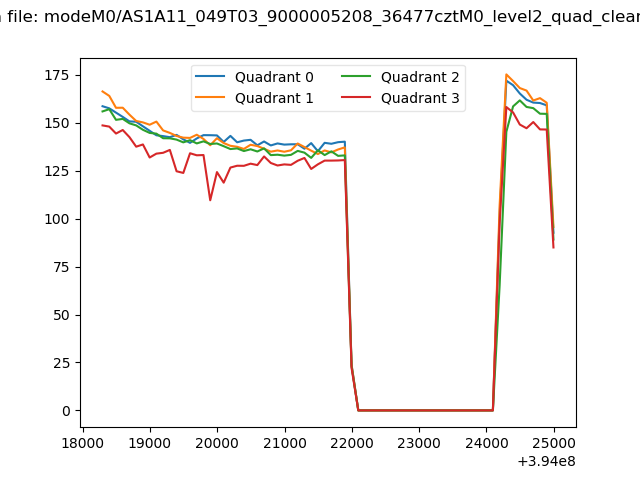 |
|
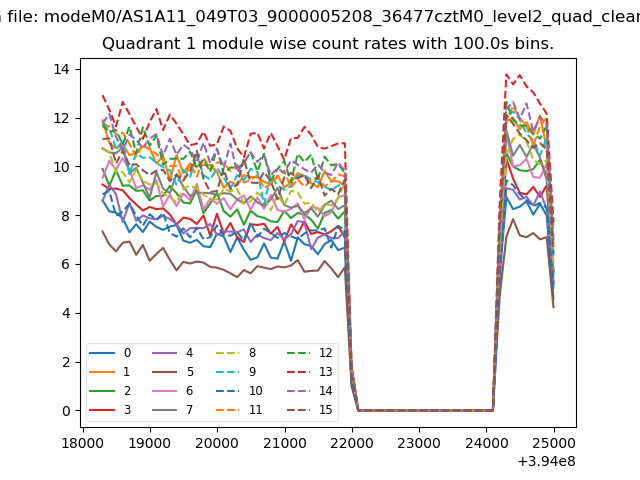
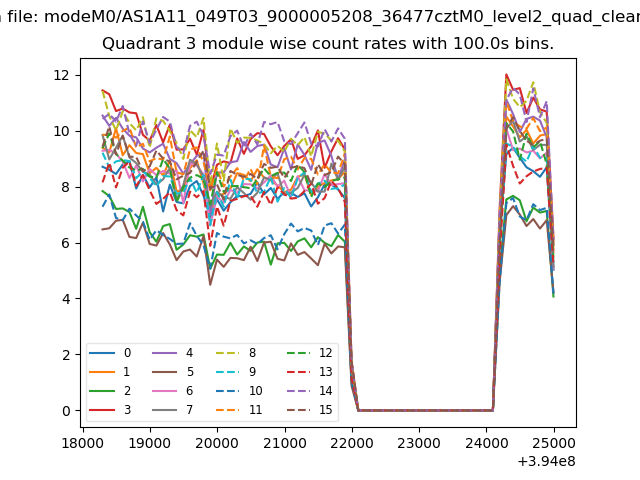
| Module-wise count rates for Quadrant A Data is divided into 100 sec bins |
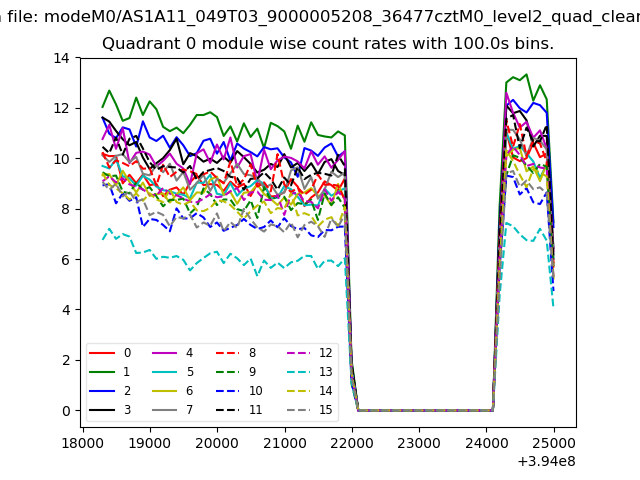 |
 |
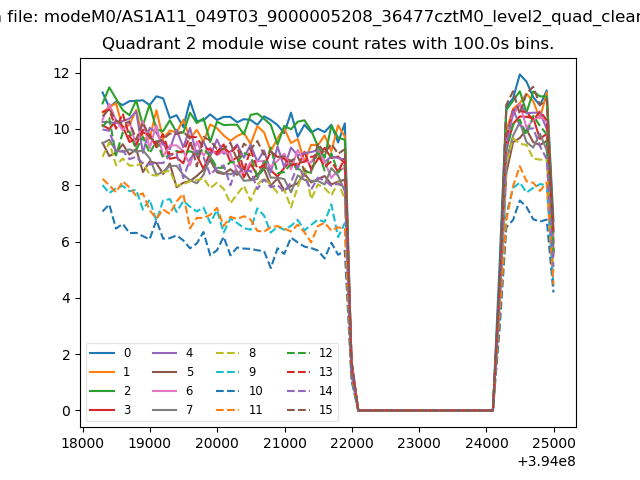
| Module-wise count rates for Quadrant B Data is divided into 100 sec bins |
 |
 |
| Module-wise count rates for Quadrant C Data is divided into 100 sec bins |
 |
 |
| Module-wise count rates for Quadrant D Data is divided into 100 sec bins |
 |
 |
| Parameter | Plot |
|---|---|
| CZT HV Monitor | 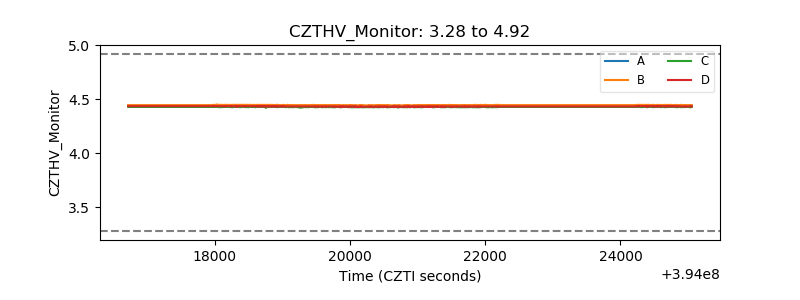 |
| D_VDD | 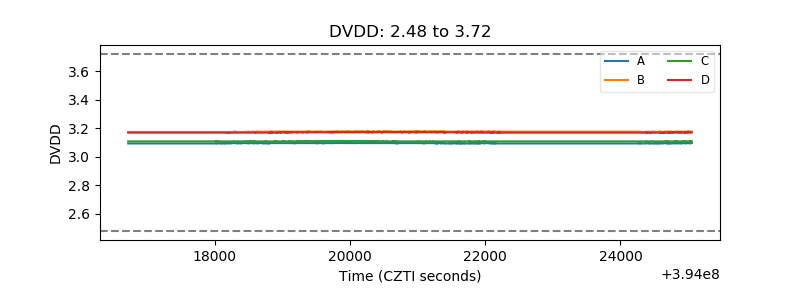 |
| Temperature 1 | 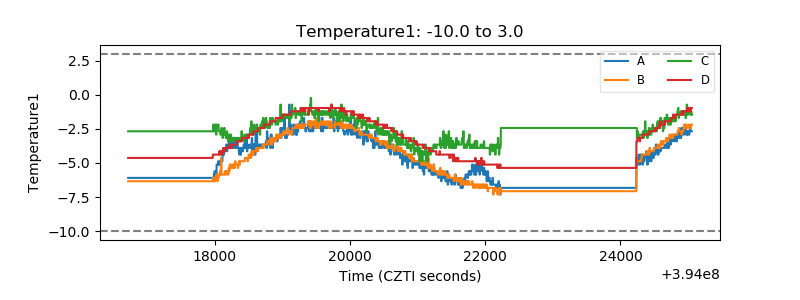 |
| Veto HV Monitor | 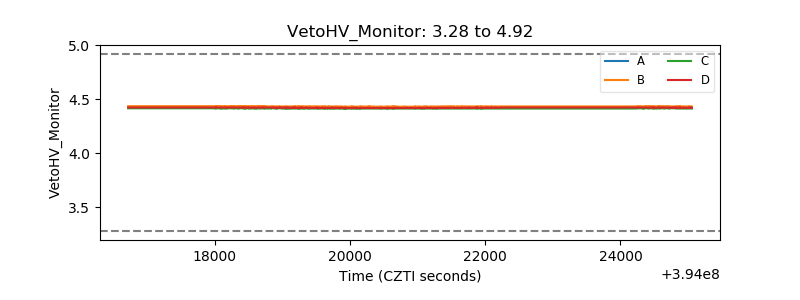 |
| Veto LLD | 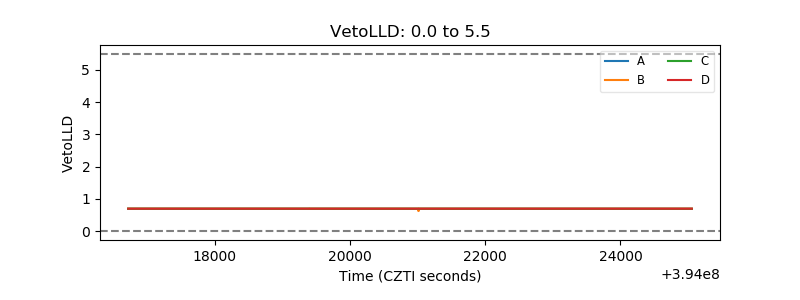 |
| Alpha Counter | 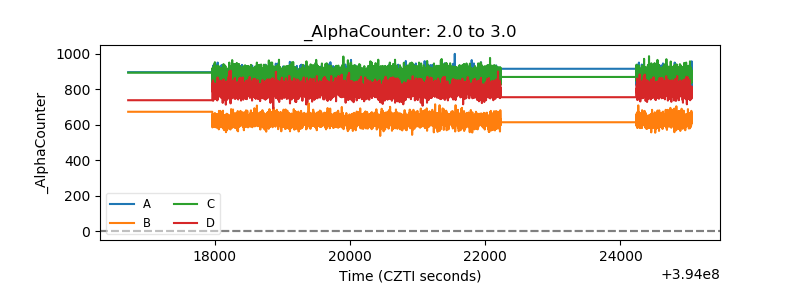 |
| _CPM_Rate | 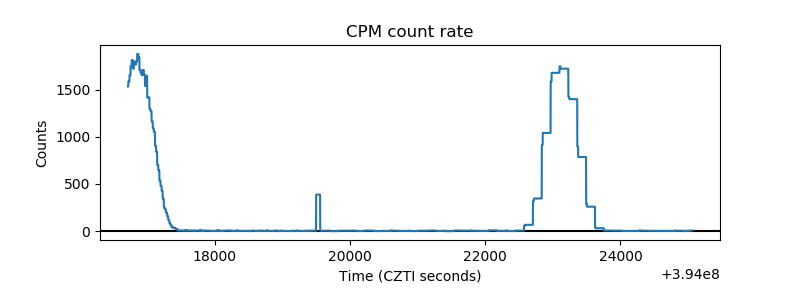 |
| CZT Counter | 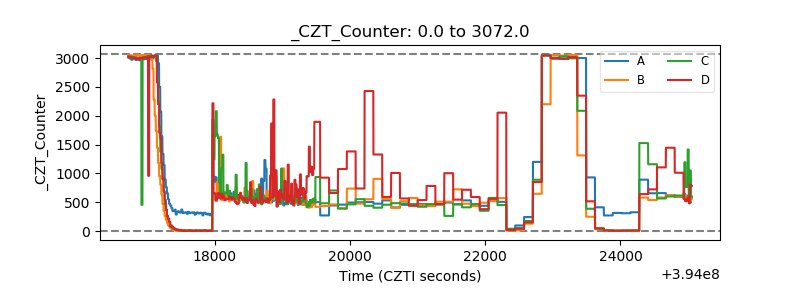 |
| +2.5 Volts monitor | 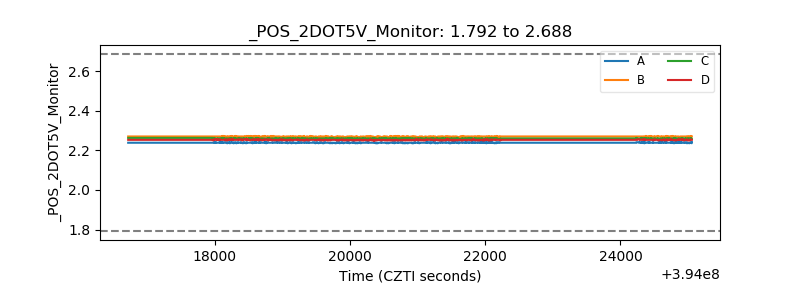 |
| +5 Volts monitor | 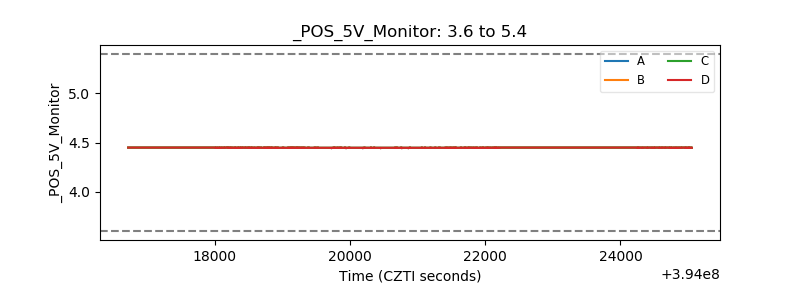 |
| _ROLL_ROT | 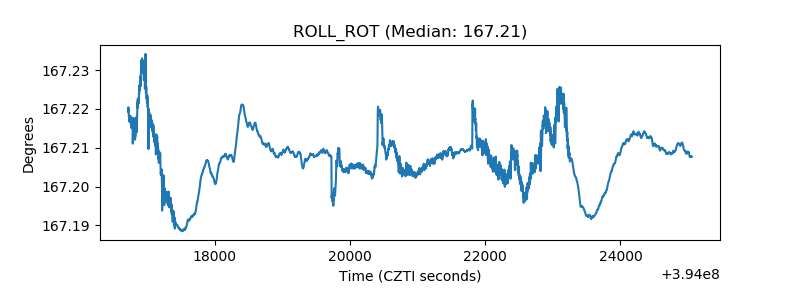 |
| _Roll_DEC | 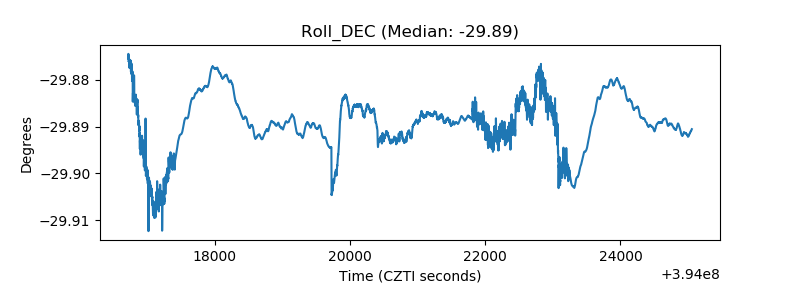 |
| _Roll_RA | 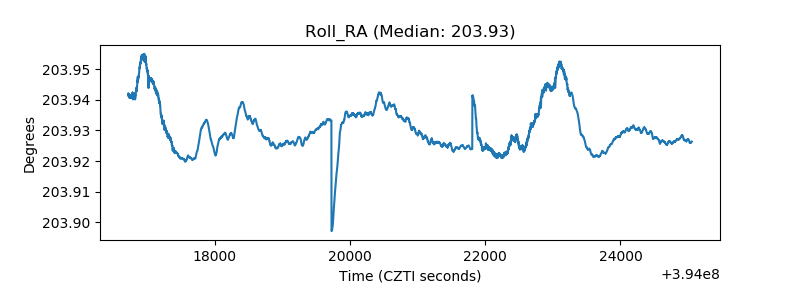 |
| Veto Counter | 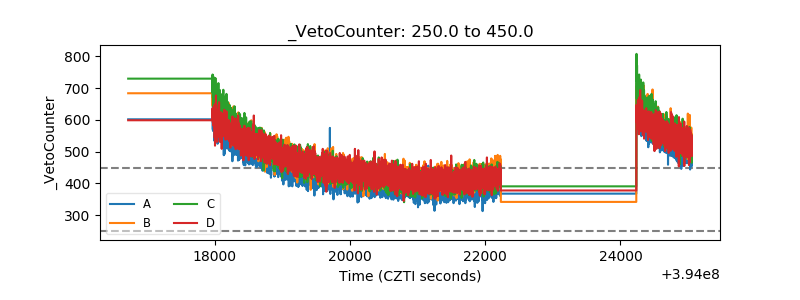 |