| Param | Original file | Final file |
|---|---|---|
| Filename | modeM0/AS1A11_049T03_9000005208cztM0_level2_bc.evt | modeM0/AS1A11_049T03_9000005208cztM0_level2_quad_clean.evt |
| Size (bytes) | 1,309,962,240 | 408,551,040 |
| Size | 1.2 GB | 389.6 MB |
| Events in quadrant A | 6,785,313 | 2,739,336 |
| Events in quadrant B | 8,474,687 | 2,673,076 |
| Events in quadrant C | 12,141,670 | 2,575,360 |
| Events in quadrant D | 10,407,531 | 2,507,174 |
| Mode M9 | |||
|---|---|---|---|
| Quadrant | BADHDUFLAG | Total packets | Discarded packets |
| A | 0 | 135 | 0 |
| B | 0 | 135 | 0 |
| C | 0 | 135 | 0 |
| D | 0 | 135 | 0 |
| Mode M0 | |||
|---|---|---|---|
| Quadrant | BADHDUFLAG | Total packets | Discarded packets |
| A | 0 | 57617 | 0 |
| B | 0 | 65136 | 0 |
| C | 0 | 74931 | 0 |
| D | 0 | 73610 | 0 |
| Mode SS | |||
|---|---|---|---|
| Quadrant | BADHDUFLAG | Total packets | Discarded packets |
| A | 0 | 562 | 0 |
| B | 0 | 562 | 0 |
| C | 0 | 562 | 0 |
| D | 0 | 562 | 0 |
| Quadrant | Total seconds | Saturated seconds | Saturation percentage |
|---|---|---|---|
| A | 27332 | 44 | 0.160983% |
| B | 27332 | 481 | 1.759842% |
| C | 27332 | 1105 | 4.042880% |
| D | 27332 | 1206 | 4.412410% |
Noise dominated data is calculated using 1-second bins in cleaned event files. If a bin has >2000 counts, and if more than 50% of those come from <1% of pixels, then it is considered to be noise-dominated and hence unusable.
| Quadrant | # 1 sec bins | Bins with >0 counts | Bins with >2000 counts | High rate bins dominated by noise | Noise dominated (total time) | Noise dominated (detector-on time) | Marked lightcurve |
|---|---|---|---|---|---|---|---|
| A | 40928 | 27339 | 1 | 1 | 0.00% | 0.00% | 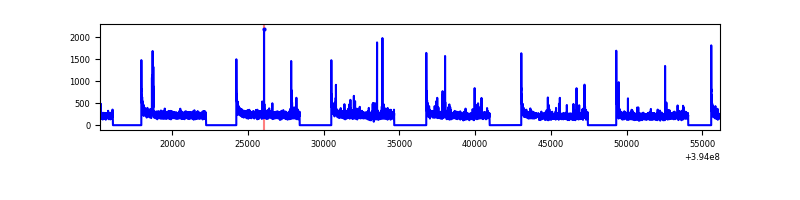 |
| B | 40928 | 27332 | 56 | 56 | 0.14% | 0.20% | 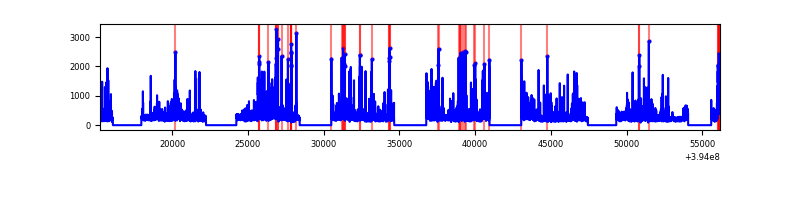 |
| C | 40928 | 27333 | 393 | 393 | 0.96% | 1.44% | 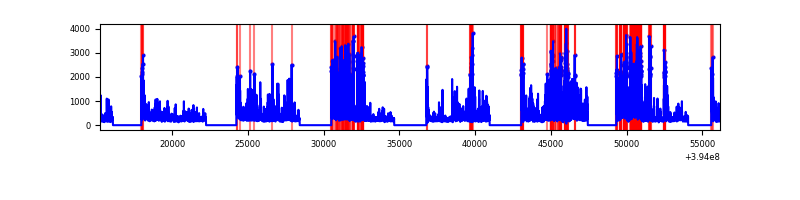 |
| D | 40928 | 27332 | 207 | 207 | 0.51% | 0.76% | 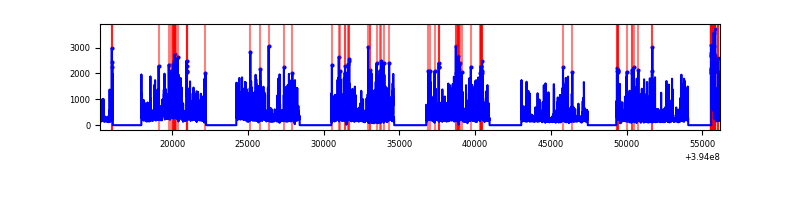 |
Top three noisy pixels from each quadrant. If the there are fewer than three noisy pixels in the level2.evt file, extra rows are filled as -1
| Pixel properties | Quadrant properties | ||||||
|---|---|---|---|---|---|---|---|
| Quadrant | DetID | PixID | Counts | Sigma | Mean | Median | Sigma |
| A | 10 | 83 | 826273 | 2494.37 | 1496 | 1480 | 330.7 |
| A | 9 | 143 | 67938 | 200.98 | 1496 | 1480 | 330.7 |
| A | 13 | 254 | 46471 | 136.06 | 1496 | 1480 | 330.7 |
| B | 5 | 172 | 1296437 | 4435.25 | 1466 | 1440 | 292.0 |
| B | 5 | 255 | 658618 | 2250.78 | 1466 | 1440 | 292.0 |
| B | 0 | 189 | 235210 | 800.64 | 1466 | 1440 | 292.0 |
| C | 4 | 254 | 2469952 | 7745.09 | 1395 | 1387 | 318.7 |
| C | 0 | 10 | 2224907 | 6976.26 | 1395 | 1387 | 318.7 |
| C | 15 | 214 | 1101764 | 3452.42 | 1395 | 1387 | 318.7 |
| D | 13 | 249 | 1841926 | 5449.65 | 1431 | 1394 | 337.7 |
| D | 12 | 235 | 662440 | 1957.3 | 1431 | 1394 | 337.7 |
| D | 12 | 227 | 430791 | 1271.41 | 1431 | 1394 | 337.7 |
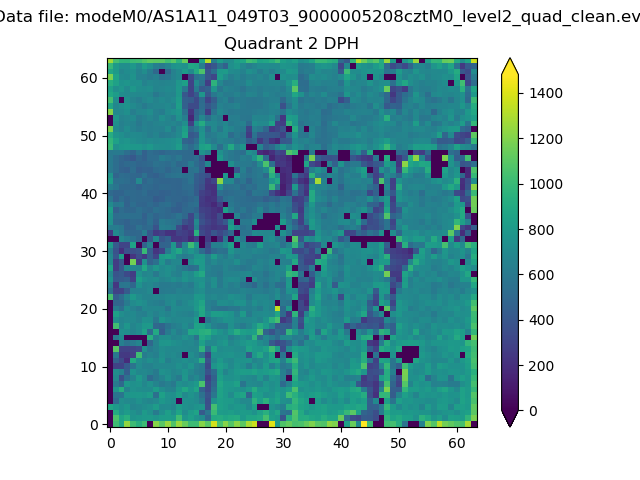
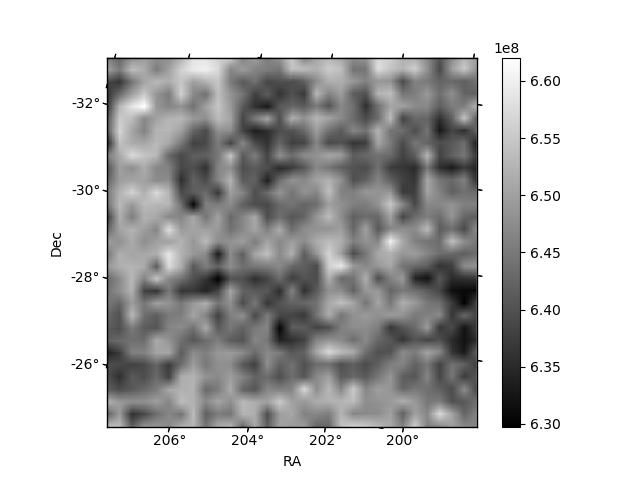
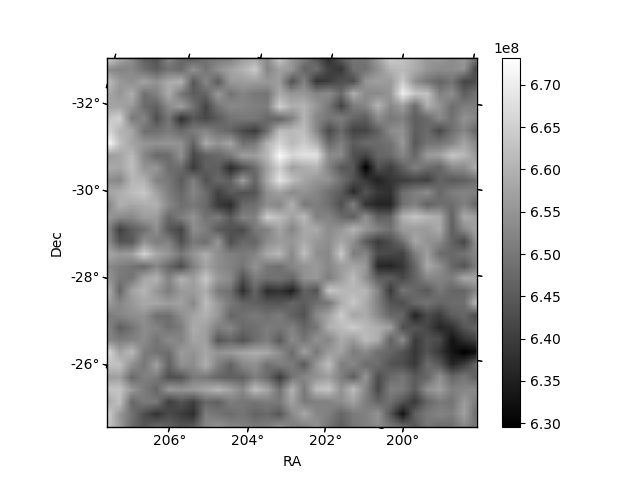
Histogram calculated using DETX and DETY for each event in the final _common_clean file
| Quadrant A | 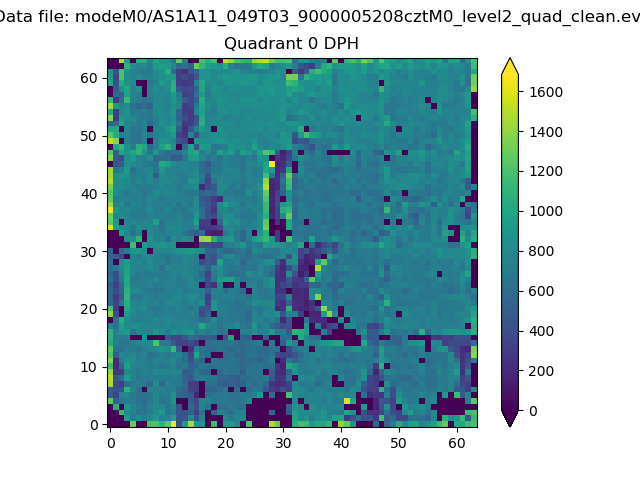 |
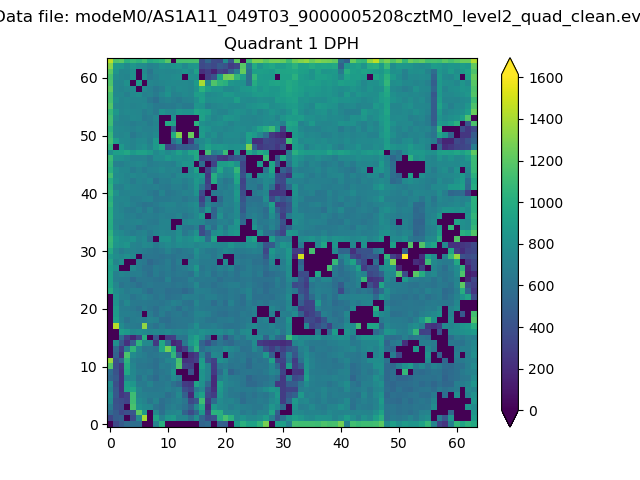 |
Quadrant B |
|---|---|---|---|
| Quadrant D | 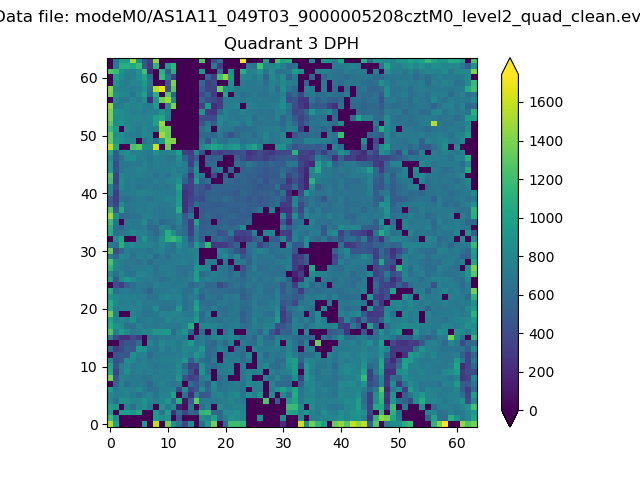 |
 |
Quadrant C |
| Plot type | Count rate plots | Images |
|---|---|---|
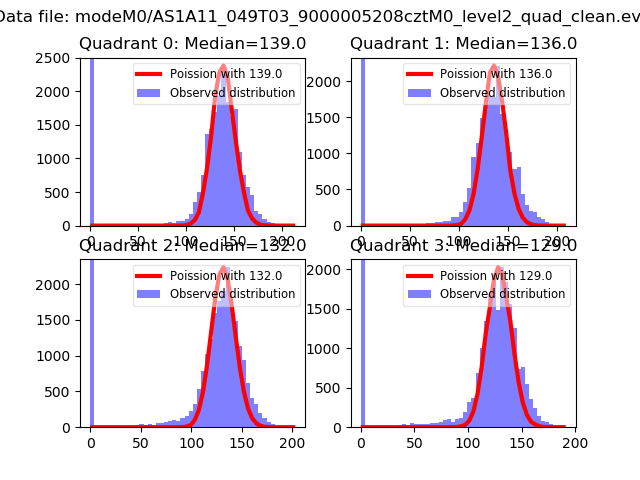
| Comparison with Poisson distribution Blue bars denote a histogram of data divided into 1 sec bins. Red curve is a Poisson curve with rate = median count rate of data. |
 |
 |
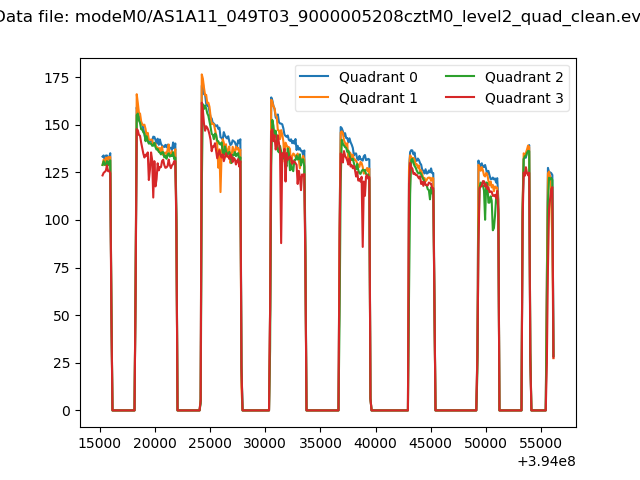
| Quadrant-wise count rates Data is divided into 100 sec bins |
 |
|
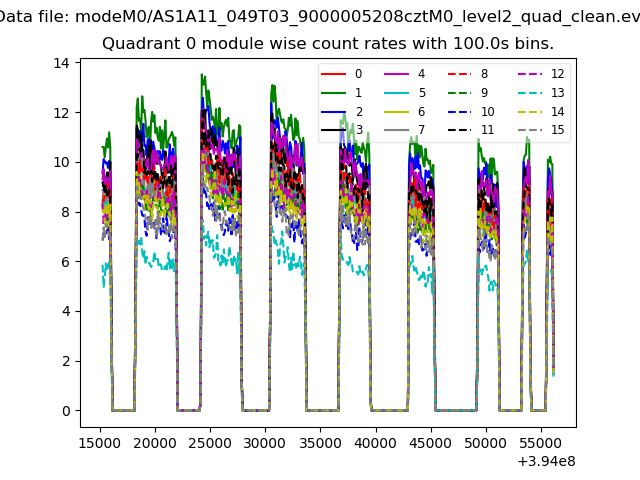
| Module-wise count rates for Quadrant A Data is divided into 100 sec bins |
 |
 |
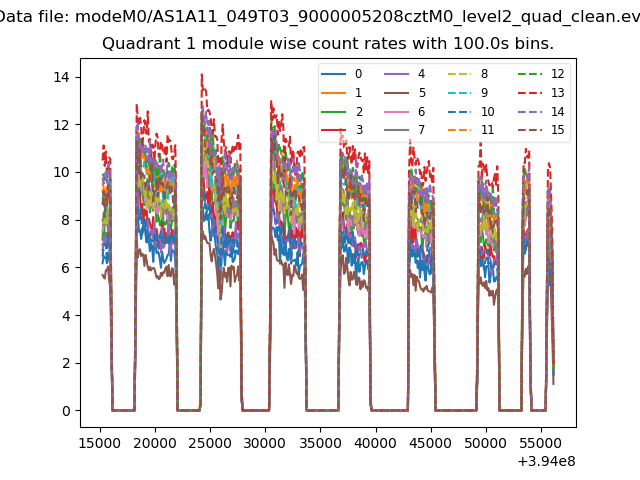
| Module-wise count rates for Quadrant B Data is divided into 100 sec bins |
 |
 |
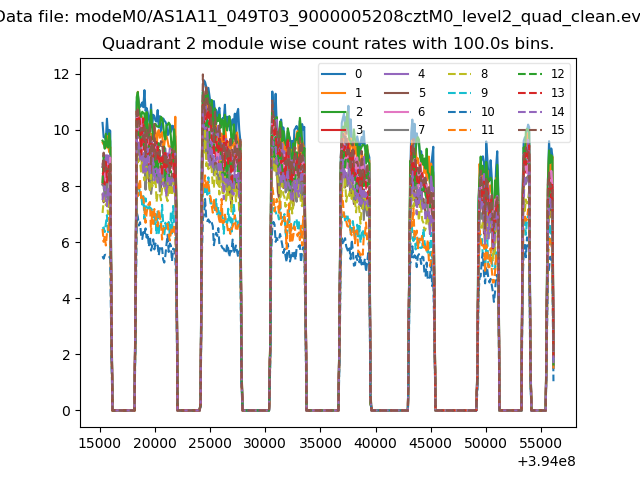
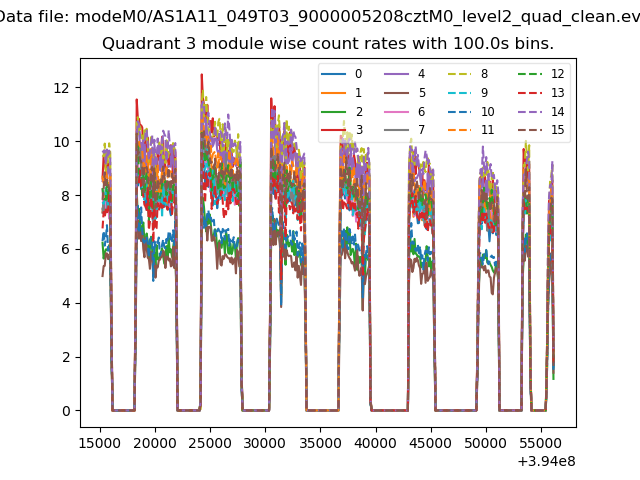
| Module-wise count rates for Quadrant C Data is divided into 100 sec bins |
 |
 |
| Module-wise count rates for Quadrant D Data is divided into 100 sec bins |
 |
 |
| Parameter | Plot |
|---|---|
| CZT HV Monitor | 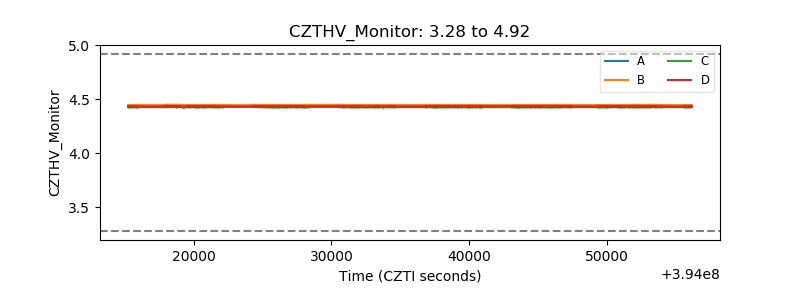 |
| D_VDD |  |
| Temperature 1 | 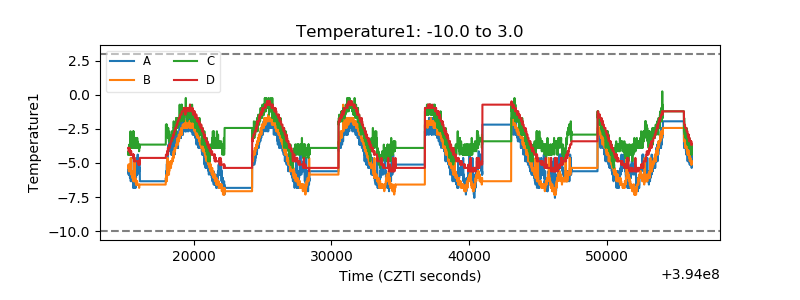 |
| Veto HV Monitor | 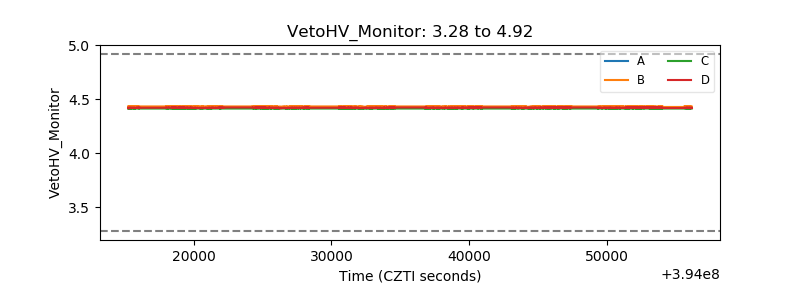 |
| Veto LLD | 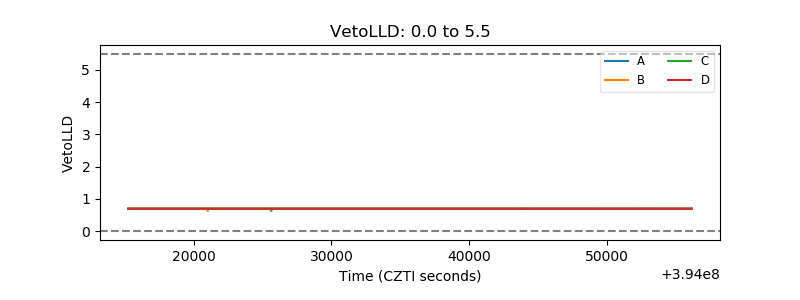 |
| Alpha Counter | 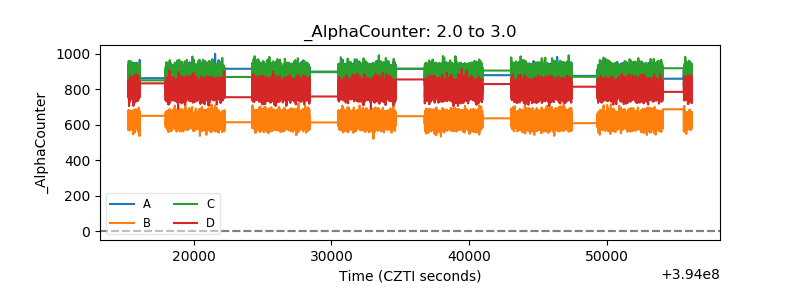 |
| _CPM_Rate | 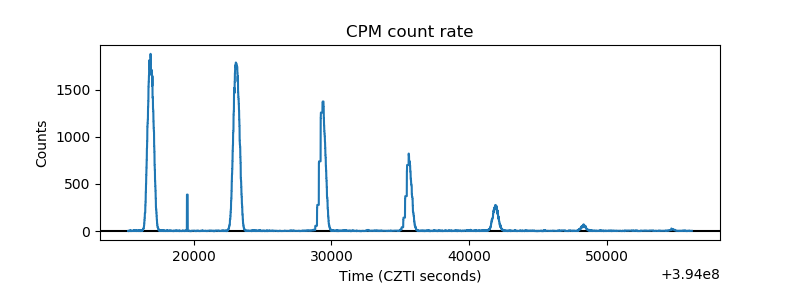 |
| CZT Counter | 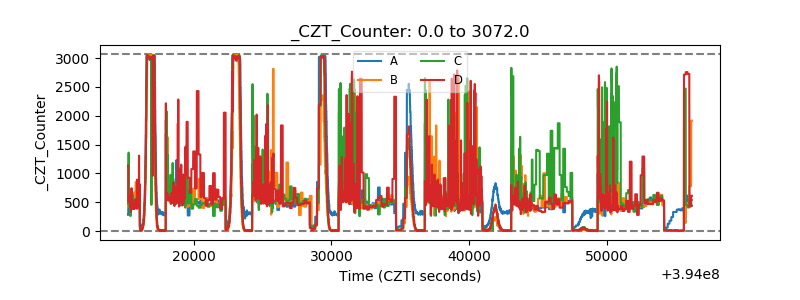 |
| +2.5 Volts monitor | 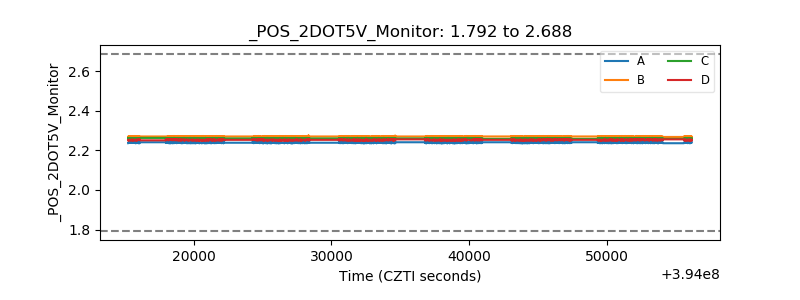 |
| +5 Volts monitor | 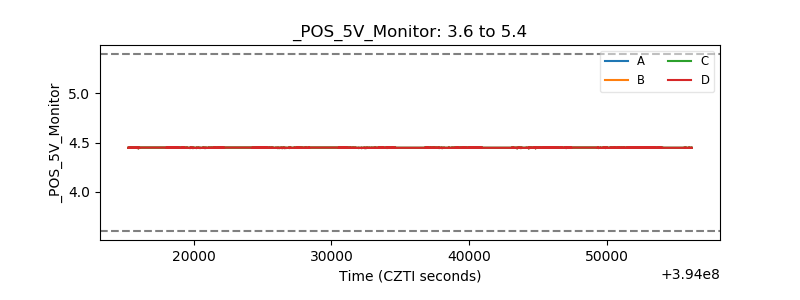 |
| _ROLL_ROT | 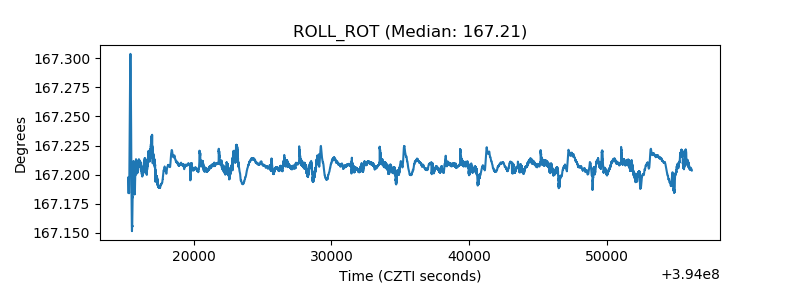 |
| _Roll_DEC | 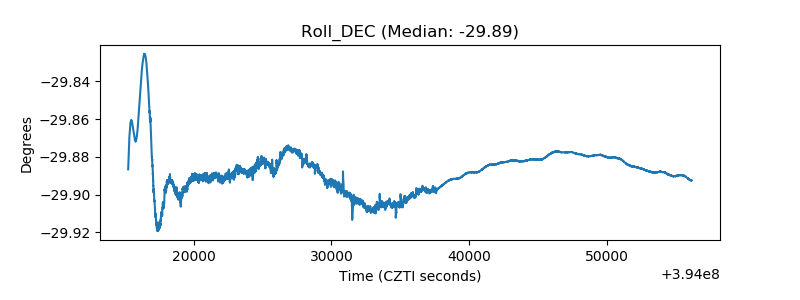 |
| _Roll_RA | 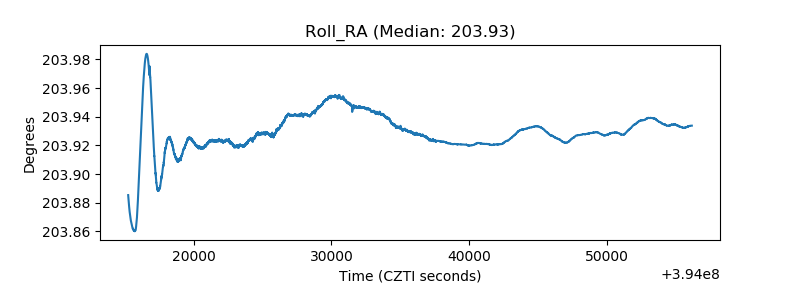 |
| Veto Counter | 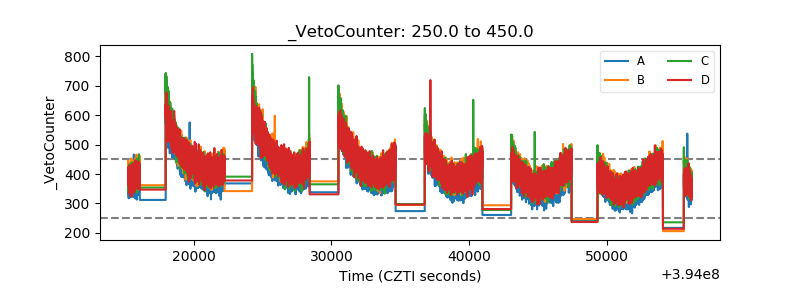 |