| Param | Original file | Final file |
|---|---|---|
| Filename | modeM0/AS1A11_049T02_9000005206_36476cztM0_level2.evt | modeM0/AS1A11_049T02_9000005206_36476cztM0_level2_quad_clean.evt |
| Size (bytes) | 242,582,400 | 50,290,560 |
| Size | 231.3 MB | 48.0 MB |
| Events in quadrant A | 1,636,548 | 329,041 |
| Events in quadrant B | 1,696,673 | 332,572 |
| Events in quadrant C | 1,819,124 | 324,402 |
| Events in quadrant D | 1,973,755 | 307,697 |
| Mode M0 | |||
|---|---|---|---|
| Quadrant | BADHDUFLAG | Total packets | Discarded packets |
| A | 0 | 6749 | 1 |
| B | 0 | 6909 | 1 |
| C | 0 | 7303 | 1 |
| D | 0 | 7883 | 1 |
| Mode SS | |||
|---|---|---|---|
| Quadrant | BADHDUFLAG | Total packets | Discarded packets |
| A | 0 | 64 | 0 |
| B | 0 | 64 | 0 |
| C | 0 | 64 | 0 |
| D | 0 | 64 | 0 |
| Mode M9 | |||
|---|---|---|---|
| Quadrant | BADHDUFLAG | Total packets | Discarded packets |
| A | 0 | 10 | 0 |
| B | 0 | 10 | 0 |
| C | 0 | 10 | 0 |
| D | 0 | 11 | 0 |
| Quadrant | Total seconds | Saturated seconds | Saturation percentage |
|---|---|---|---|
| A | 3222 | 3 | 0.093110% |
| B | 3222 | 20 | 0.620732% |
| C | 3222 | 35 | 1.086282% |
| D | 3222 | 95 | 2.948479% |
Noise dominated data is calculated using 1-second bins in cleaned event files. If a bin has >2000 counts, and if more than 50% of those come from <1% of pixels, then it is considered to be noise-dominated and hence unusable.
| Quadrant | # 1 sec bins | Bins with >0 counts | Bins with >2000 counts | High rate bins dominated by noise | Noise dominated (total time) | Noise dominated (detector-on time) | Marked lightcurve |
|---|---|---|---|---|---|---|---|
| A | 3222 | 3222 | 0 | 0 | 0.00% | 0.00% | 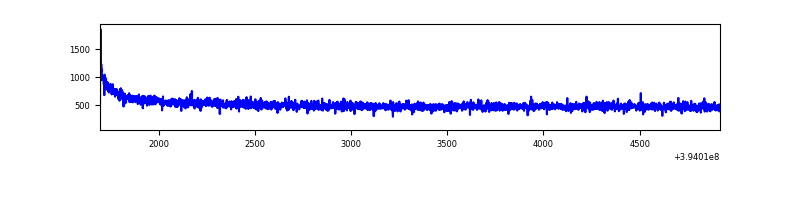 |
| B | 3222 | 3222 | 11 | 11 | 0.34% | 0.34% | 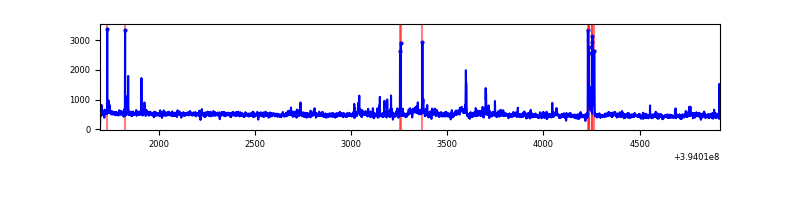 |
| C | 3222 | 3222 | 21 | 21 | 0.65% | 0.65% | 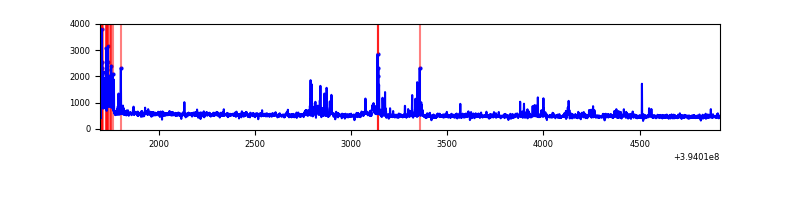 |
| D | 3222 | 3222 | 70 | 70 | 2.17% | 2.17% | 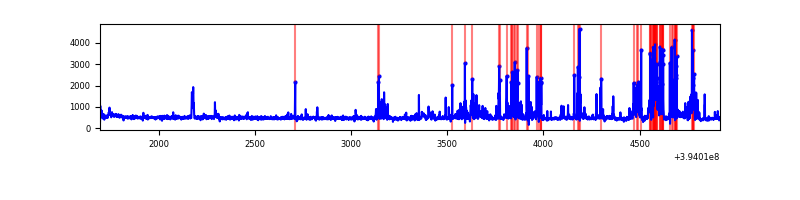 |
Top three noisy pixels from each quadrant. If the there are fewer than three noisy pixels in the level2.evt file, extra rows are filled as -1
| Pixel properties | Quadrant properties | ||||||
|---|---|---|---|---|---|---|---|
| Quadrant | DetID | PixID | Counts | Sigma | Mean | Median | Sigma |
| A | 10 | 83 | 106675 | 1316.71 | 395 | 388 | 80.7 |
| A | 13 | 254 | 5541 | 63.84 | 395 | 388 | 80.7 |
| A | 3 | 137 | 3882 | 43.28 | 395 | 388 | 80.7 |
| B | 5 | 255 | 47369 | 627.96 | 386 | 376 | 74.8 |
| B | 15 | 85 | 43764 | 579.79 | 386 | 376 | 74.8 |
| B | 0 | 189 | 38349 | 507.43 | 386 | 376 | 74.8 |
| C | 0 | 10 | 192411 | 2191.88 | 377 | 379 | 87.6 |
| C | 15 | 214 | 138648 | 1578.22 | 377 | 379 | 87.6 |
| C | 6 | 255 | 10135 | 111.35 | 377 | 379 | 87.6 |
| D | 13 | 249 | 360455 | 3874.83 | 379 | 369 | 92.9 |
| D | 2 | 153 | 43315 | 462.13 | 379 | 369 | 92.9 |
| D | 10 | 199 | 40442 | 431.22 | 379 | 369 | 92.9 |
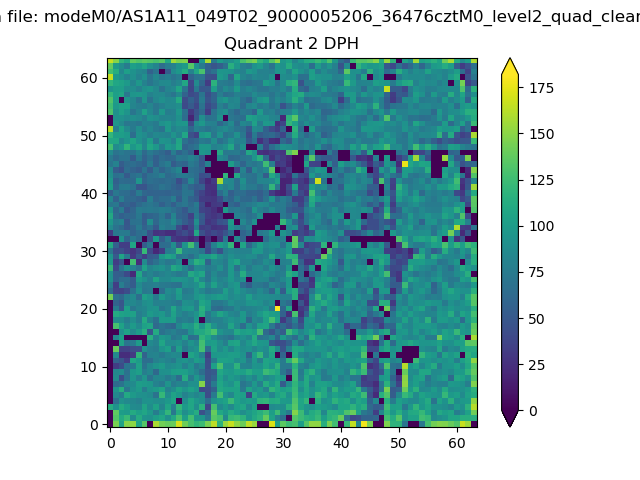
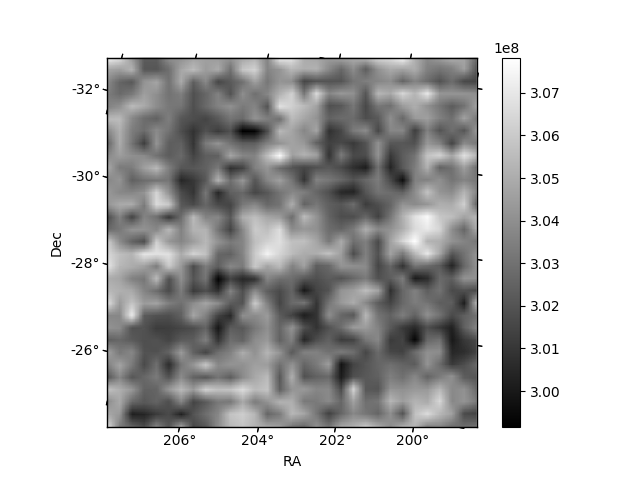
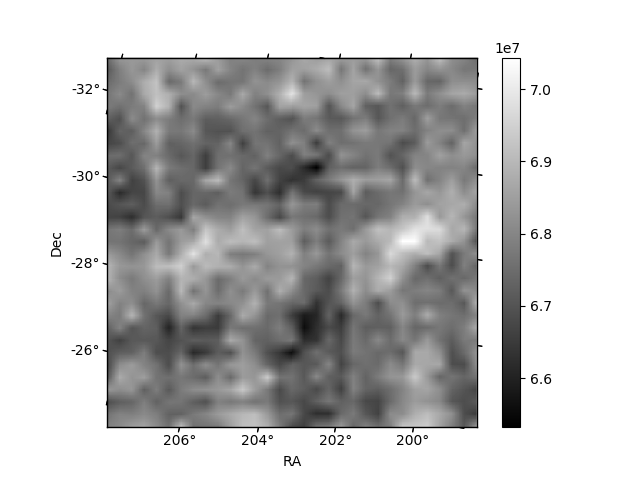
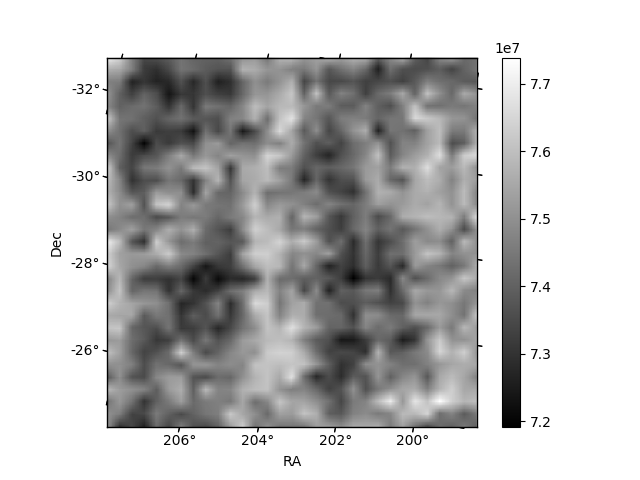
Histogram calculated using DETX and DETY for each event in the final _common_clean file
| Quadrant A | 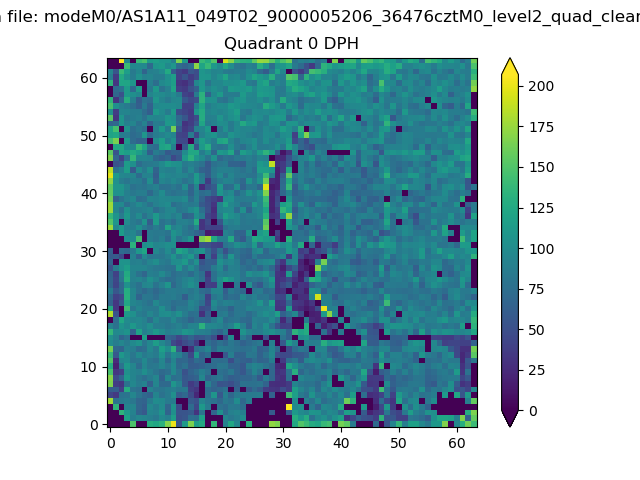 |
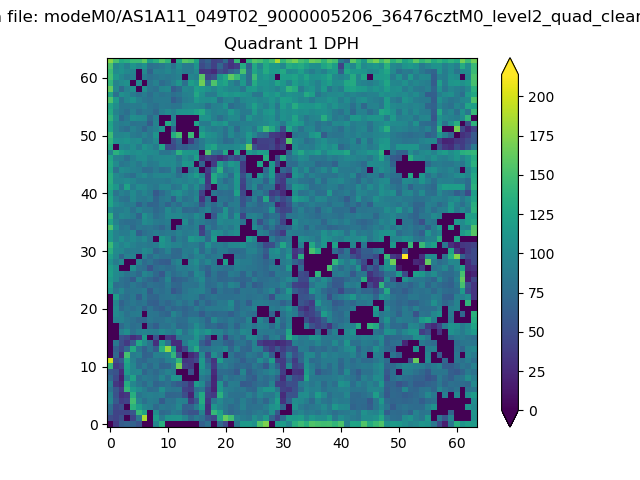 |
Quadrant B |
|---|---|---|---|
| Quadrant D | 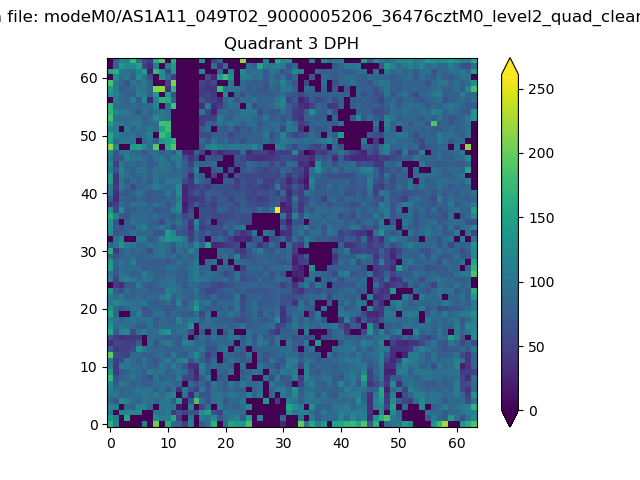 |
 |
Quadrant C |
| Plot type | Count rate plots | Images |
|---|---|---|
| Comparison with Poisson distribution Blue bars denote a histogram of data divided into 1 sec bins. Red curve is a Poisson curve with rate = median count rate of data. |
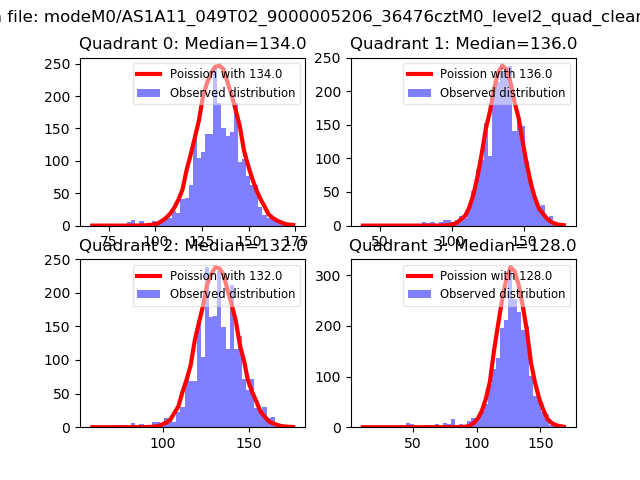 |
 |
| Quadrant-wise count rates Data is divided into 100 sec bins |
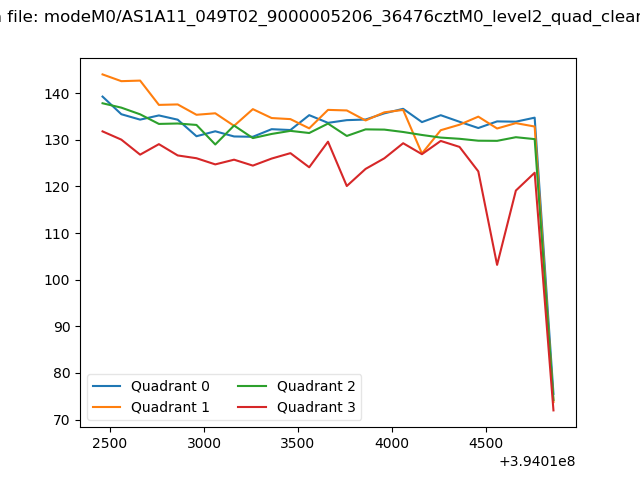 |
|
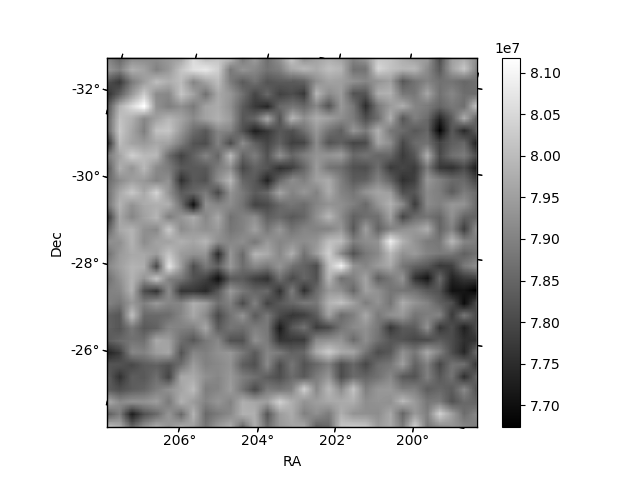
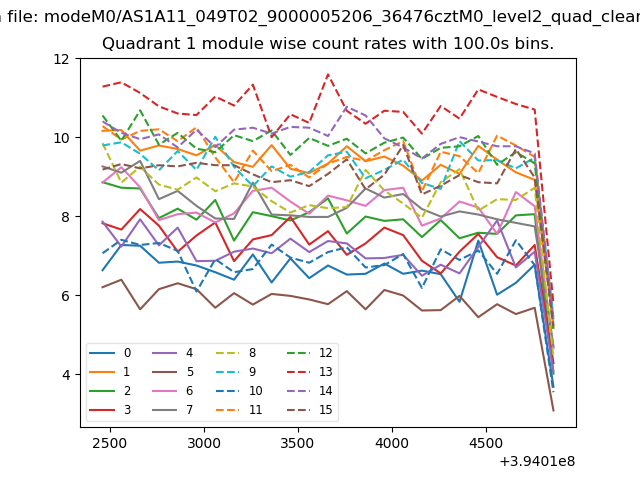
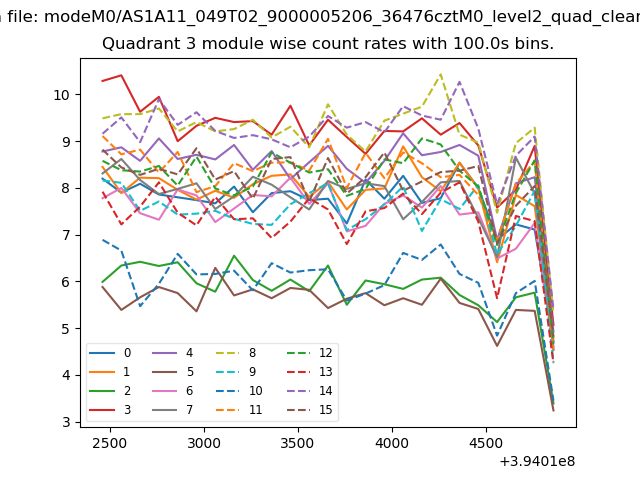
| Module-wise count rates for Quadrant A Data is divided into 100 sec bins |
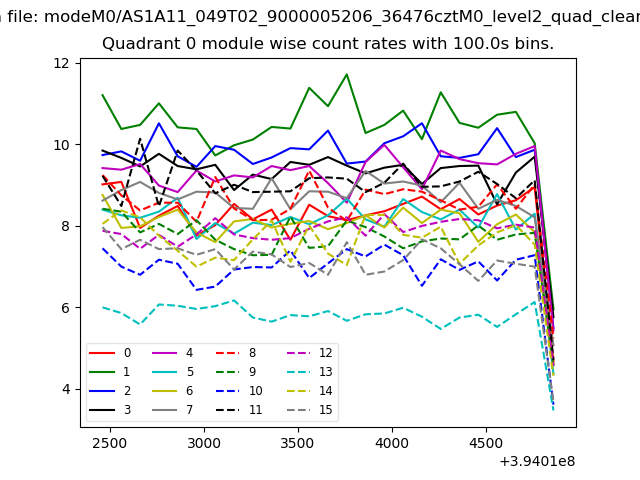 |
 |
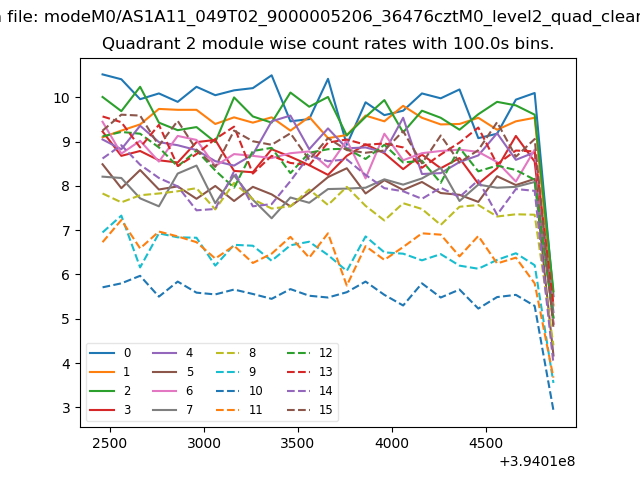
| Module-wise count rates for Quadrant B Data is divided into 100 sec bins |
 |
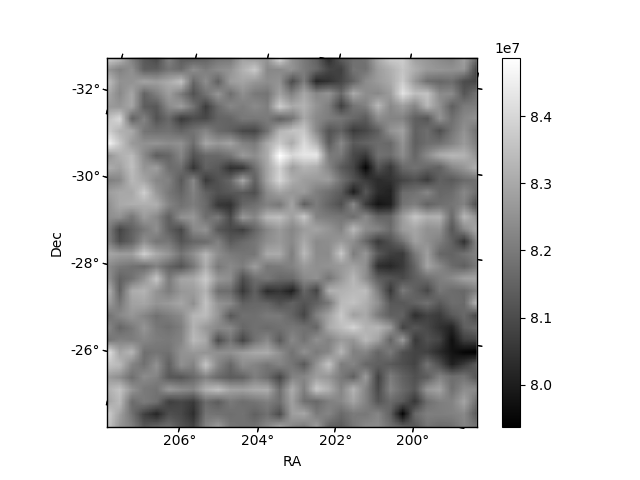 |
| Module-wise count rates for Quadrant C Data is divided into 100 sec bins |
 |
 |
| Module-wise count rates for Quadrant D Data is divided into 100 sec bins |
 |
 |
| Parameter | Plot |
|---|---|
| CZT HV Monitor | 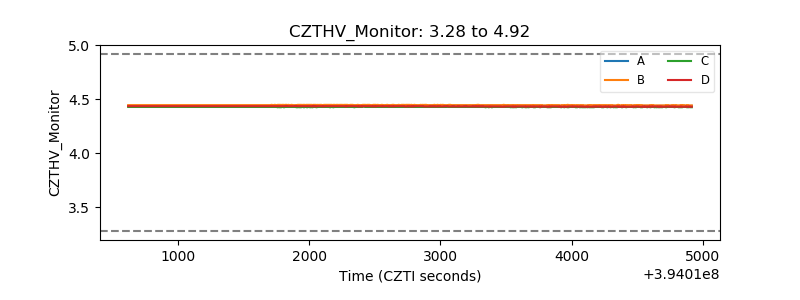 |
| D_VDD | 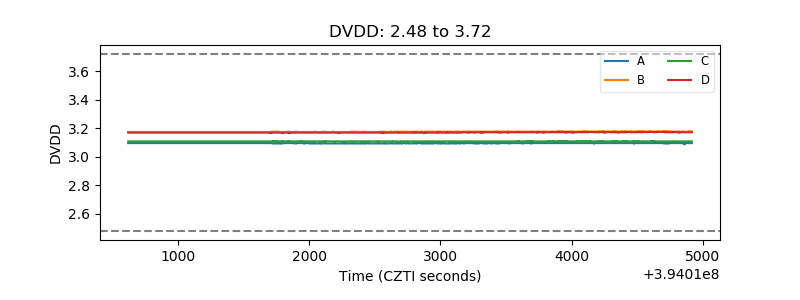 |
| Temperature 1 | 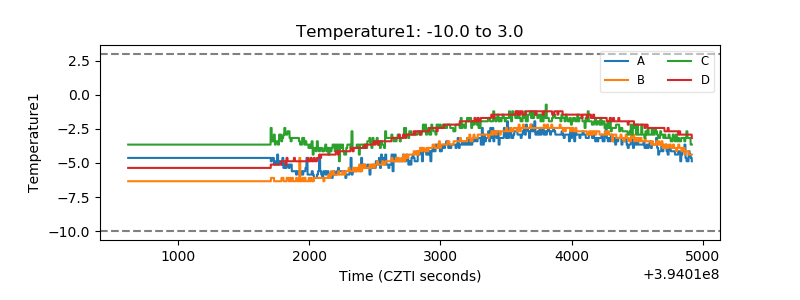 |
| Veto HV Monitor | 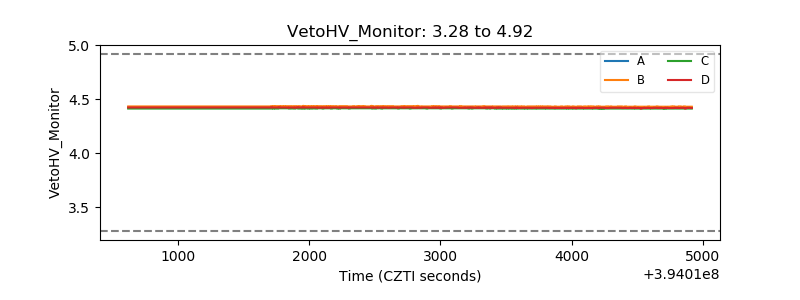 |
| Veto LLD | 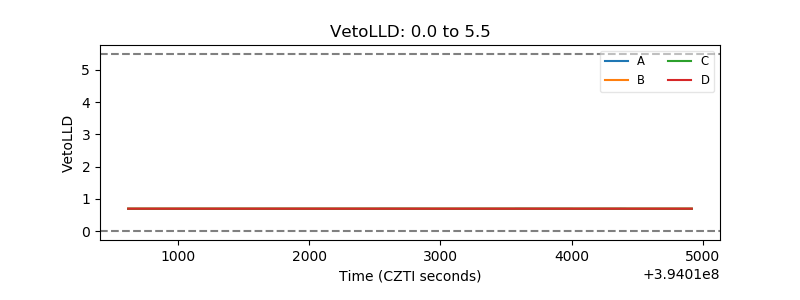 |
| Alpha Counter | 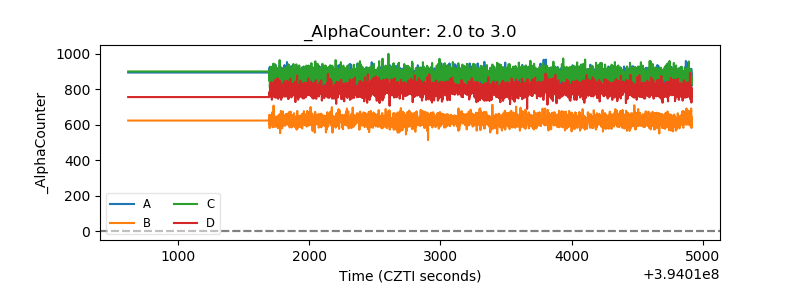 |
| _CPM_Rate | 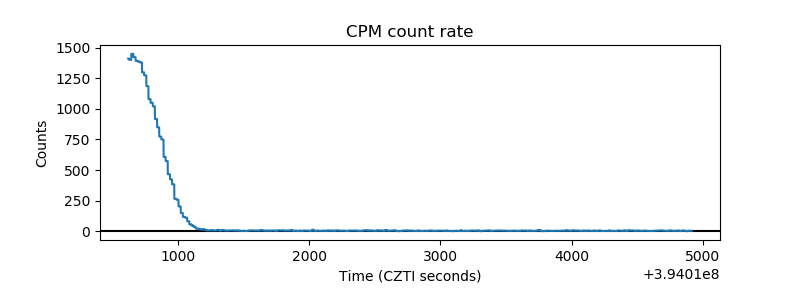 |
| CZT Counter | 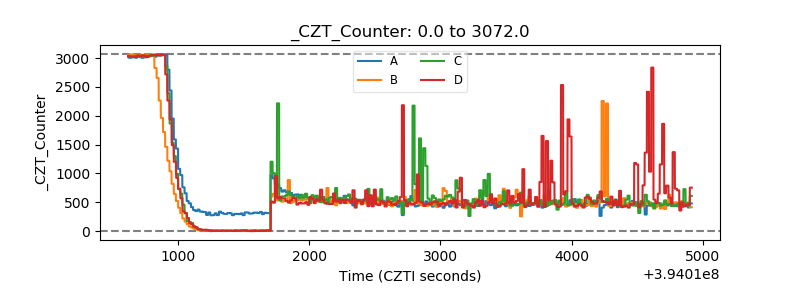 |
| +2.5 Volts monitor | 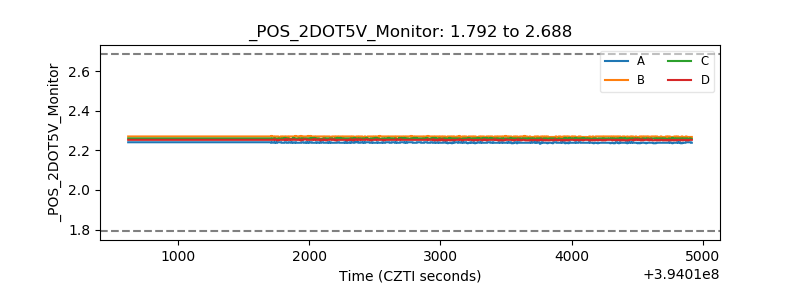 |
| +5 Volts monitor | 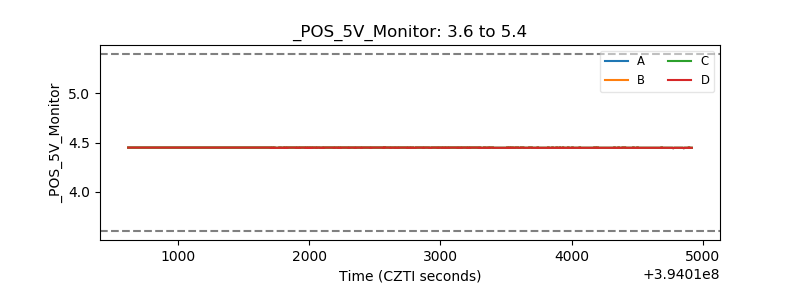 |
| _ROLL_ROT | 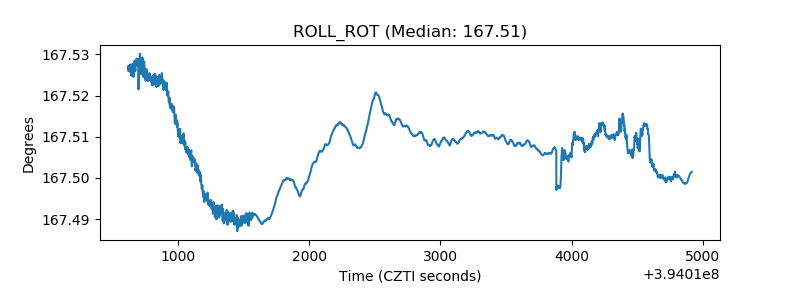 |
| _Roll_DEC | 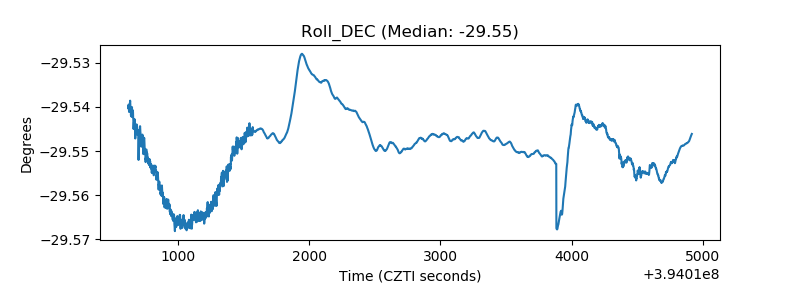 |
| _Roll_RA | 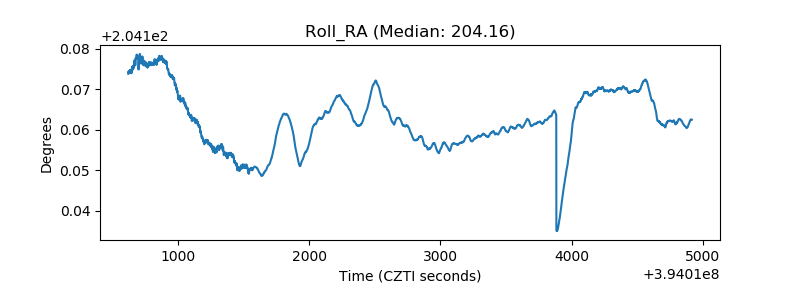 |
| Veto Counter | 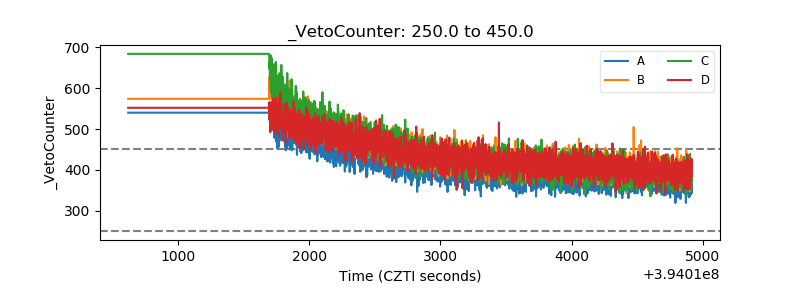 |