| Param | Original file | Final file |
|---|---|---|
| Filename | modeM0/AS1A11_049T02_9000005206_36475cztM0_level2.evt | modeM0/AS1A11_049T02_9000005206_36475cztM0_level2_quad_clean.evt |
| Size (bytes) | 387,881,280 | 69,998,400 |
| Size | 369.9 MB | 66.8 MB |
| Events in quadrant A | 2,708,583 | 443,320 |
| Events in quadrant B | 2,727,884 | 442,643 |
| Events in quadrant C | 2,928,933 | 435,666 |
| Events in quadrant D | 3,013,167 | 418,809 |
| Mode M0 | |||
|---|---|---|---|
| Quadrant | BADHDUFLAG | Total packets | Discarded packets |
| A | 0 | 11358 | 3 |
| B | 0 | 11391 | 2 |
| C | 0 | 11904 | 2 |
| D | 0 | 12516 | 2 |
| Mode SS | |||
|---|---|---|---|
| Quadrant | BADHDUFLAG | Total packets | Discarded packets |
| A | 0 | 110 | 0 |
| B | 0 | 110 | 0 |
| C | 0 | 110 | 0 |
| D | 0 | 110 | 0 |
| Mode M9 | |||
|---|---|---|---|
| Quadrant | BADHDUFLAG | Total packets | Discarded packets |
| A | 0 | 27 | 0 |
| B | 0 | 27 | 0 |
| C | 0 | 27 | 0 |
| D | 0 | 28 | 0 |
| Quadrant | Total seconds | Saturated seconds | Saturation percentage |
|---|---|---|---|
| A | 5417 | 4 | 0.073842% |
| B | 5417 | 27 | 0.498431% |
| C | 5417 | 66 | 1.218387% |
| D | 5417 | 74 | 1.366070% |
Noise dominated data is calculated using 1-second bins in cleaned event files. If a bin has >2000 counts, and if more than 50% of those come from <1% of pixels, then it is considered to be noise-dominated and hence unusable.
| Quadrant | # 1 sec bins | Bins with >0 counts | Bins with >2000 counts | High rate bins dominated by noise | Noise dominated (total time) | Noise dominated (detector-on time) | Marked lightcurve |
|---|---|---|---|---|---|---|---|
| A | 7181 | 5418 | 0 | 0 | 0.00% | 0.00% | 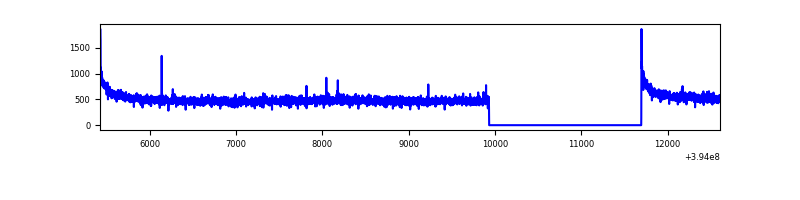 |
| B | 7181 | 5418 | 12 | 12 | 0.17% | 0.22% | 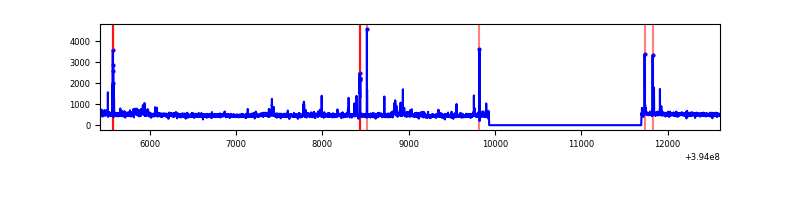 |
| C | 7181 | 5418 | 41 | 41 | 0.57% | 0.76% | 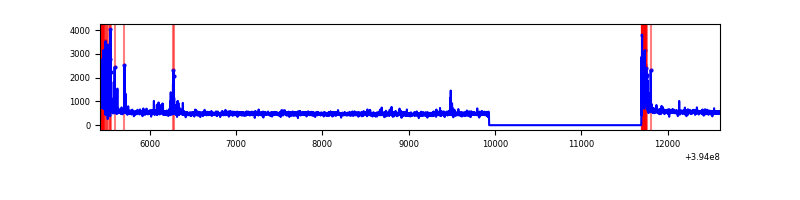 |
| D | 7181 | 5418 | 48 | 48 | 0.67% | 0.89% | 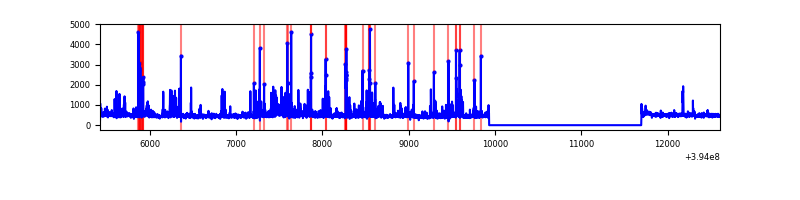 |
Top three noisy pixels from each quadrant. If the there are fewer than three noisy pixels in the level2.evt file, extra rows are filled as -1
| Pixel properties | Quadrant properties | ||||||
|---|---|---|---|---|---|---|---|
| Quadrant | DetID | PixID | Counts | Sigma | Mean | Median | Sigma |
| A | 10 | 83 | 198912 | 1532.17 | 644 | 632 | 129.4 |
| A | 13 | 6 | 11905 | 87.11 | 644 | 632 | 129.4 |
| A | 13 | 254 | 8920 | 64.04 | 644 | 632 | 129.4 |
| B | 5 | 255 | 60737 | 498.23 | 634 | 619 | 120.7 |
| B | 5 | 172 | 36943 | 301.04 | 634 | 619 | 120.7 |
| B | 0 | 190 | 29179 | 236.69 | 634 | 619 | 120.7 |
| C | 0 | 10 | 266563 | 1859.43 | 619 | 623 | 143.0 |
| C | 15 | 214 | 235173 | 1639.95 | 619 | 623 | 143.0 |
| C | 0 | 207 | 10146 | 66.58 | 619 | 623 | 143.0 |
| D | 13 | 249 | 221769 | 1473.5 | 621 | 604 | 150.1 |
| D | 10 | 199 | 93937 | 621.83 | 621 | 604 | 150.1 |
| D | 2 | 153 | 83092 | 549.57 | 621 | 604 | 150.1 |
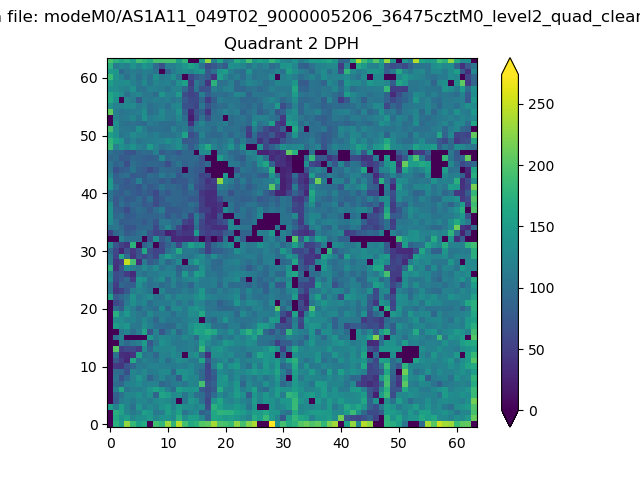
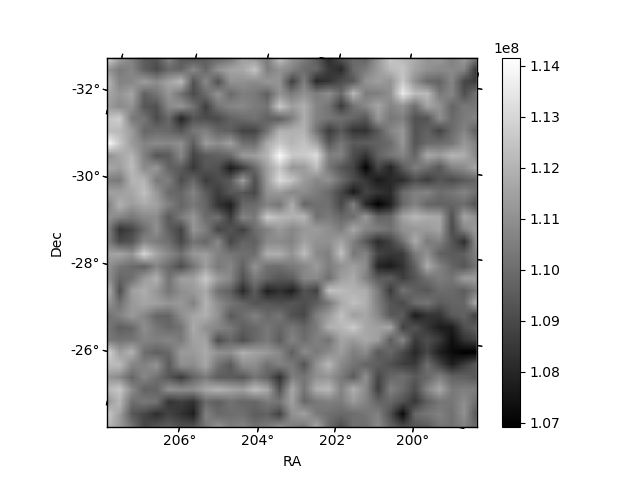
Histogram calculated using DETX and DETY for each event in the final _common_clean file
| Quadrant A | 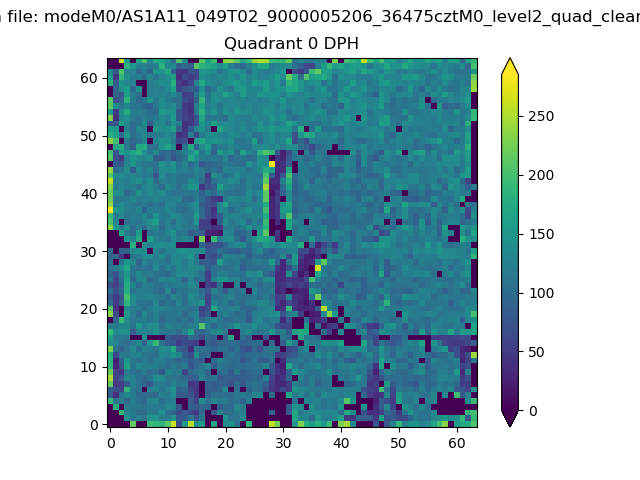 |
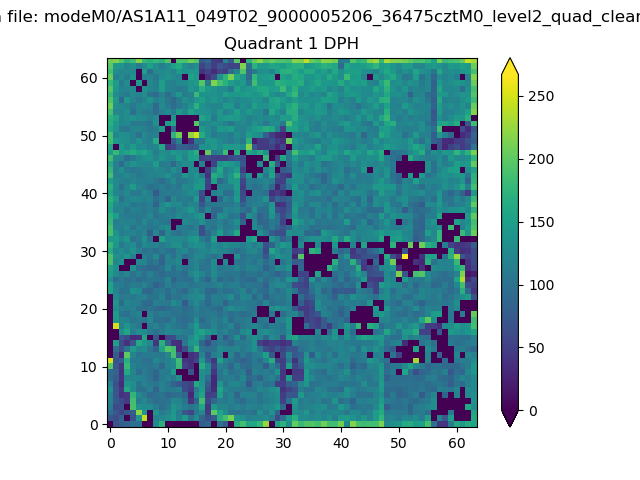 |
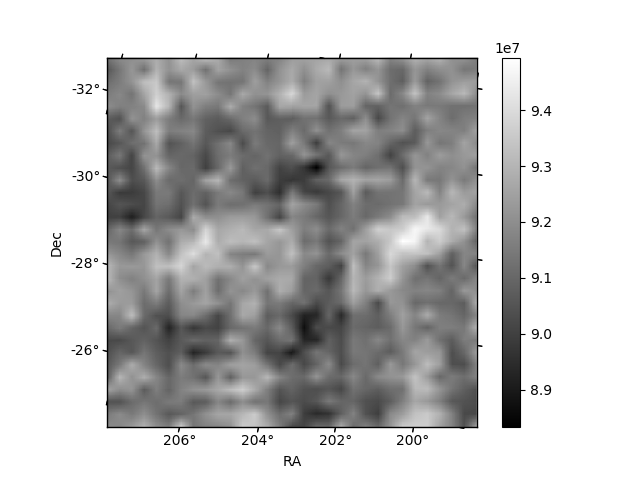
Quadrant B |
|---|---|---|---|
| Quadrant D | 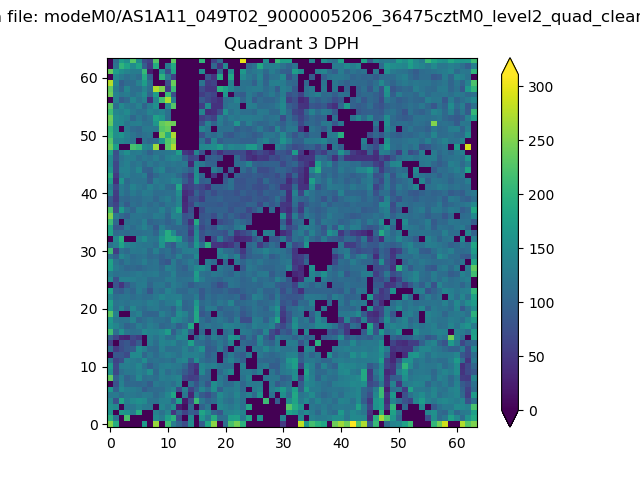 |
 |
Quadrant C |
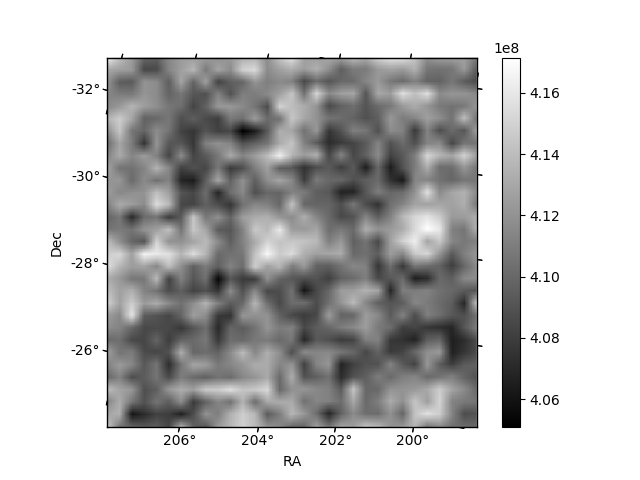
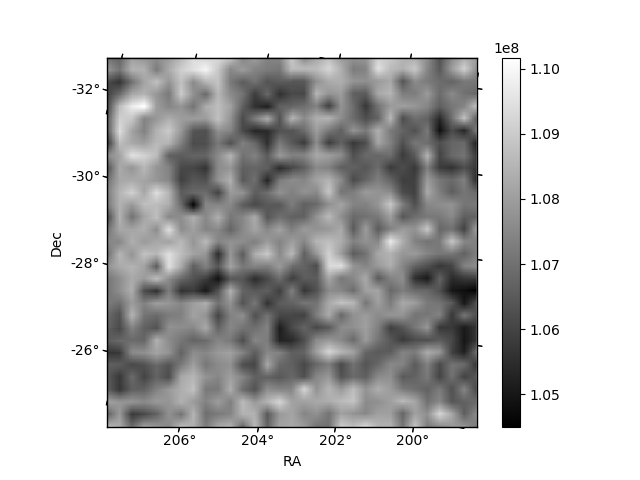
| Plot type | Count rate plots | Images |
|---|---|---|
| Comparison with Poisson distribution Blue bars denote a histogram of data divided into 1 sec bins. Red curve is a Poisson curve with rate = median count rate of data. |
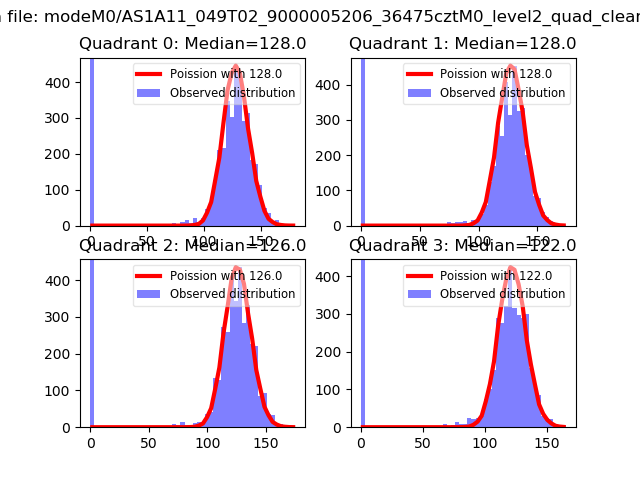 |
 |
| Quadrant-wise count rates Data is divided into 100 sec bins |
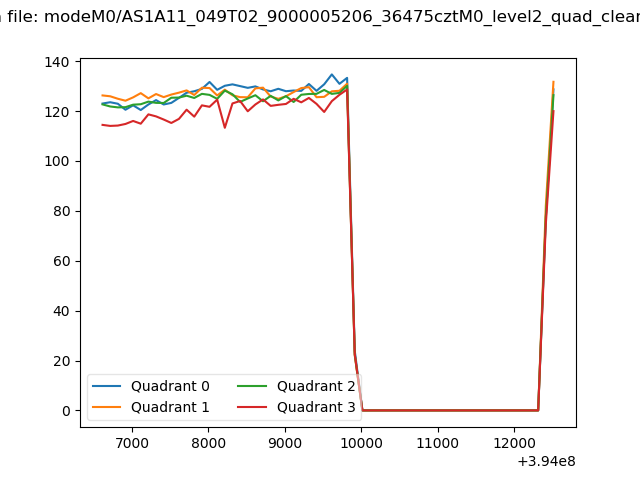 |
|
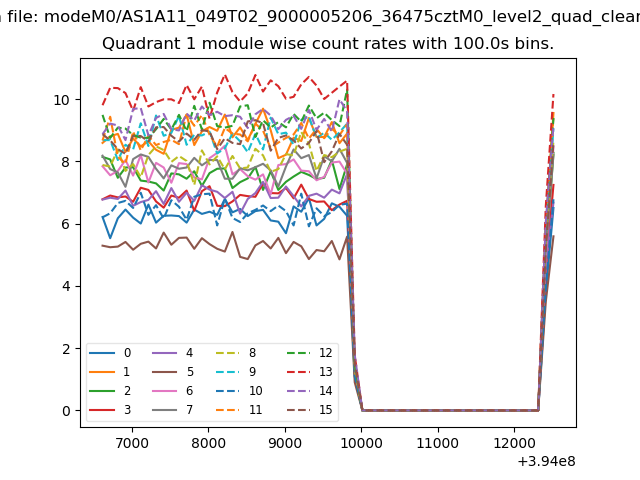
| Module-wise count rates for Quadrant A Data is divided into 100 sec bins |
 |
 |
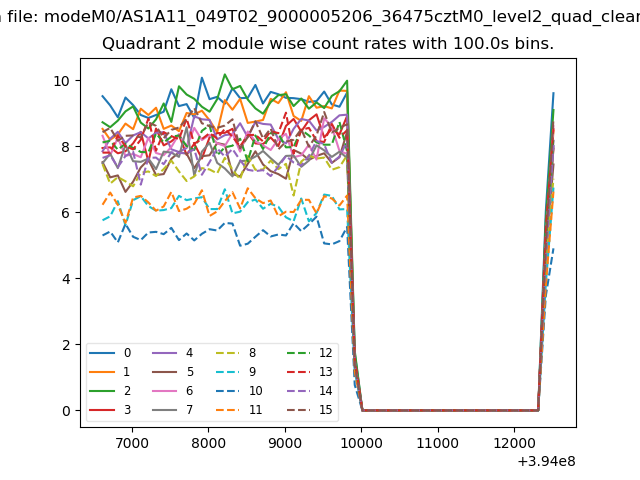
| Module-wise count rates for Quadrant B Data is divided into 100 sec bins |
 |
 |
| Module-wise count rates for Quadrant C Data is divided into 100 sec bins |
 |
 |
| Module-wise count rates for Quadrant D Data is divided into 100 sec bins |
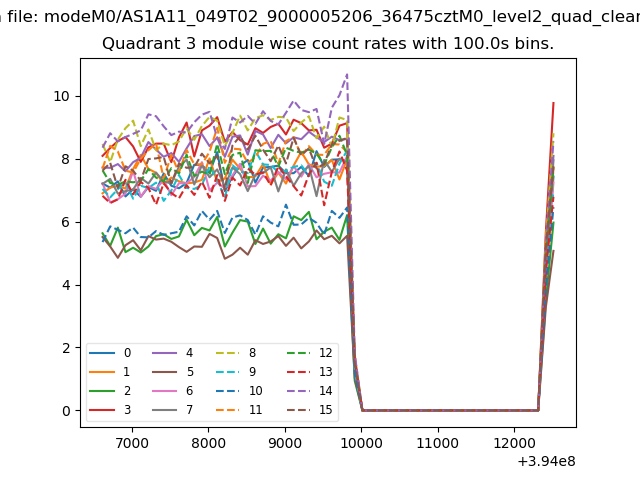 |
 |
| Parameter | Plot |
|---|---|
| CZT HV Monitor | 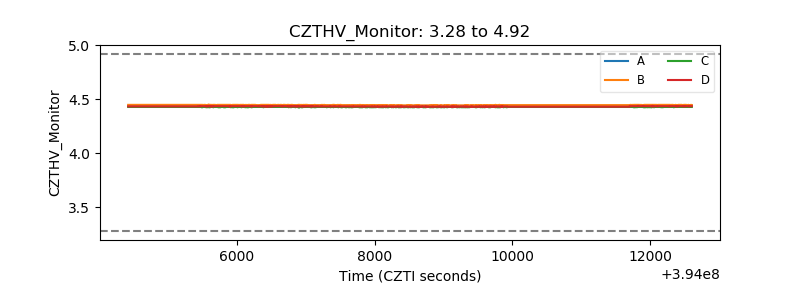 |
| D_VDD | 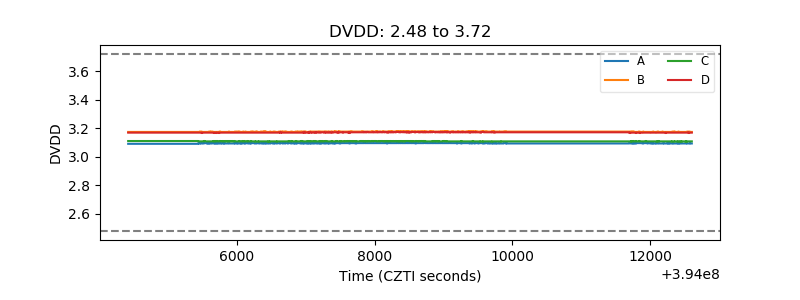 |
| Temperature 1 | 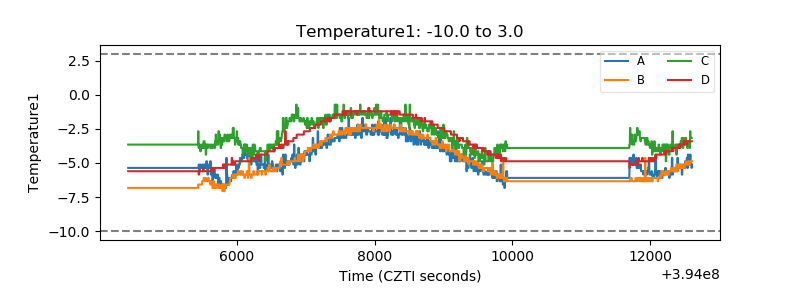 |
| Veto HV Monitor | 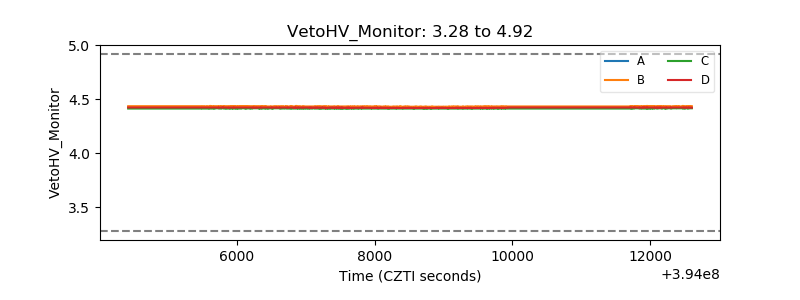 |
| Veto LLD | 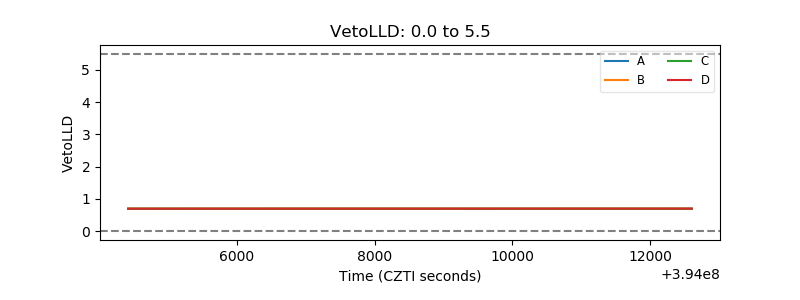 |
| Alpha Counter | 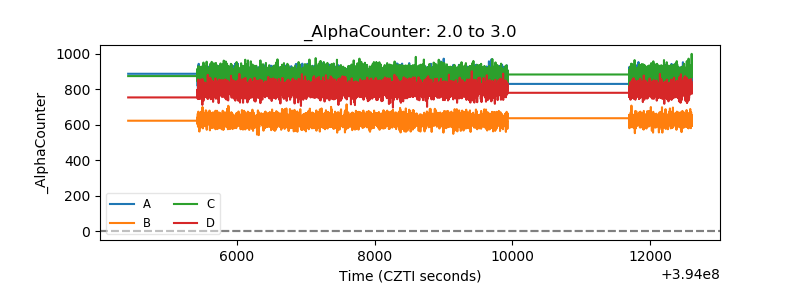 |
| _CPM_Rate | 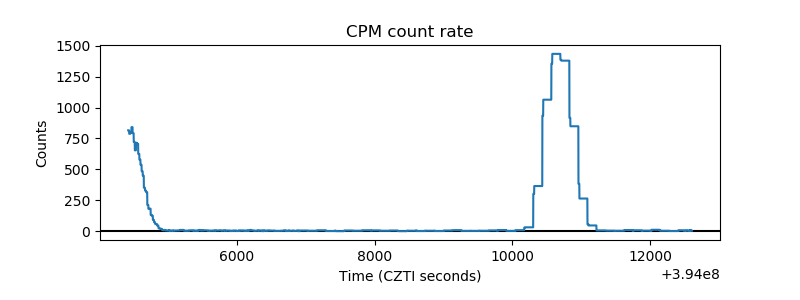 |
| CZT Counter | 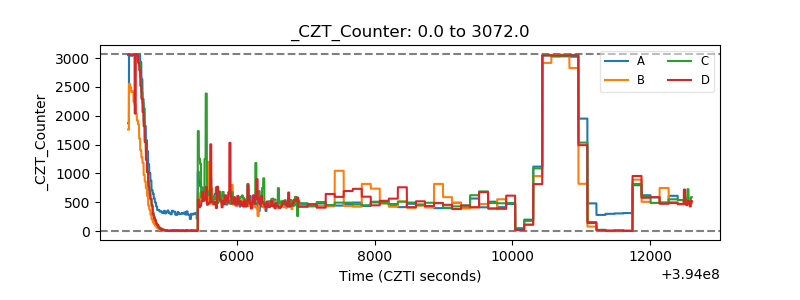 |
| +2.5 Volts monitor | 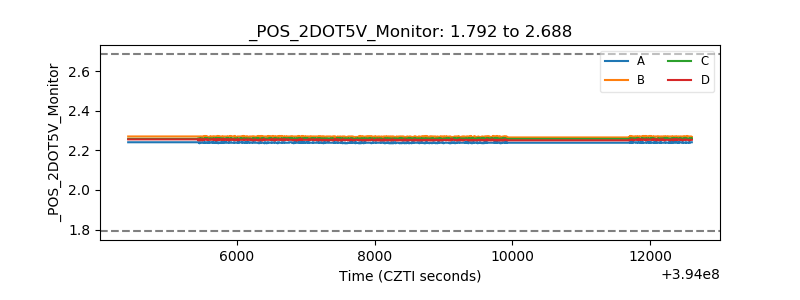 |
| +5 Volts monitor | 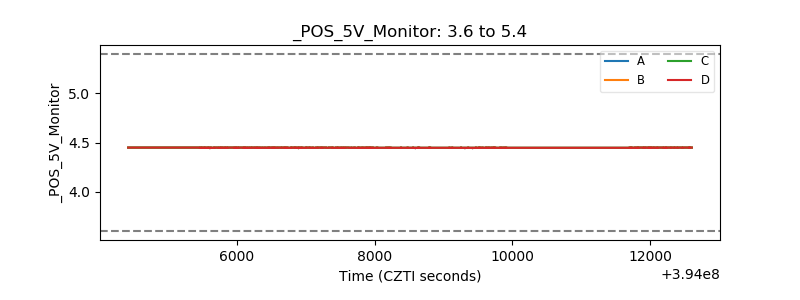 |
| _ROLL_ROT | 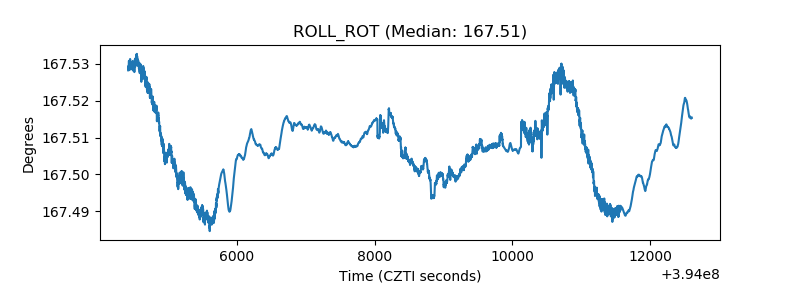 |
| _Roll_DEC | 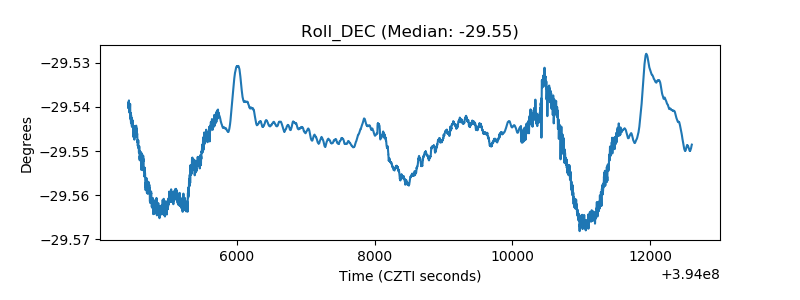 |
| _Roll_RA | 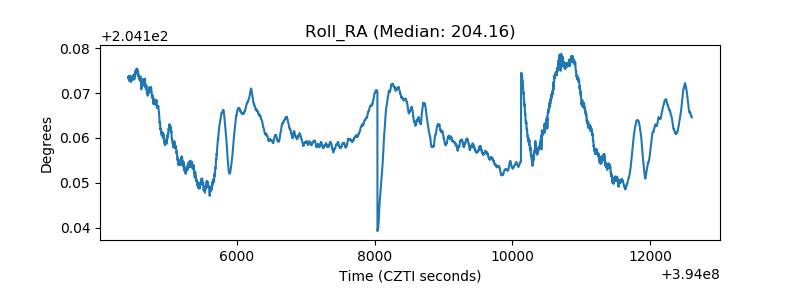 |
| Veto Counter | 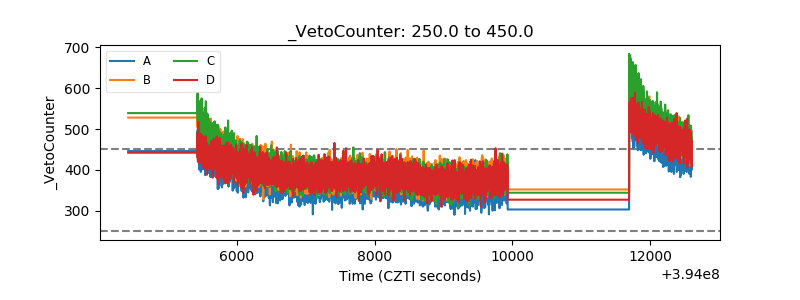 |