| Param | Original file | Final file |
|---|---|---|
| Filename | modeM0/AS1A11_049T02_9000005206_36473cztM0_level2.evt | modeM0/AS1A11_049T02_9000005206_36473cztM0_level2_quad_clean.evt |
| Size (bytes) | 426,139,200 | 62,320,320 |
| Size | 406.4 MB | 59.4 MB |
| Events in quadrant A | 2,763,671 | 381,763 |
| Events in quadrant B | 3,100,962 | 378,015 |
| Events in quadrant C | 2,979,008 | 376,086 |
| Events in quadrant D | 3,676,029 | 353,745 |
| Mode M0 | |||
|---|---|---|---|
| Quadrant | BADHDUFLAG | Total packets | Discarded packets |
| A | 0 | 11773 | 3 |
| B | 0 | 12746 | 2 |
| C | 0 | 12250 | 2 |
| D | 0 | 14812 | 2 |
| Mode SS | |||
|---|---|---|---|
| Quadrant | BADHDUFLAG | Total packets | Discarded packets |
| A | 0 | 114 | 0 |
| B | 0 | 114 | 0 |
| C | 0 | 114 | 0 |
| D | 0 | 114 | 0 |
| Mode M9 | |||
|---|---|---|---|
| Quadrant | BADHDUFLAG | Total packets | Discarded packets |
| A | 0 | 27 | 0 |
| B | 0 | 27 | 0 |
| C | 0 | 27 | 0 |
| D | 0 | 28 | 0 |
| Quadrant | Total seconds | Saturated seconds | Saturation percentage |
|---|---|---|---|
| A | 5683 | 7 | 0.123174% |
| B | 5683 | 71 | 1.249340% |
| C | 5683 | 56 | 0.985395% |
| D | 5683 | 201 | 3.536864% |
Noise dominated data is calculated using 1-second bins in cleaned event files. If a bin has >2000 counts, and if more than 50% of those come from <1% of pixels, then it is considered to be noise-dominated and hence unusable.
| Quadrant | # 1 sec bins | Bins with >0 counts | Bins with >2000 counts | High rate bins dominated by noise | Noise dominated (total time) | Noise dominated (detector-on time) | Marked lightcurve |
|---|---|---|---|---|---|---|---|
| A | 7296 | 5684 | 0 | 0 | 0.00% | 0.00% | 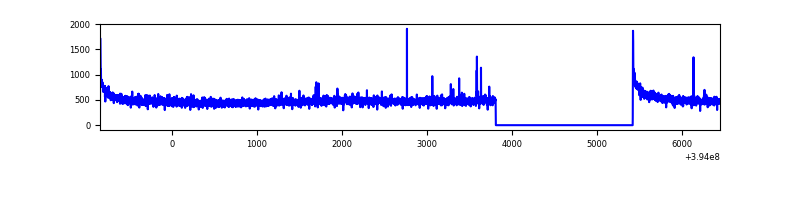 |
| B | 7296 | 5684 | 33 | 33 | 0.45% | 0.58% | 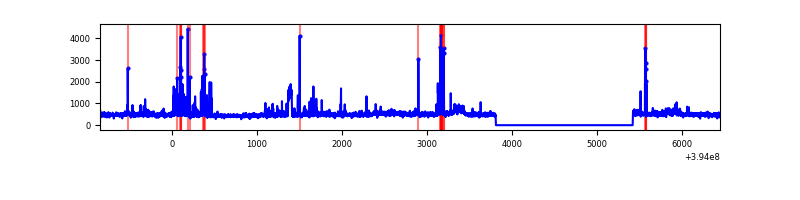 |
| C | 7296 | 5684 | 36 | 36 | 0.49% | 0.63% | 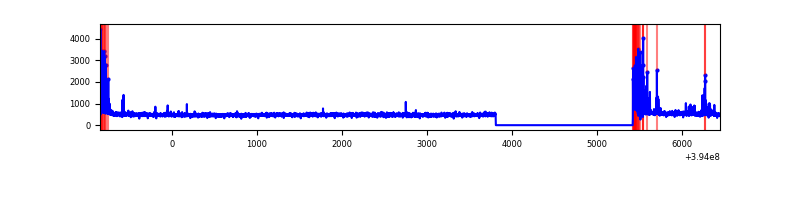 |
| D | 7296 | 5684 | 170 | 170 | 2.33% | 2.99% | 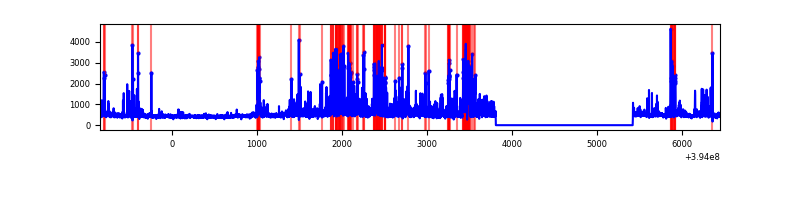 |
Top three noisy pixels from each quadrant. If the there are fewer than three noisy pixels in the level2.evt file, extra rows are filled as -1
| Pixel properties | Quadrant properties | ||||||
|---|---|---|---|---|---|---|---|
| Quadrant | DetID | PixID | Counts | Sigma | Mean | Median | Sigma |
| A | 10 | 83 | 200647 | 1495.61 | 657 | 644 | 133.7 |
| A | 9 | 143 | 11621 | 82.09 | 657 | 644 | 133.7 |
| A | 13 | 6 | 9266 | 64.47 | 657 | 644 | 133.7 |
| B | 5 | 255 | 199488 | 1601.04 | 647 | 630 | 124.2 |
| B | 15 | 85 | 71579 | 571.22 | 647 | 630 | 124.2 |
| B | 0 | 189 | 59972 | 477.77 | 647 | 630 | 124.2 |
| C | 0 | 10 | 248966 | 1677.86 | 633 | 636 | 148.0 |
| C | 15 | 214 | 246536 | 1661.44 | 633 | 636 | 148.0 |
| C | 0 | 207 | 11829 | 75.63 | 633 | 636 | 148.0 |
| D | 13 | 249 | 461814 | 2996.97 | 629 | 610 | 153.9 |
| D | 1 | 52 | 380879 | 2471.04 | 629 | 610 | 153.9 |
| D | 2 | 153 | 94524 | 610.27 | 629 | 610 | 153.9 |
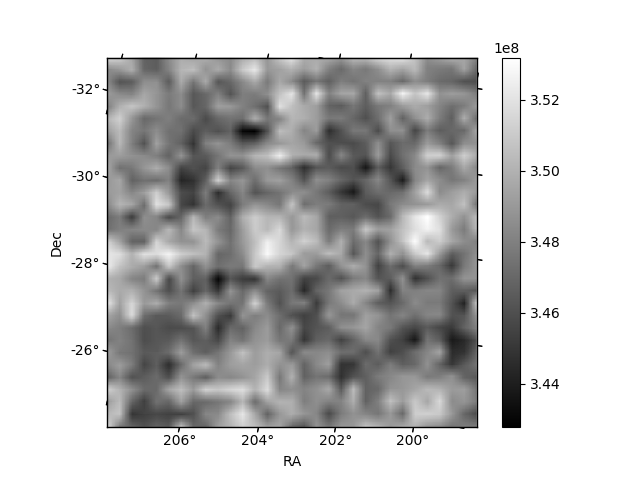
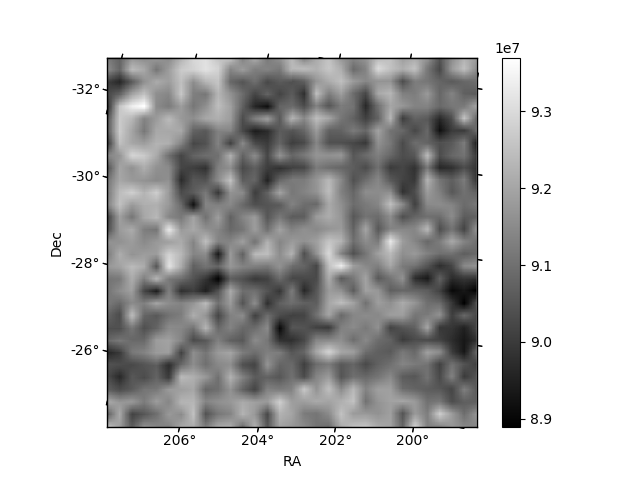
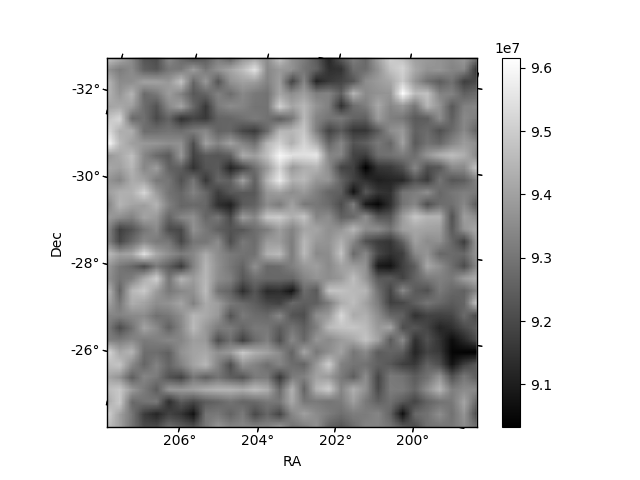
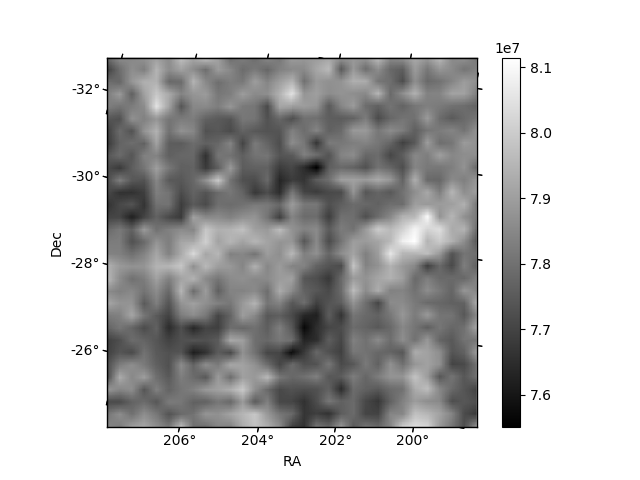
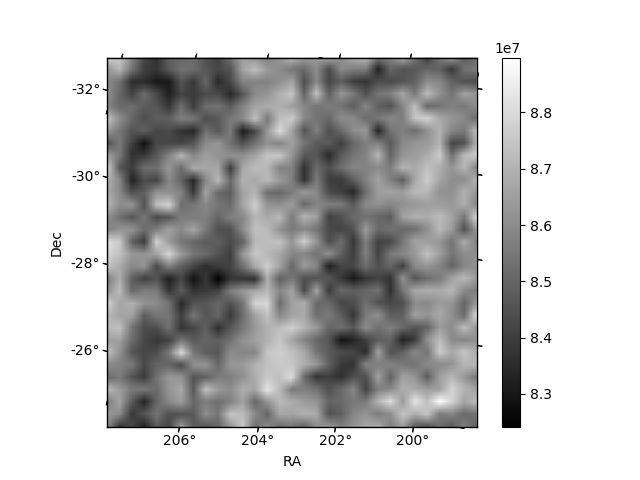
Histogram calculated using DETX and DETY for each event in the final _common_clean file
| Quadrant A | 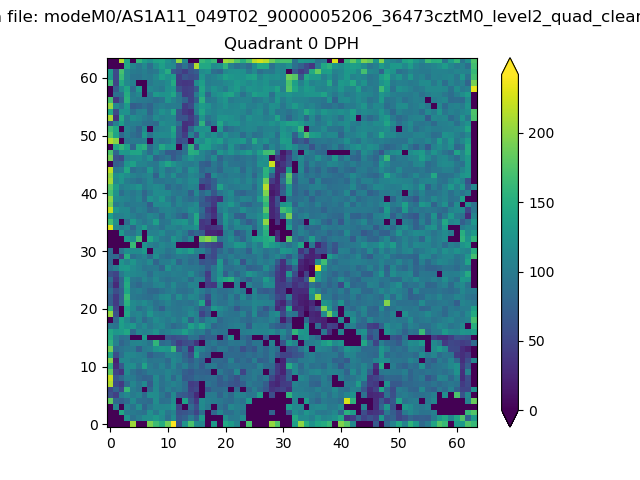 |
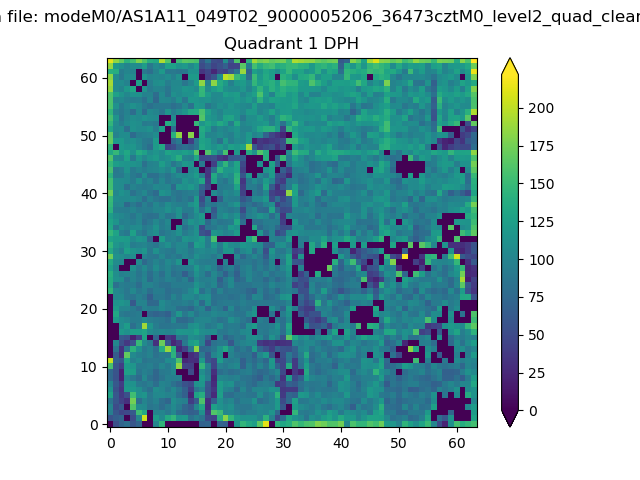 |
Quadrant B |
|---|---|---|---|
| Quadrant D | 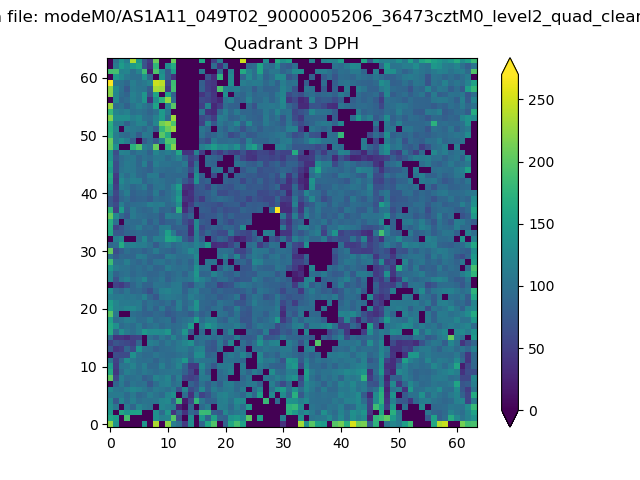 |
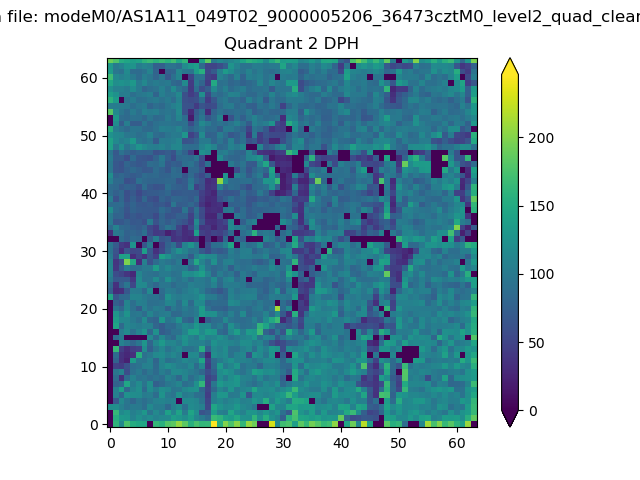 |
Quadrant C |
| Plot type | Count rate plots | Images |
|---|---|---|
| Comparison with Poisson distribution Blue bars denote a histogram of data divided into 1 sec bins. Red curve is a Poisson curve with rate = median count rate of data. |
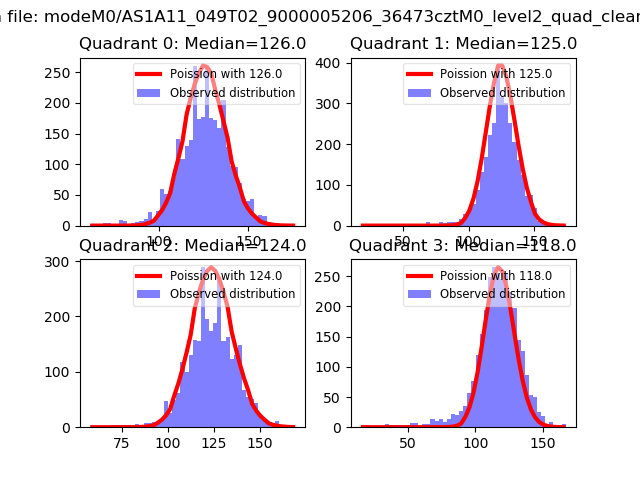 |
 |
| Quadrant-wise count rates Data is divided into 100 sec bins |
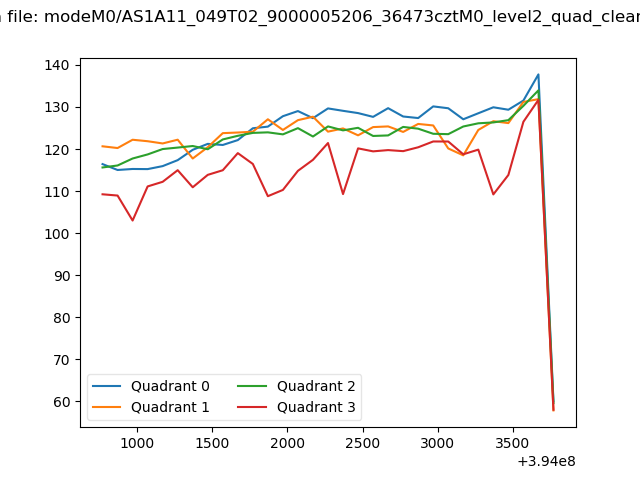 |
|
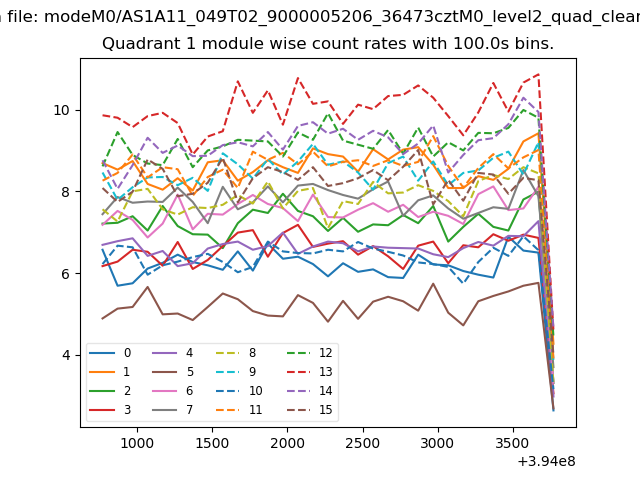
| Module-wise count rates for Quadrant A Data is divided into 100 sec bins |
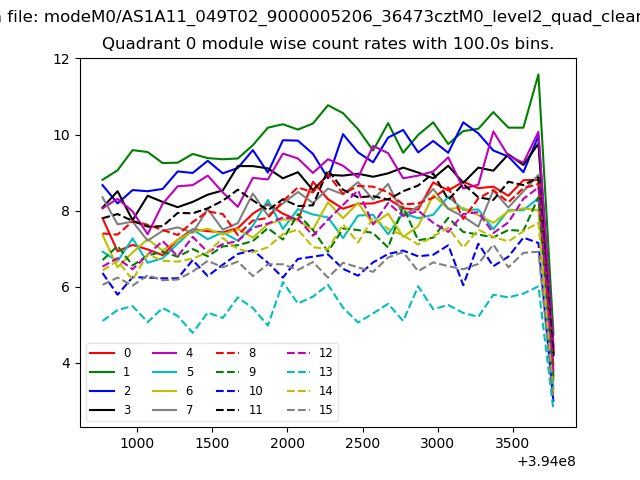 |
 |
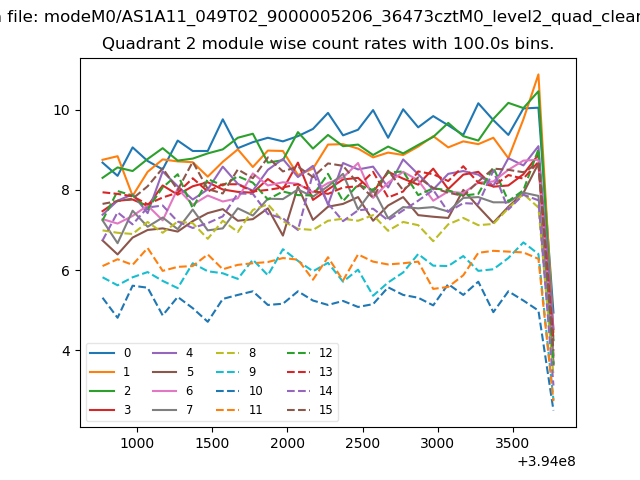
| Module-wise count rates for Quadrant B Data is divided into 100 sec bins |
 |
 |
| Module-wise count rates for Quadrant C Data is divided into 100 sec bins |
 |
 |
| Module-wise count rates for Quadrant D Data is divided into 100 sec bins |
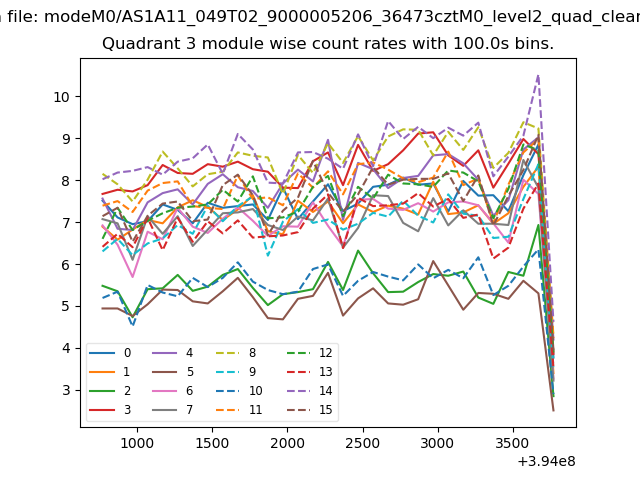 |
 |
| Parameter | Plot |
|---|---|
| CZT HV Monitor | 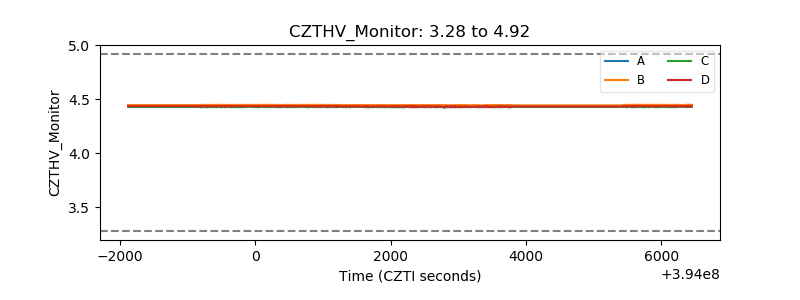 |
| D_VDD | 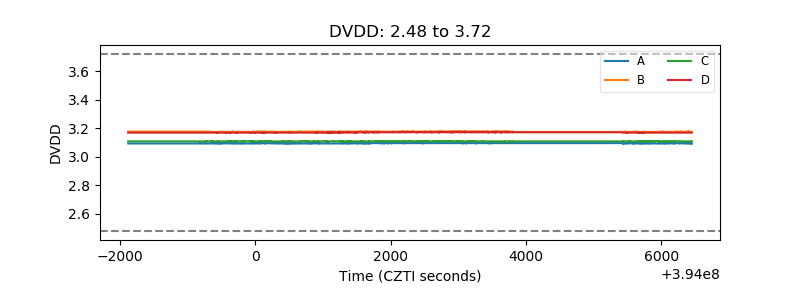 |
| Temperature 1 | 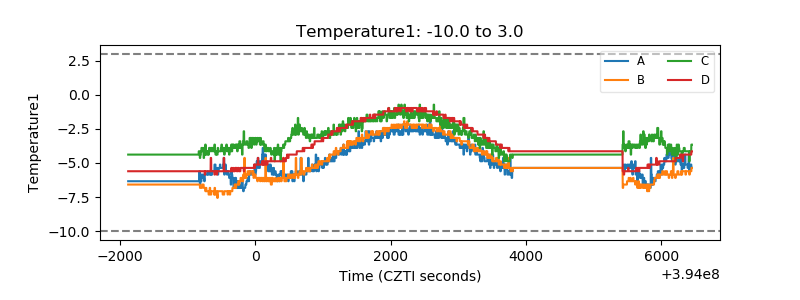 |
| Veto HV Monitor | 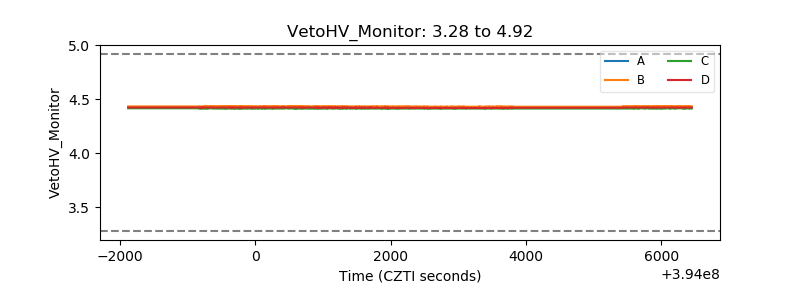 |
| Veto LLD | 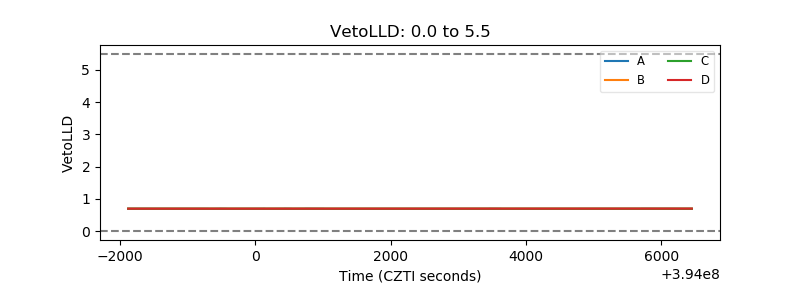 |
| Alpha Counter | 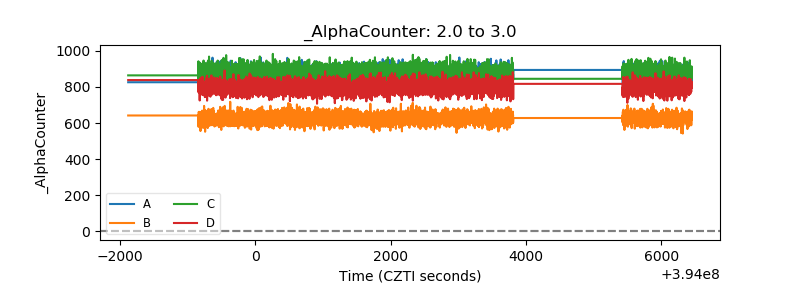 |
| _CPM_Rate | 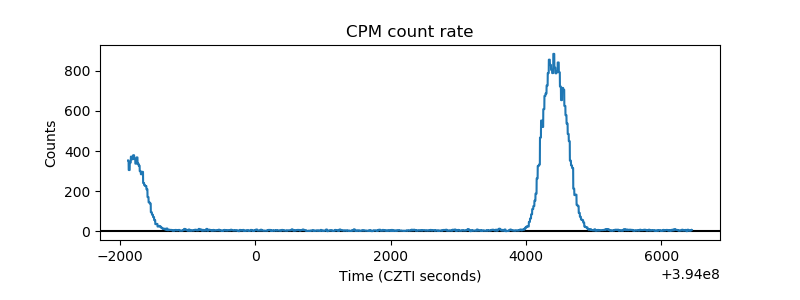 |
| CZT Counter | 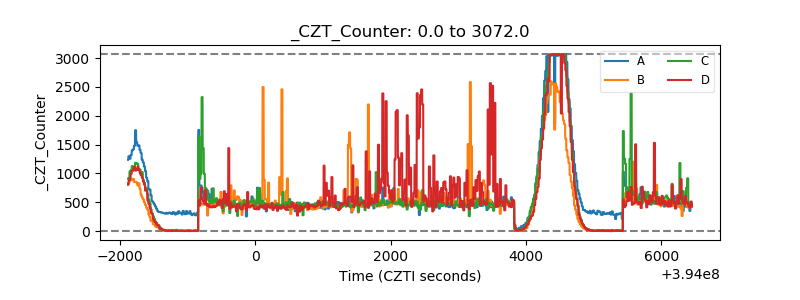 |
| +2.5 Volts monitor | 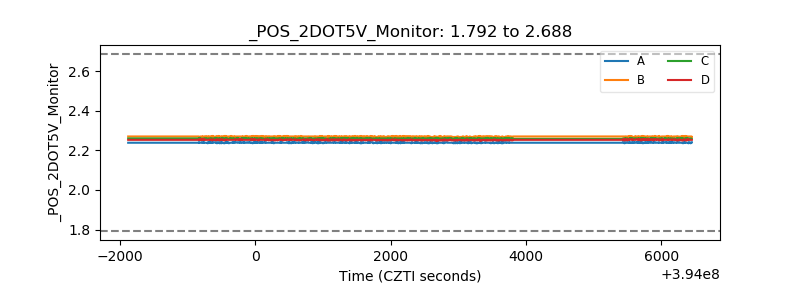 |
| +5 Volts monitor | 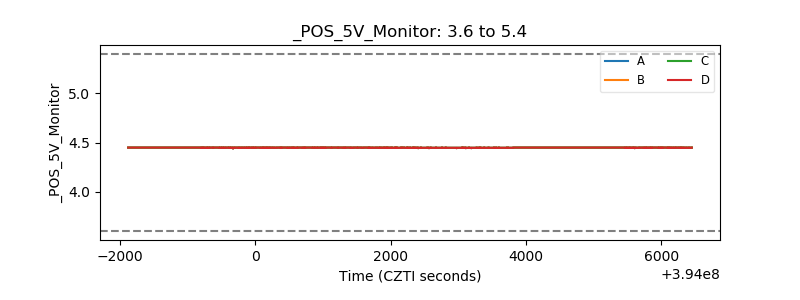 |
| _ROLL_ROT | 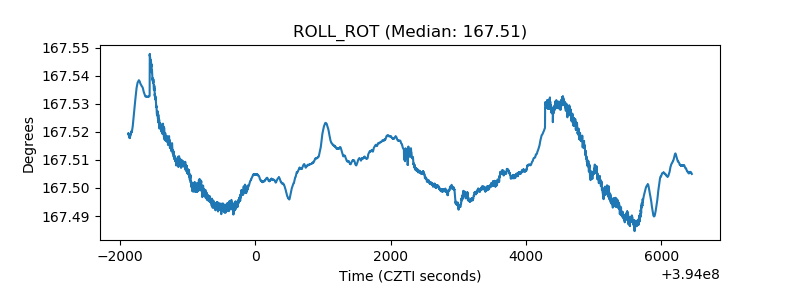 |
| _Roll_DEC | 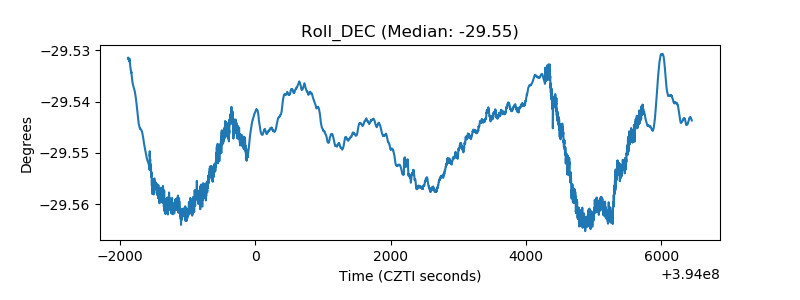 |
| _Roll_RA | 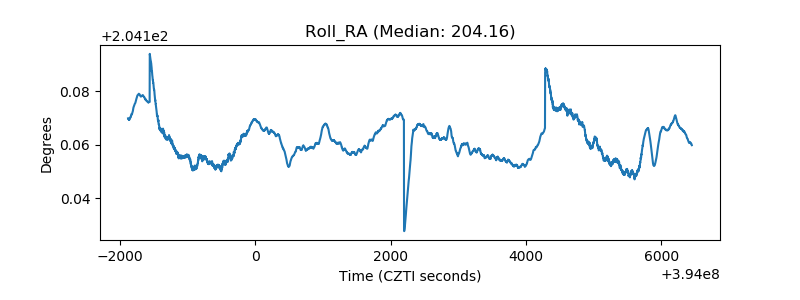 |
| Veto Counter | 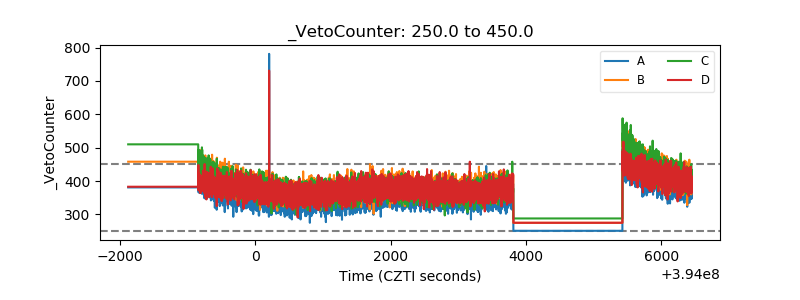 |