| Param | Original file | Final file |
|---|---|---|
| Filename | modeM0/AS1A11_049T02_9000005206cztM0_level2_bc.evt | modeM0/AS1A11_049T02_9000005206cztM0_level2_quad_clean.evt |
| Size (bytes) | 1,843,251,840 | 564,212,160 |
| Size | 1.7 GB | 538.1 MB |
| Events in quadrant A | 10,681,868 | 3,565,953 |
| Events in quadrant B | 13,546,686 | 3,497,937 |
| Events in quadrant C | 12,667,015 | 3,474,199 |
| Events in quadrant D | 15,717,408 | 3,317,967 |
| Mode M0 | |||
|---|---|---|---|
| Quadrant | BADHDUFLAG | Total packets | Discarded packets |
| A | 0 | 96712 | 0 |
| B | 0 | 110340 | 0 |
| C | 0 | 102031 | 0 |
| D | 0 | 117131 | 0 |
| Mode SS | |||
|---|---|---|---|
| Quadrant | BADHDUFLAG | Total packets | Discarded packets |
| A | 0 | 962 | 0 |
| B | 0 | 962 | 0 |
| C | 0 | 962 | 0 |
| D | 0 | 962 | 0 |
| Mode M9 | |||
|---|---|---|---|
| Quadrant | BADHDUFLAG | Total packets | Discarded packets |
| A | 0 | 161 | 0 |
| B | 0 | 161 | 0 |
| C | 0 | 161 | 0 |
| D | 0 | 161 | 0 |
| Quadrant | Total seconds | Saturated seconds | Saturation percentage |
|---|---|---|---|
| A | 47108 | 50 | 0.106139% |
| B | 47106 | 1091 | 2.316053% |
| C | 47108 | 465 | 0.987093% |
| D | 47108 | 1419 | 3.012227% |
Noise dominated data is calculated using 1-second bins in cleaned event files. If a bin has >2000 counts, and if more than 50% of those come from <1% of pixels, then it is considered to be noise-dominated and hence unusable.
| Quadrant | # 1 sec bins | Bins with >0 counts | Bins with >2000 counts | High rate bins dominated by noise | Noise dominated (total time) | Noise dominated (detector-on time) | Marked lightcurve |
|---|---|---|---|---|---|---|---|
| A | 63204 | 47118 | 0 | 0 | 0.00% | 0.00% | 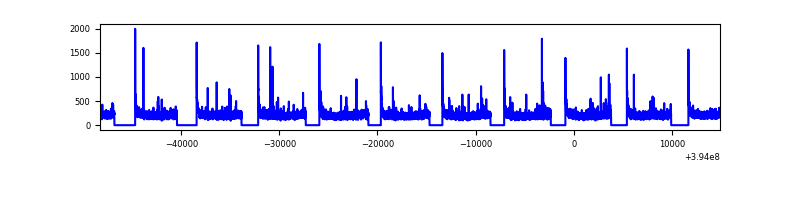 |
| B | 63204 | 47108 | 70 | 70 | 0.11% | 0.15% | 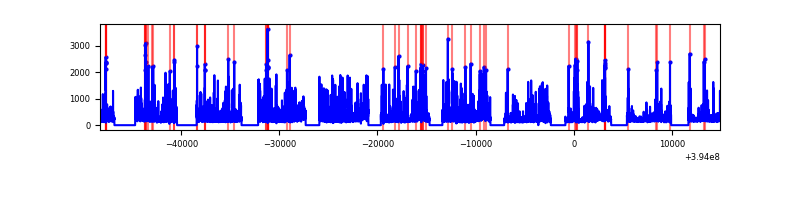 |
| C | 63204 | 47108 | 83 | 83 | 0.13% | 0.18% | 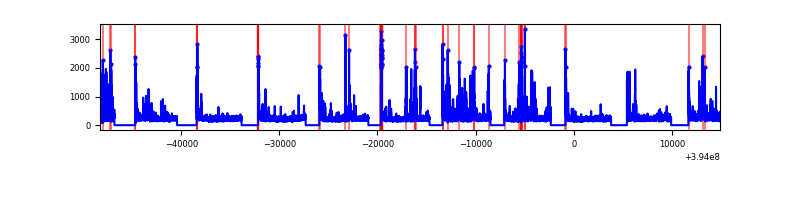 |
| D | 63204 | 47108 | 462 | 462 | 0.73% | 0.98% | 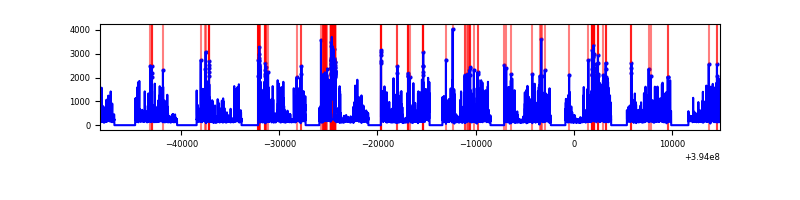 |
Top three noisy pixels from each quadrant. If the there are fewer than three noisy pixels in the level2.evt file, extra rows are filled as -1
| Pixel properties | Quadrant properties | ||||||
|---|---|---|---|---|---|---|---|
| Quadrant | DetID | PixID | Counts | Sigma | Mean | Median | Sigma |
| A | 10 | 83 | 1293741 | 2395.01 | 2384 | 2342 | 539.2 |
| A | 13 | 254 | 77890 | 140.11 | 2384 | 2342 | 539.2 |
| A | 9 | 143 | 52629 | 93.26 | 2384 | 2342 | 539.2 |
| B | 5 | 172 | 1836423 | 3896.39 | 2348 | 2295 | 470.7 |
| B | 5 | 255 | 962941 | 2040.78 | 2348 | 2295 | 470.7 |
| B | 0 | 189 | 525769 | 1112.06 | 2348 | 2295 | 470.7 |
| C | 15 | 214 | 1910869 | 3620.55 | 2283 | 2260 | 527.2 |
| C | 0 | 10 | 1054015 | 1995.13 | 2283 | 2260 | 527.2 |
| C | 0 | 207 | 640563 | 1210.83 | 2283 | 2260 | 527.2 |
| D | 13 | 249 | 1322472 | 2434.42 | 2299 | 2234 | 542.3 |
| D | 1 | 20 | 920321 | 1692.88 | 2299 | 2234 | 542.3 |
| D | 13 | 171 | 632216 | 1161.64 | 2299 | 2234 | 542.3 |
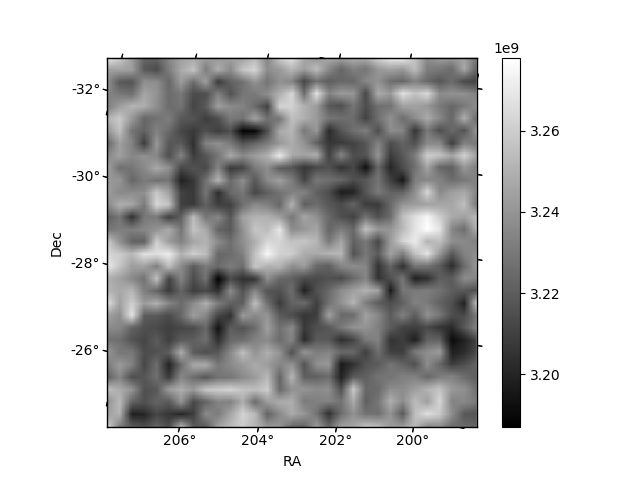
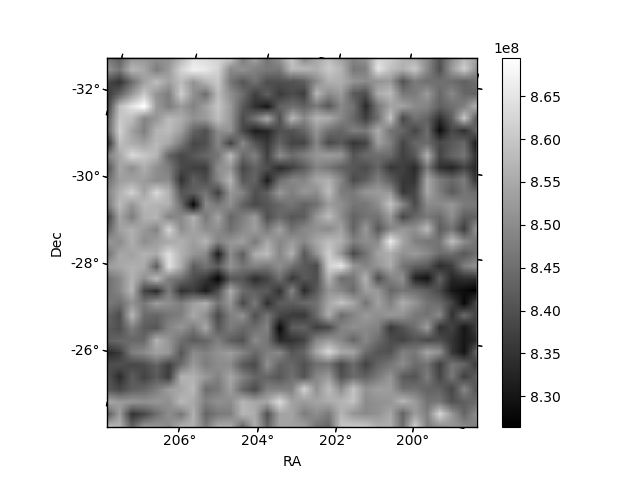
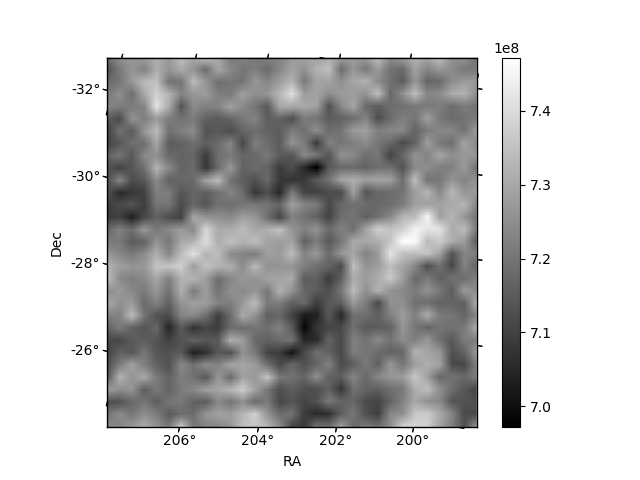
Histogram calculated using DETX and DETY for each event in the final _common_clean file
| Quadrant A | 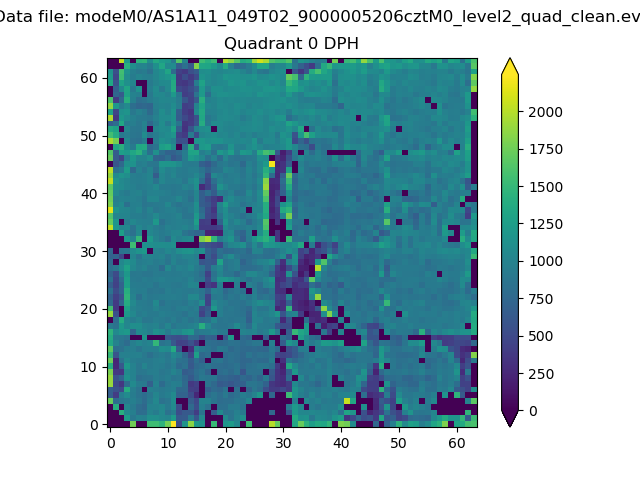 |
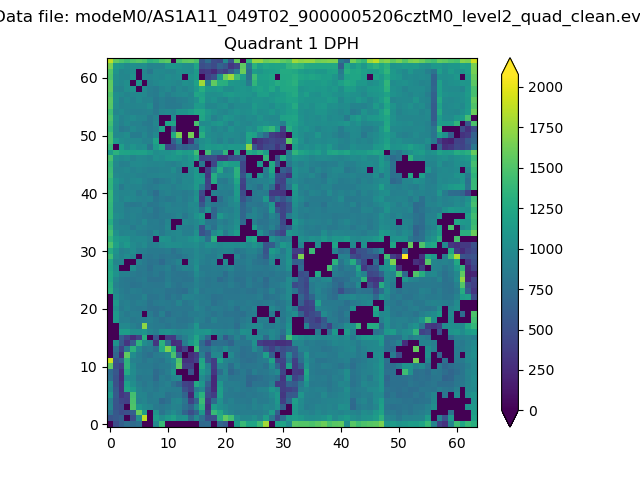 |
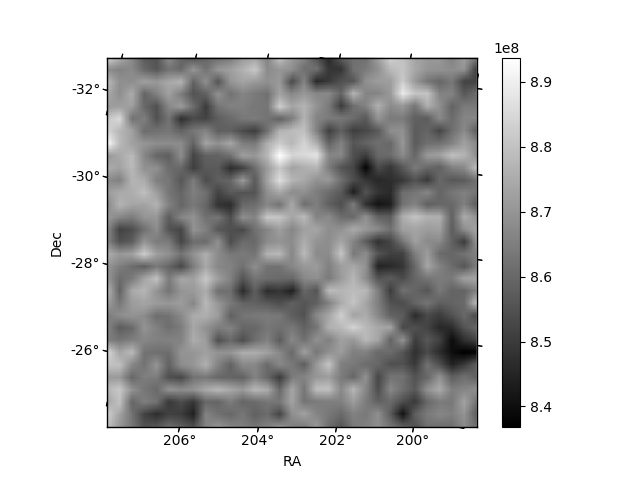
Quadrant B |
|---|---|---|---|
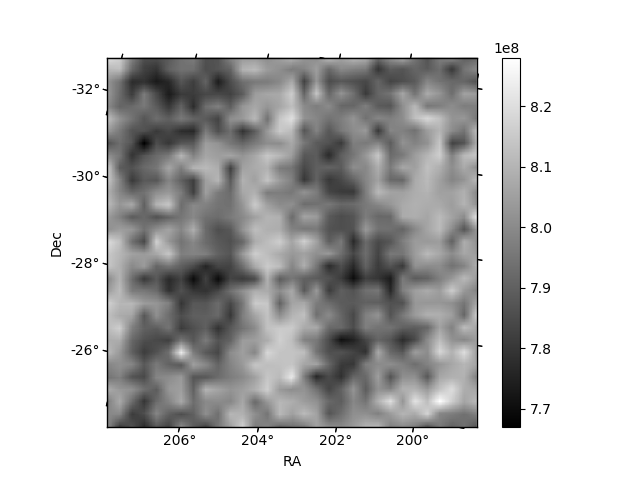
| Quadrant D | 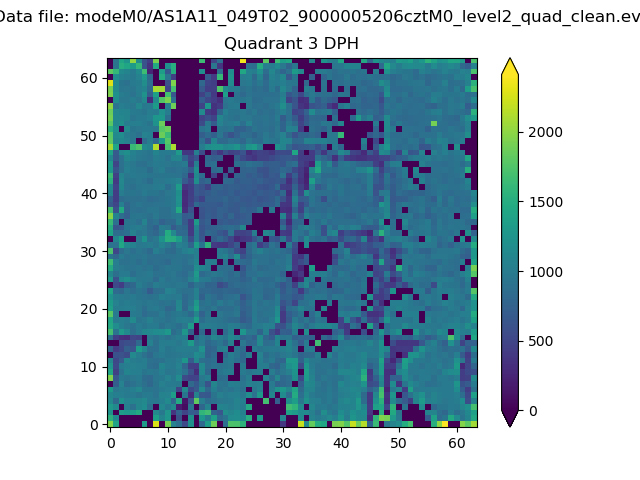 |
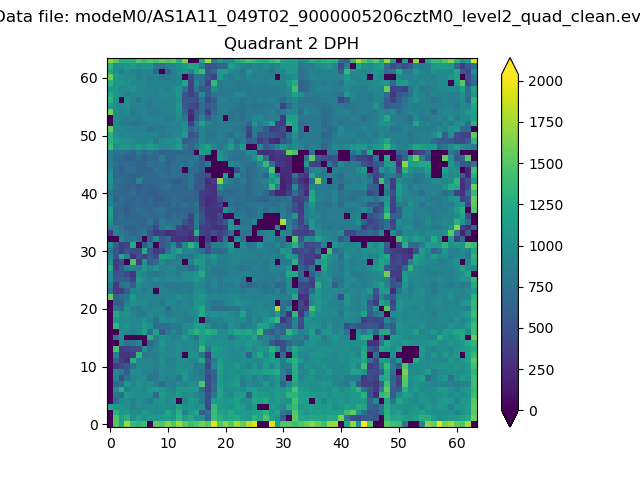 |
Quadrant C |
| Plot type | Count rate plots | Images |
|---|---|---|
| Comparison with Poisson distribution Blue bars denote a histogram of data divided into 1 sec bins. Red curve is a Poisson curve with rate = median count rate of data. |
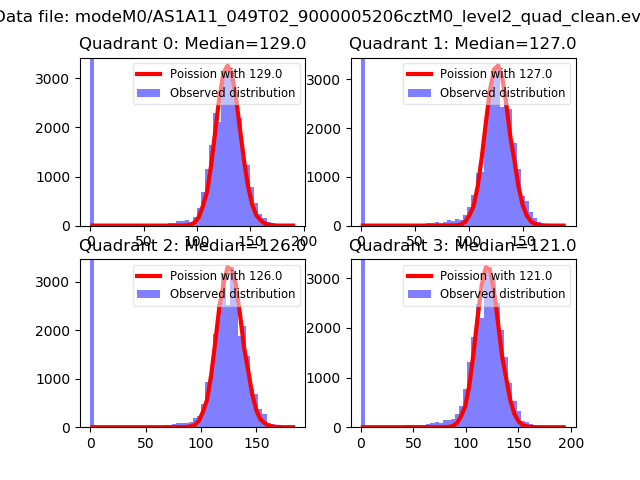 |
 |
| Quadrant-wise count rates Data is divided into 100 sec bins |
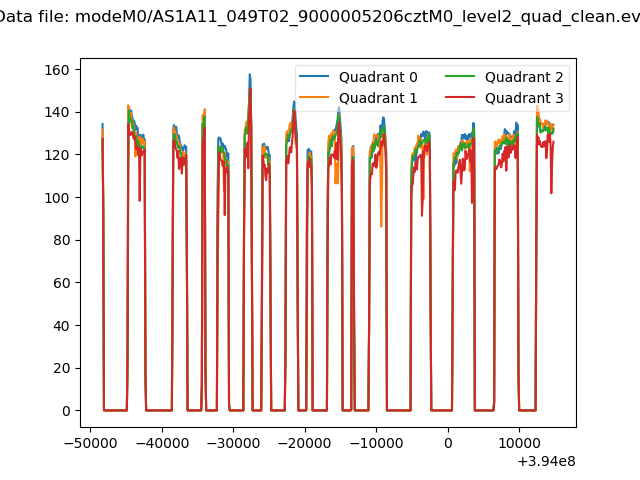 |
|
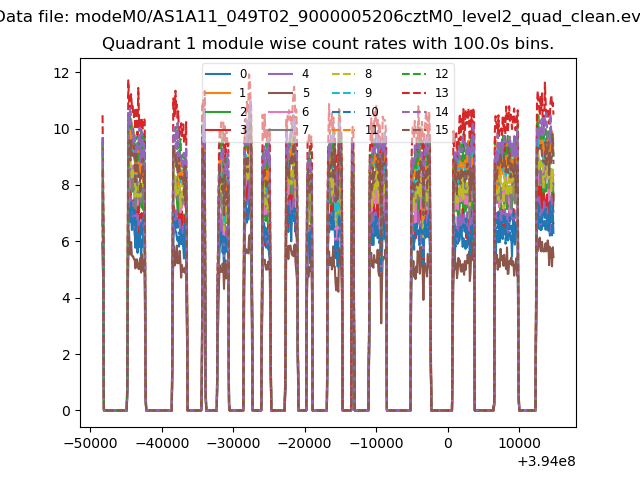
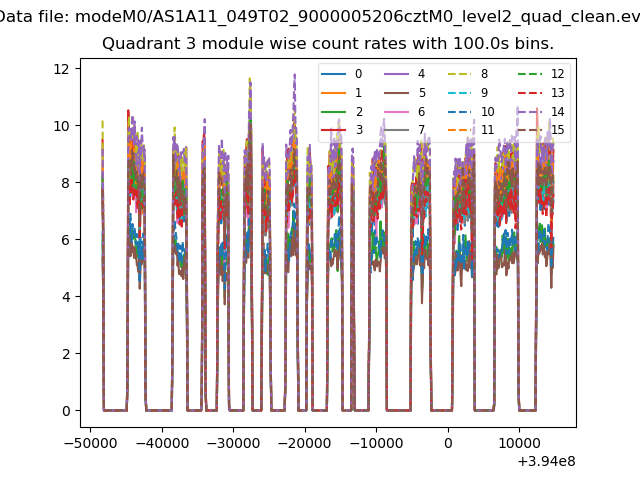
| Module-wise count rates for Quadrant A Data is divided into 100 sec bins |
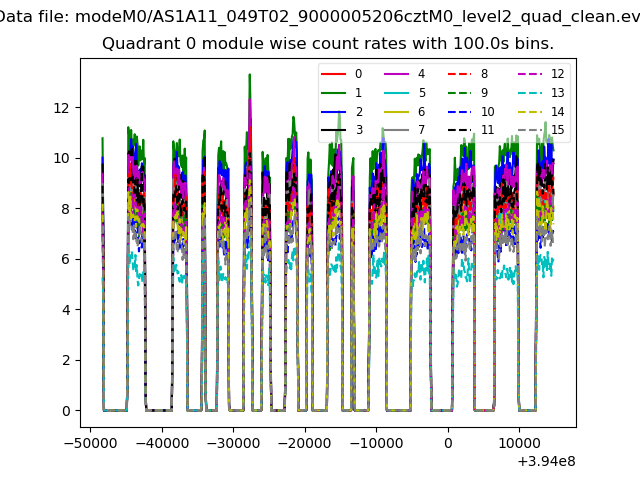 |
 |
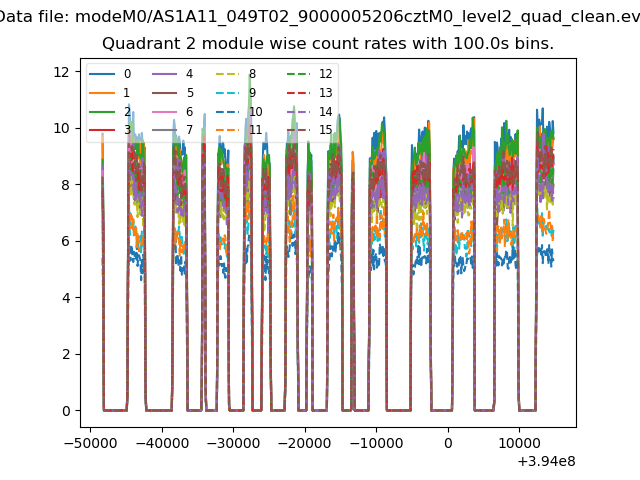
| Module-wise count rates for Quadrant B Data is divided into 100 sec bins |
 |
 |
| Module-wise count rates for Quadrant C Data is divided into 100 sec bins |
 |
 |
| Module-wise count rates for Quadrant D Data is divided into 100 sec bins |
 |
 |
| Parameter | Plot |
|---|---|
| CZT HV Monitor | 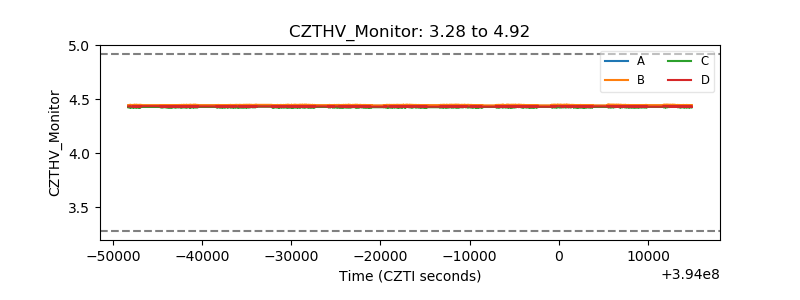 |
| D_VDD | 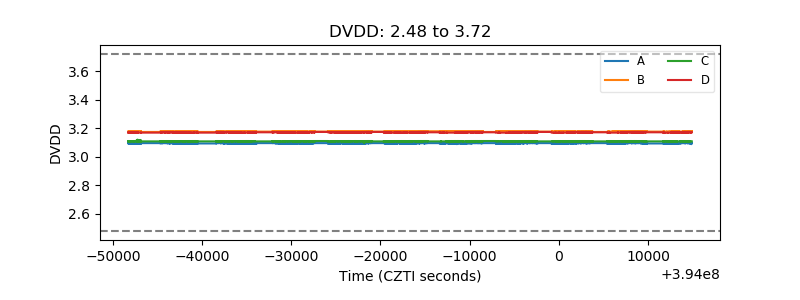 |
| Temperature 1 | 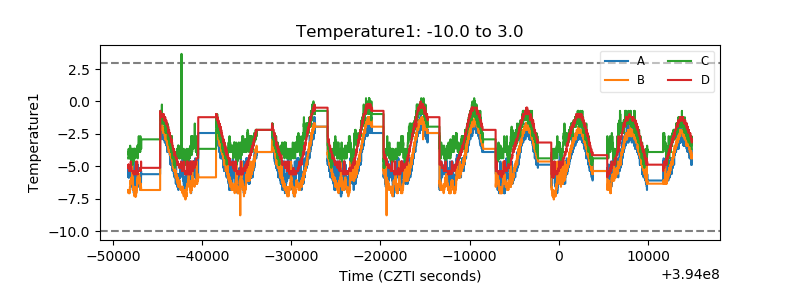 |
| Veto HV Monitor | 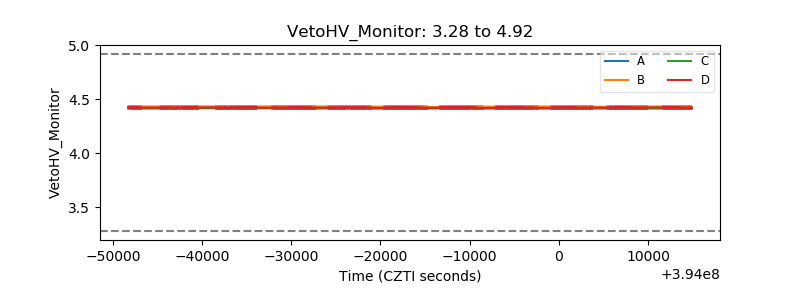 |
| Veto LLD | 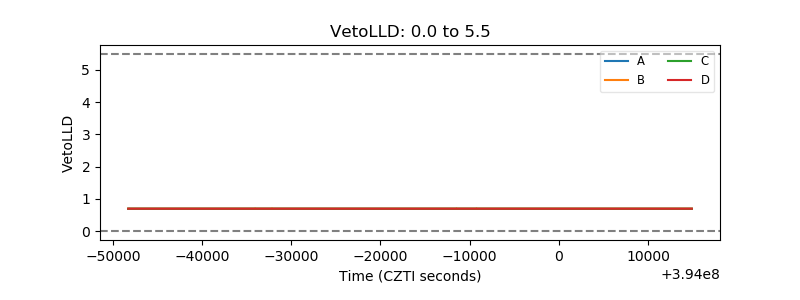 |
| Alpha Counter | 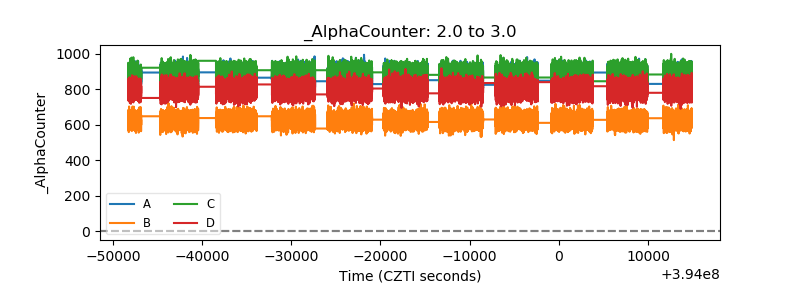 |
| _CPM_Rate | 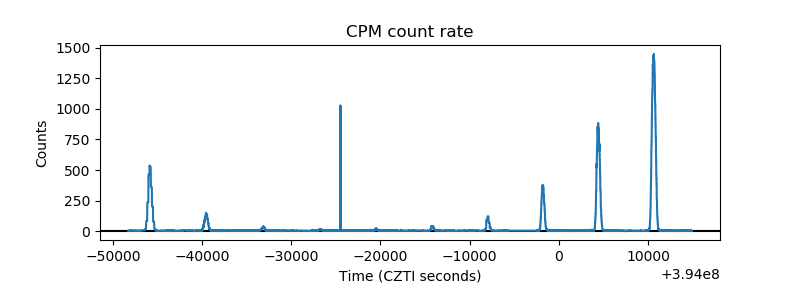 |
| CZT Counter | 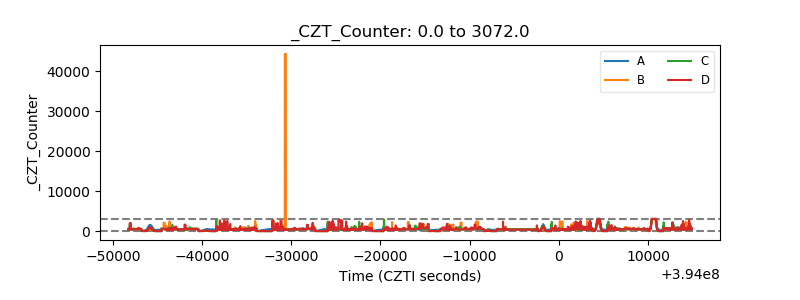 |
| +2.5 Volts monitor | 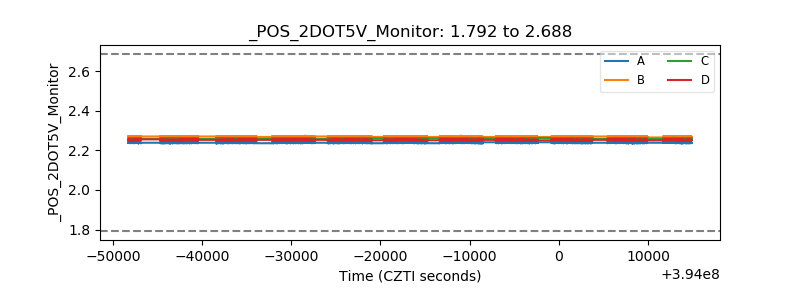 |
| +5 Volts monitor | 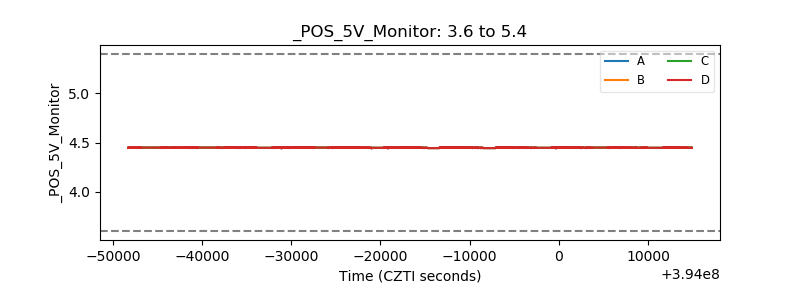 |
| _ROLL_ROT | 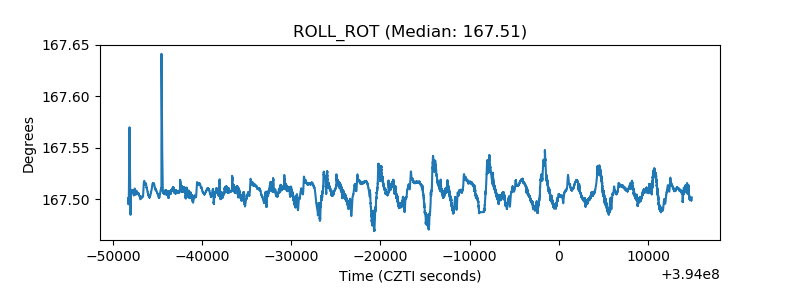 |
| _Roll_DEC | 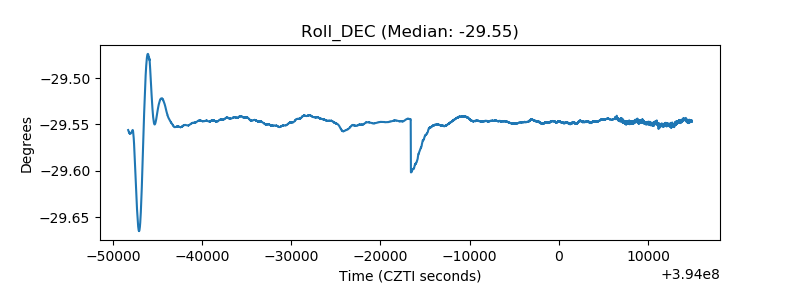 |
| _Roll_RA | 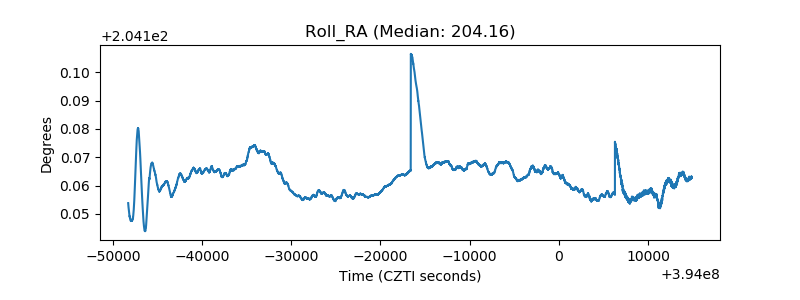 |
| Veto Counter | 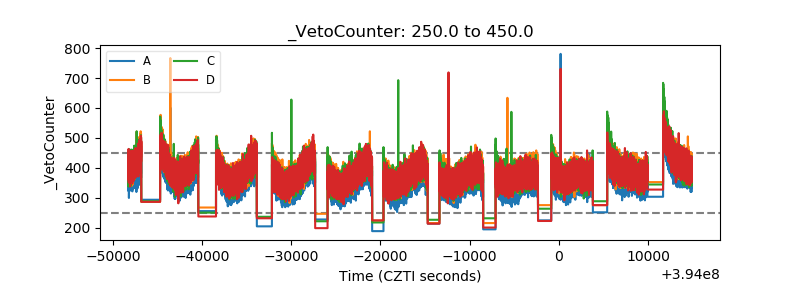 |