| Param | Original file | Final file |
|---|---|---|
| Filename | modeM0/AS1A09_014T01_9000005204_36465cztM0_level2.evt | modeM0/AS1A09_014T01_9000005204_36465cztM0_level2_quad_clean.evt |
| Size (bytes) | 126,547,200 | 32,650,560 |
| Size | 120.7 MB | 31.1 MB |
| Events in quadrant A | 852,548 | 225,428 |
| Events in quadrant B | 1,036,354 | 217,706 |
| Events in quadrant C | 960,121 | 217,979 |
| Events in quadrant D | 876,034 | 213,111 |
| Mode SS | |||
|---|---|---|---|
| Quadrant | BADHDUFLAG | Total packets | Discarded packets |
| A | 0 | 30 | 0 |
| B | 0 | 30 | 0 |
| C | 0 | 30 | 0 |
| D | 0 | 30 | 0 |
| Mode M0 | |||
|---|---|---|---|
| Quadrant | BADHDUFLAG | Total packets | Discarded packets |
| A | 0 | 3450 | 1 |
| B | 0 | 3999 | 1 |
| C | 0 | 3682 | 1 |
| D | 0 | 3528 | 1 |
| Quadrant | Total seconds | Saturated seconds | Saturation percentage |
|---|---|---|---|
| A | 1547 | 3 | 0.193924% |
| B | 1547 | 75 | 4.848093% |
| C | 1547 | 63 | 4.072398% |
| D | 1548 | 11 | 0.710594% |
Noise dominated data is calculated using 1-second bins in cleaned event files. If a bin has >2000 counts, and if more than 50% of those come from <1% of pixels, then it is considered to be noise-dominated and hence unusable.
| Quadrant | # 1 sec bins | Bins with >0 counts | Bins with >2000 counts | High rate bins dominated by noise | Noise dominated (total time) | Noise dominated (detector-on time) | Marked lightcurve |
|---|---|---|---|---|---|---|---|
| A | 1547 | 1547 | 0 | 0 | 0.00% | 0.00% | 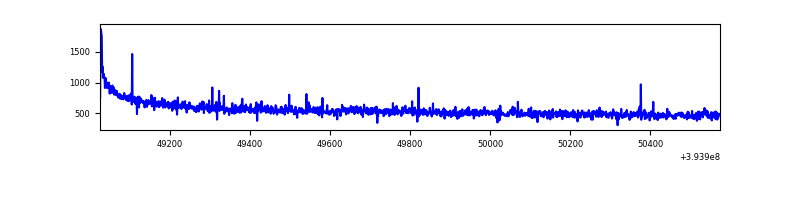 |
| B | 1547 | 1547 | 60 | 60 | 3.88% | 3.88% | 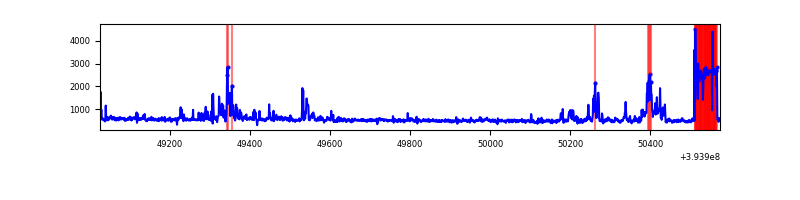 |
| C | 1547 | 1547 | 35 | 35 | 2.26% | 2.26% | 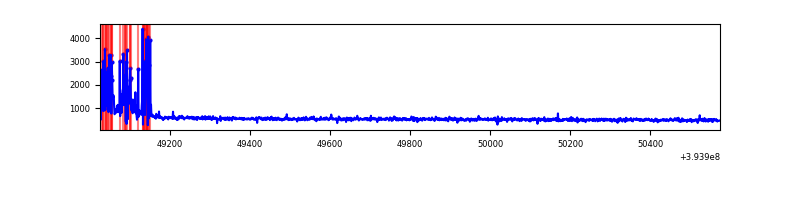 |
| D | 1548 | 1548 | 8 | 8 | 0.52% | 0.52% | 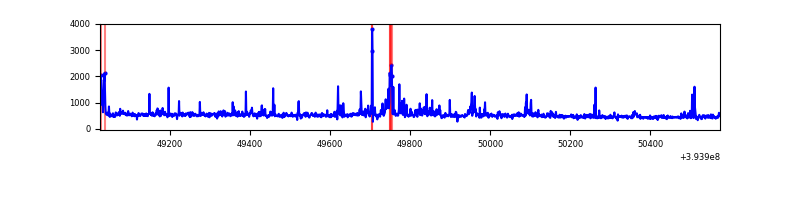 |
Top three noisy pixels from each quadrant. If the there are fewer than three noisy pixels in the level2.evt file, extra rows are filled as -1
| Pixel properties | Quadrant properties | ||||||
|---|---|---|---|---|---|---|---|
| Quadrant | DetID | PixID | Counts | Sigma | Mean | Median | Sigma |
| A | 10 | 83 | 82187 | 2044.73 | 196 | 192 | 40.1 |
| A | 6 | 10 | 4081 | 96.98 | 196 | 192 | 40.1 |
| A | 13 | 254 | 3015 | 70.4 | 196 | 192 | 40.1 |
| B | 5 | 172 | 236739 | 6484.71 | 186 | 181 | 36.5 |
| B | 15 | 85 | 22278 | 605.74 | 186 | 181 | 36.5 |
| B | 0 | 190 | 9843 | 264.86 | 186 | 181 | 36.5 |
| C | 0 | 10 | 153635 | 3426.28 | 187 | 189 | 44.8 |
| C | 15 | 214 | 72319 | 1610.58 | 187 | 189 | 44.8 |
| C | 0 | 207 | 1662 | 32.89 | 187 | 189 | 44.8 |
| D | 10 | 199 | 47221 | 973.96 | 193 | 189 | 48.3 |
| D | 2 | 153 | 19187 | 393.42 | 193 | 189 | 48.3 |
| D | 2 | 120 | 16233 | 332.25 | 193 | 189 | 48.3 |
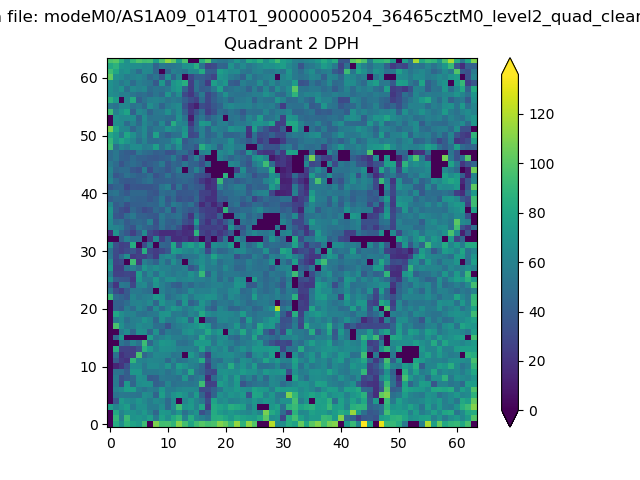
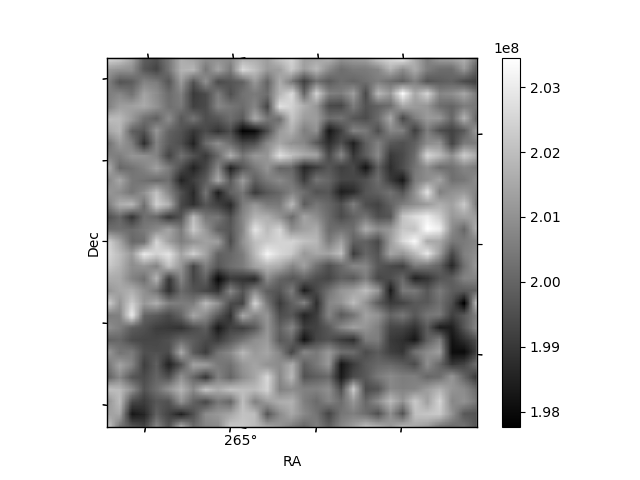
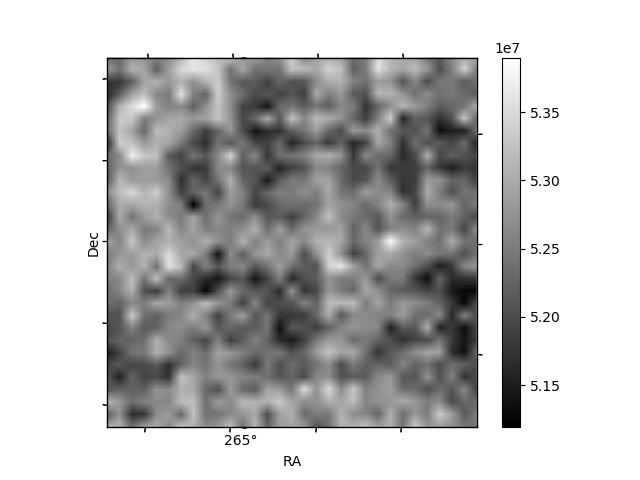
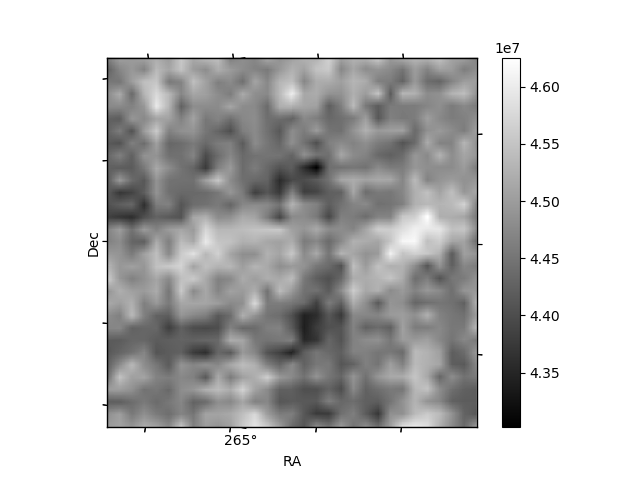
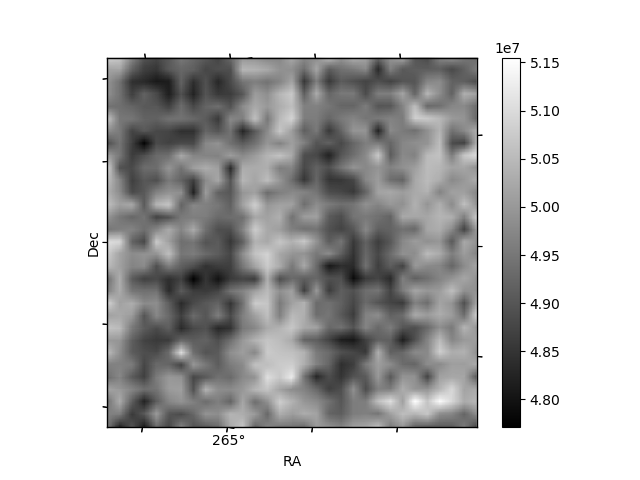
Histogram calculated using DETX and DETY for each event in the final _common_clean file
| Quadrant A | 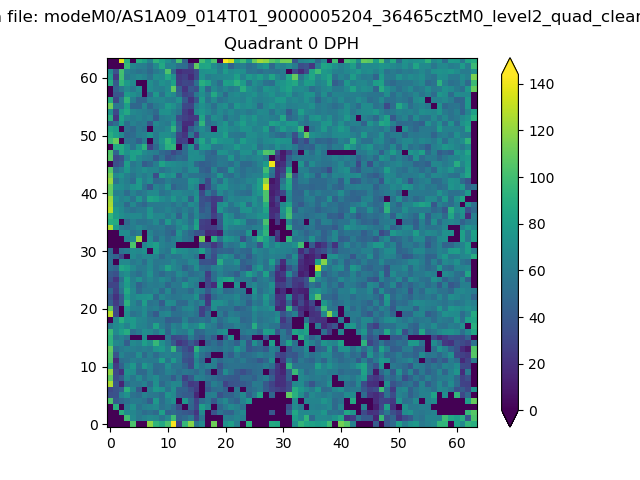 |
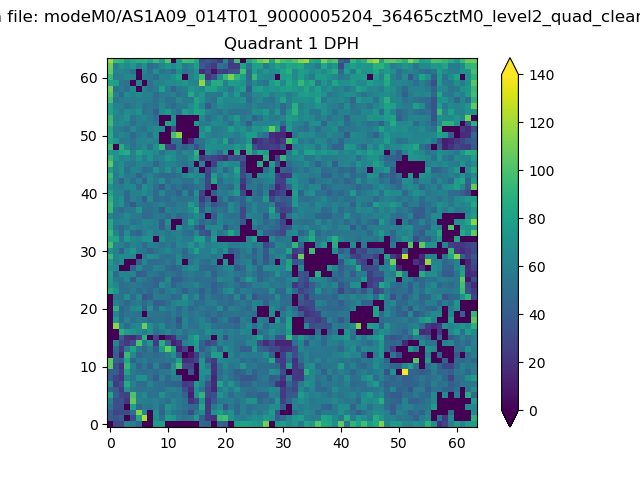 |
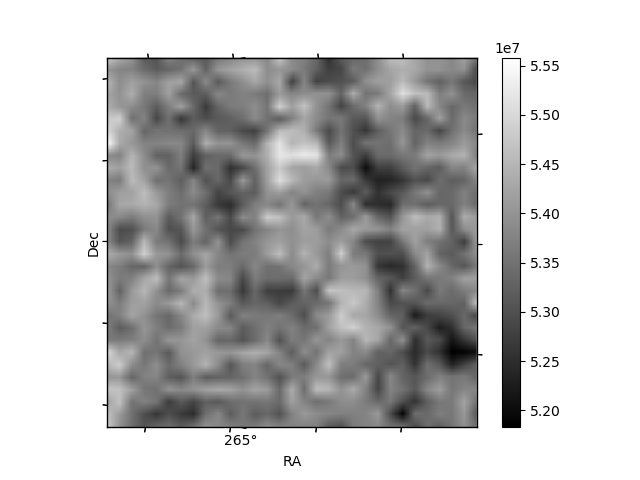
Quadrant B |
|---|---|---|---|
| Quadrant D | 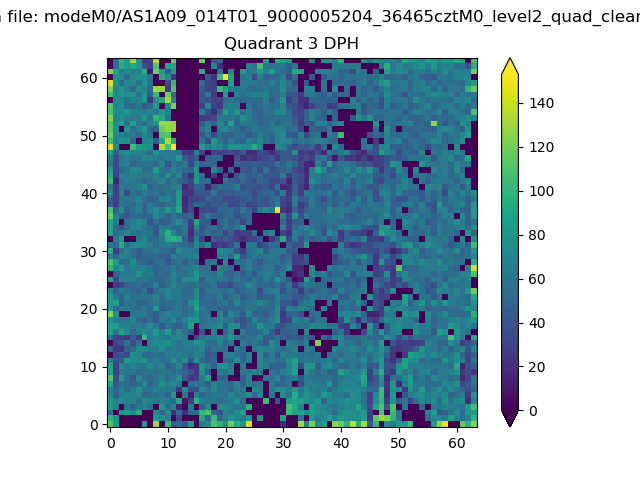 |
 |
Quadrant C |
| Plot type | Count rate plots | Images |
|---|---|---|
| Comparison with Poisson distribution Blue bars denote a histogram of data divided into 1 sec bins. Red curve is a Poisson curve with rate = median count rate of data. |
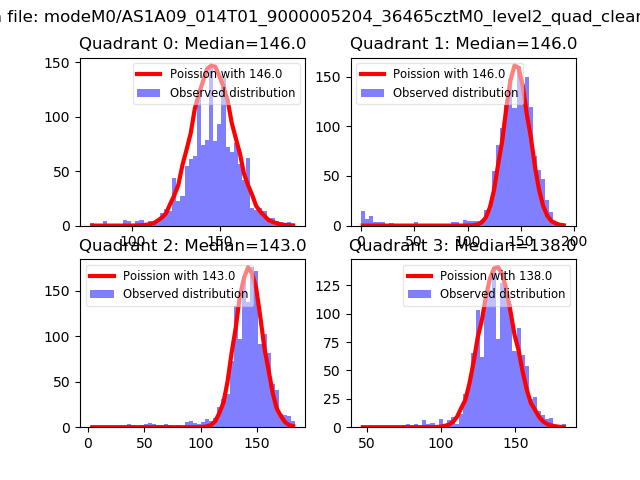 |
 |
| Quadrant-wise count rates Data is divided into 100 sec bins |
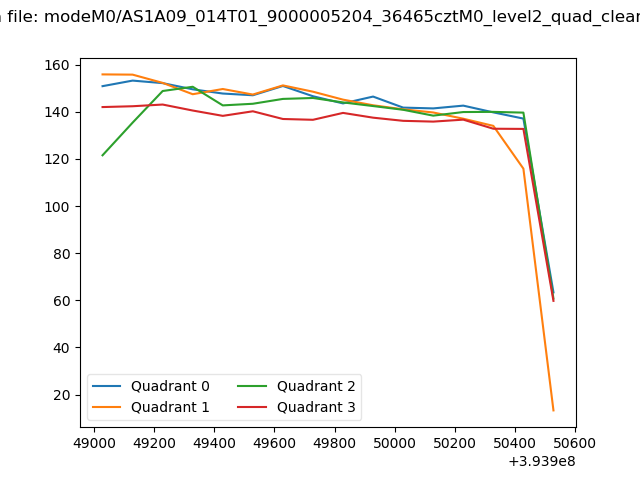 |
|
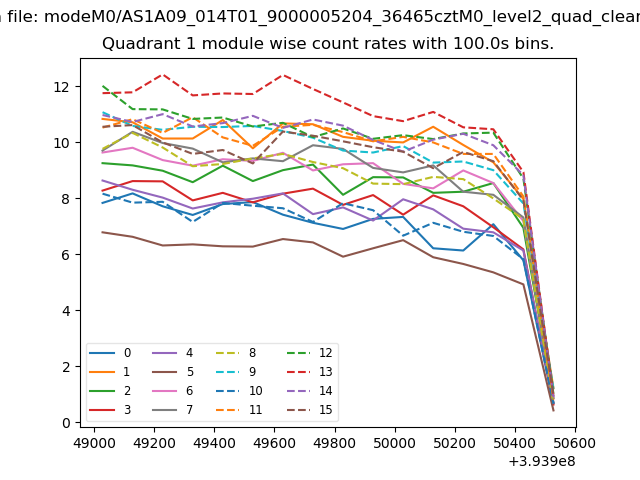
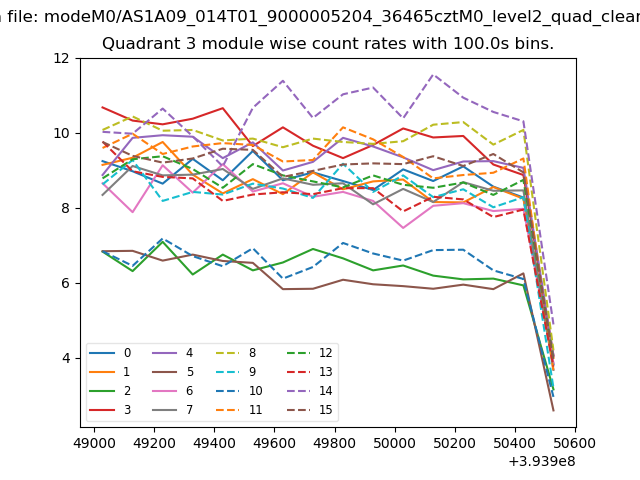
| Module-wise count rates for Quadrant A Data is divided into 100 sec bins |
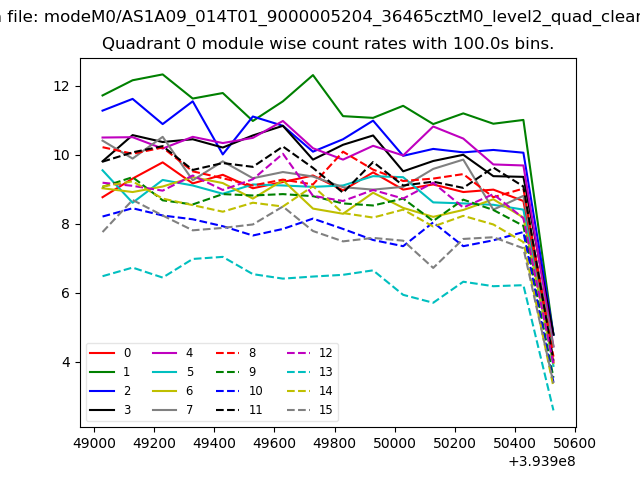 |
 |
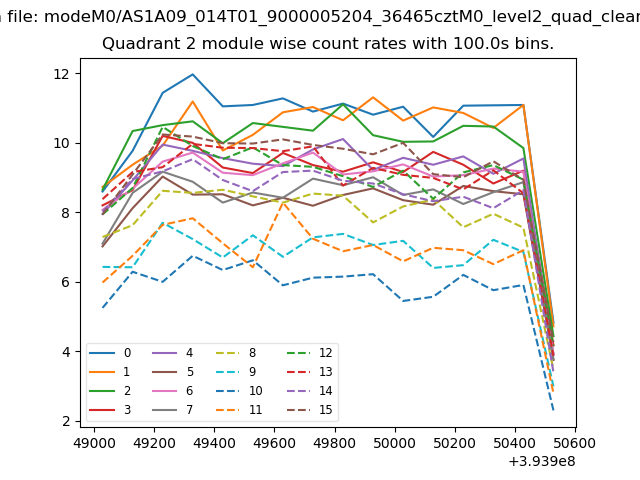
| Module-wise count rates for Quadrant B Data is divided into 100 sec bins |
 |
 |
| Module-wise count rates for Quadrant C Data is divided into 100 sec bins |
 |
 |
| Module-wise count rates for Quadrant D Data is divided into 100 sec bins |
 |
 |
| Parameter | Plot |
|---|---|
| CZT HV Monitor | 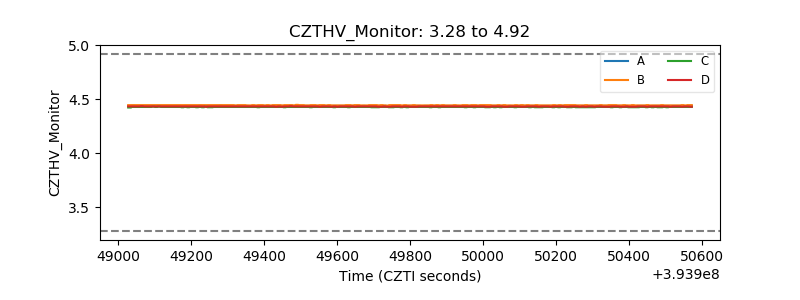 |
| D_VDD | 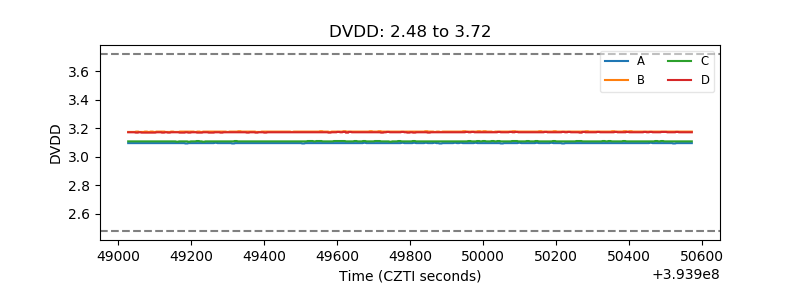 |
| Temperature 1 | 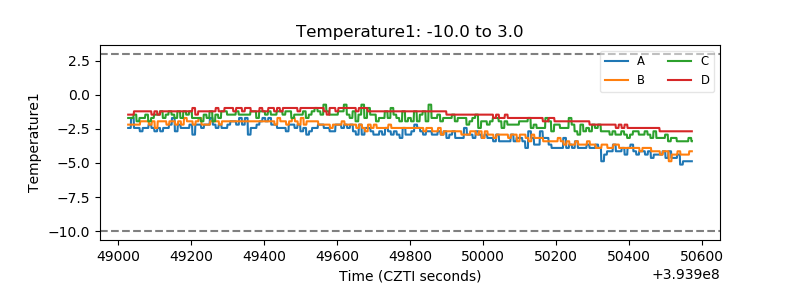 |
| Veto HV Monitor | 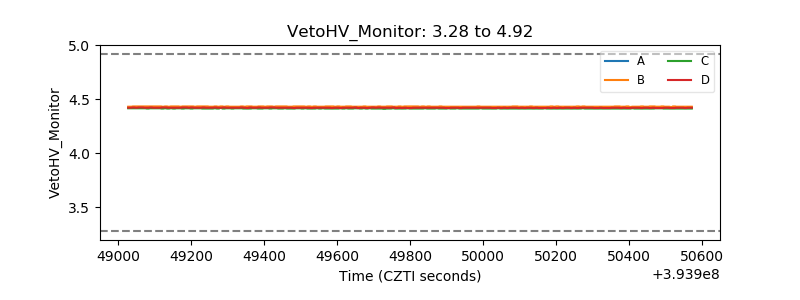 |
| Veto LLD | 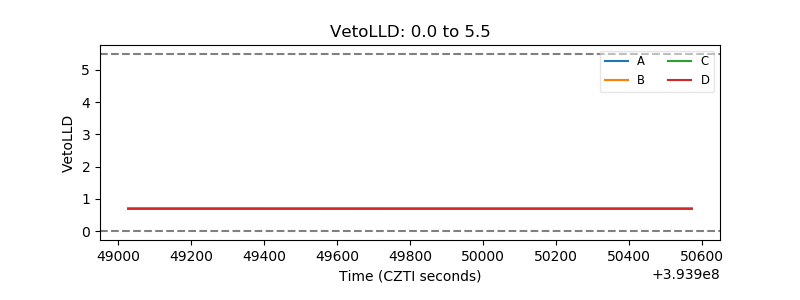 |
| Alpha Counter | 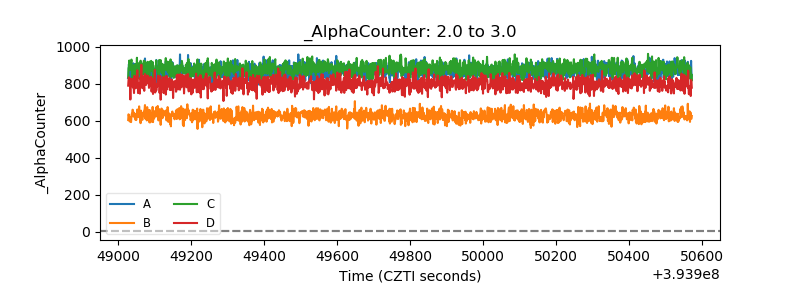 |
| _CPM_Rate | 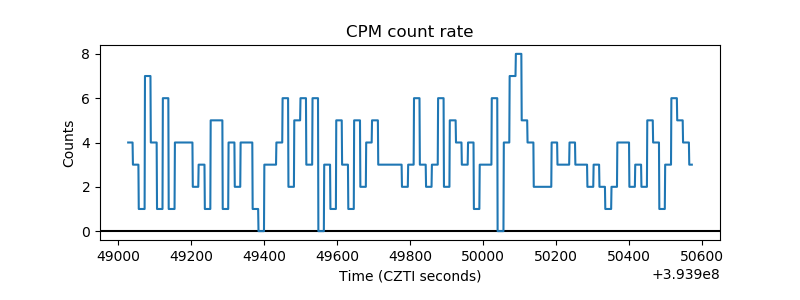 |
| CZT Counter | 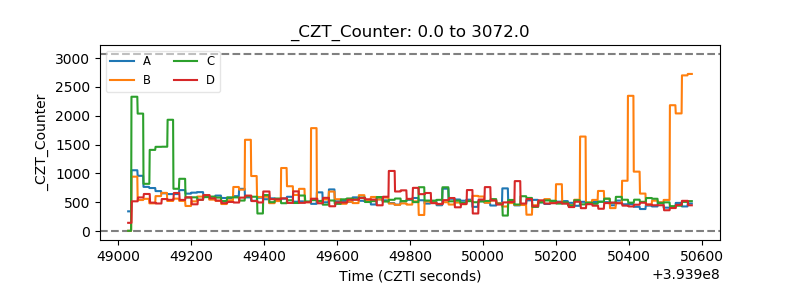 |
| +2.5 Volts monitor | 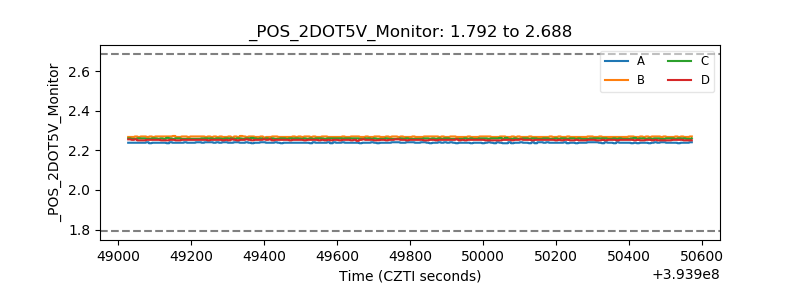 |
| +5 Volts monitor | 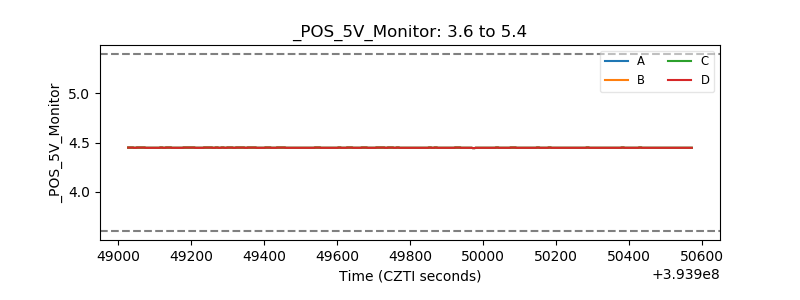 |
| _ROLL_ROT | 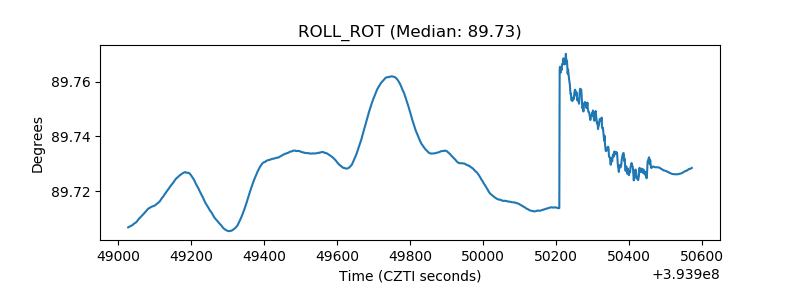 |
| _Roll_DEC | 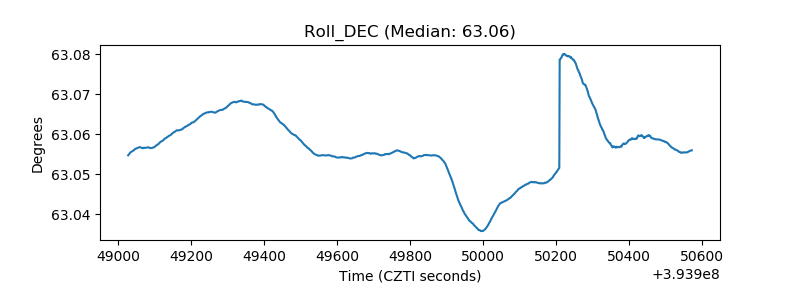 |
| _Roll_RA | 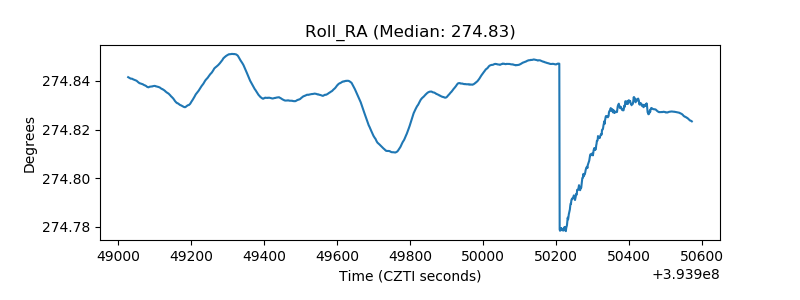 |
| Veto Counter | 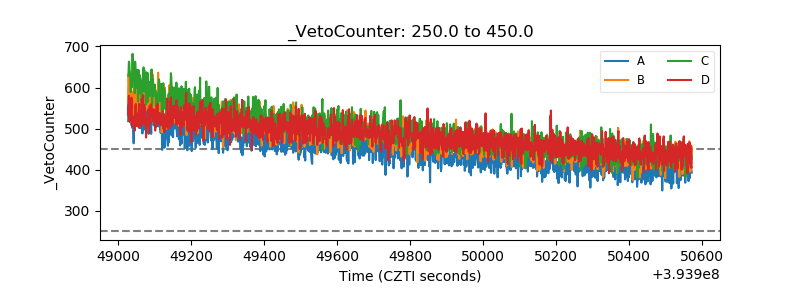 |