| Param | Original file | Final file |
|---|---|---|
| Filename | modeM0/AS1A09_014T01_9000005204_36462cztM0_level2.evt | modeM0/AS1A09_014T01_9000005204_36462cztM0_level2_quad_clean.evt |
| Size (bytes) | 119,171,520 | 17,645,760 |
| Size | 113.7 MB | 16.8 MB |
| Events in quadrant A | 830,696 | 109,359 |
| Events in quadrant B | 939,772 | 108,552 |
| Events in quadrant C | 888,591 | 106,222 |
| Events in quadrant D | 849,081 | 102,071 |
| Mode M9 | |||
|---|---|---|---|
| Quadrant | BADHDUFLAG | Total packets | Discarded packets |
| A | 0 | 19 | 0 |
| B | 0 | 19 | 0 |
| C | 0 | 19 | 0 |
| D | 0 | 19 | 0 |
| Mode SS | |||
|---|---|---|---|
| Quadrant | BADHDUFLAG | Total packets | Discarded packets |
| A | 0 | 32 | 0 |
| B | 0 | 32 | 0 |
| C | 0 | 32 | 0 |
| D | 0 | 32 | 0 |
| Mode M0 | |||
|---|---|---|---|
| Quadrant | BADHDUFLAG | Total packets | Discarded packets |
| A | 0 | 3351 | 2 |
| B | 0 | 3714 | 1 |
| C | 0 | 3441 | 1 |
| D | 0 | 3412 | 1 |
| Quadrant | Total seconds | Saturated seconds | Saturation percentage |
|---|---|---|---|
| A | 1442 | 7 | 0.485437% |
| B | 1442 | 17 | 1.178918% |
| C | 1442 | 39 | 2.704577% |
| D | 1442 | 11 | 0.762829% |
Noise dominated data is calculated using 1-second bins in cleaned event files. If a bin has >2000 counts, and if more than 50% of those come from <1% of pixels, then it is considered to be noise-dominated and hence unusable.
| Quadrant | # 1 sec bins | Bins with >0 counts | Bins with >2000 counts | High rate bins dominated by noise | Noise dominated (total time) | Noise dominated (detector-on time) | Marked lightcurve |
|---|---|---|---|---|---|---|---|
| A | 3385 | 1443 | 2 | 2 | 0.06% | 0.14% | 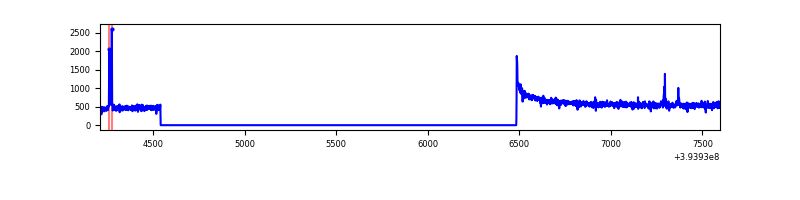 |
| B | 3385 | 1443 | 10 | 10 | 0.30% | 0.69% | 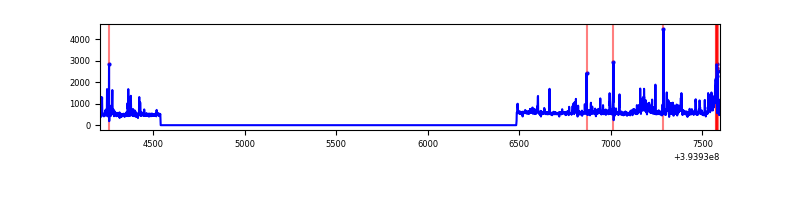 |
| C | 3385 | 1443 | 21 | 21 | 0.62% | 1.46% | 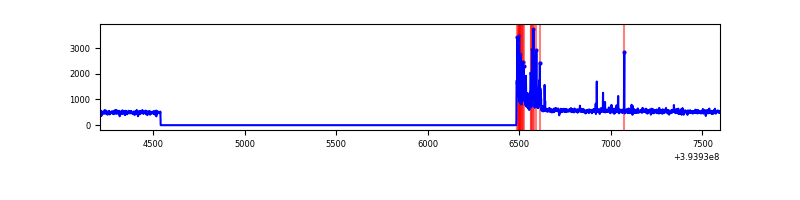 |
| D | 3385 | 1443 | 6 | 6 | 0.18% | 0.42% | 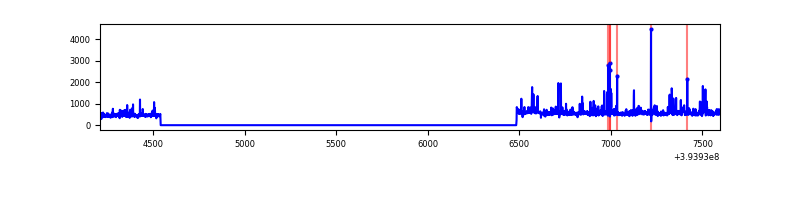 |
Top three noisy pixels from each quadrant. If the there are fewer than three noisy pixels in the level2.evt file, extra rows are filled as -1
| Pixel properties | Quadrant properties | ||||||
|---|---|---|---|---|---|---|---|
| Quadrant | DetID | PixID | Counts | Sigma | Mean | Median | Sigma |
| A | 10 | 83 | 74842 | 1899.13 | 189 | 187 | 39.3 |
| A | 7 | 3 | 13271 | 332.84 | 189 | 187 | 39.3 |
| A | 9 | 143 | 6352 | 156.83 | 189 | 187 | 39.3 |
| B | 5 | 172 | 102502 | 2816.42 | 185 | 181 | 36.3 |
| B | 0 | 213 | 28326 | 774.7 | 185 | 181 | 36.3 |
| B | 5 | 255 | 21401 | 584.09 | 185 | 181 | 36.3 |
| C | 0 | 10 | 127005 | 3022.22 | 177 | 178 | 42.0 |
| C | 15 | 214 | 69680 | 1656.2 | 177 | 178 | 42.0 |
| C | 0 | 207 | 2030 | 44.13 | 177 | 178 | 42.0 |
| D | 2 | 250 | 42854 | 951.8 | 180 | 175 | 44.8 |
| D | 2 | 137 | 22046 | 487.75 | 180 | 175 | 44.8 |
| D | 13 | 249 | 17589 | 388.36 | 180 | 175 | 44.8 |
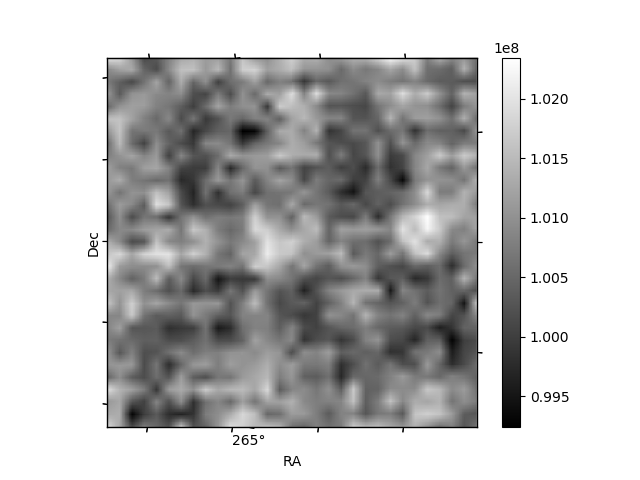
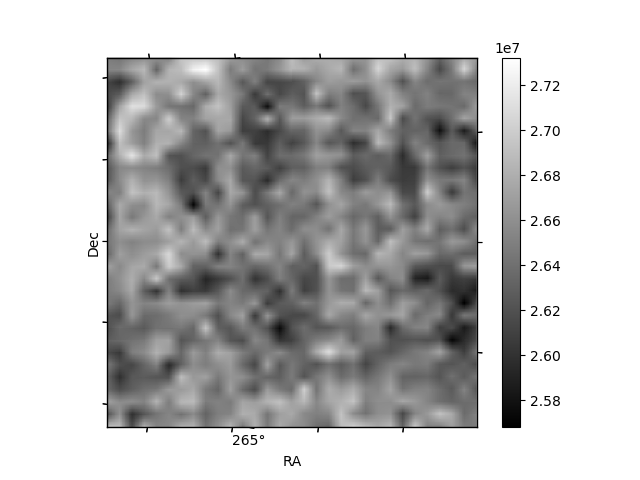
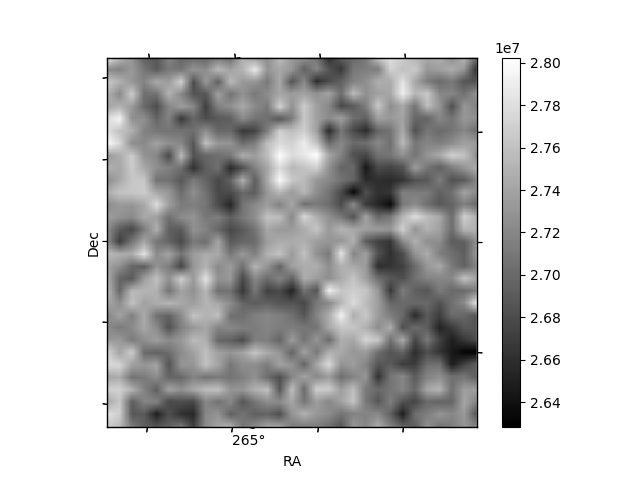
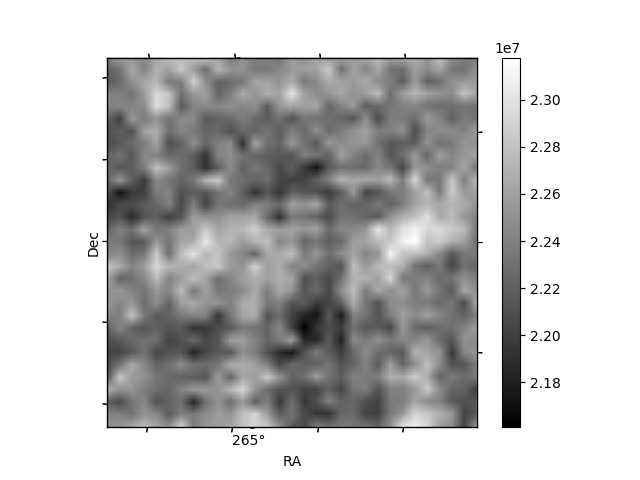
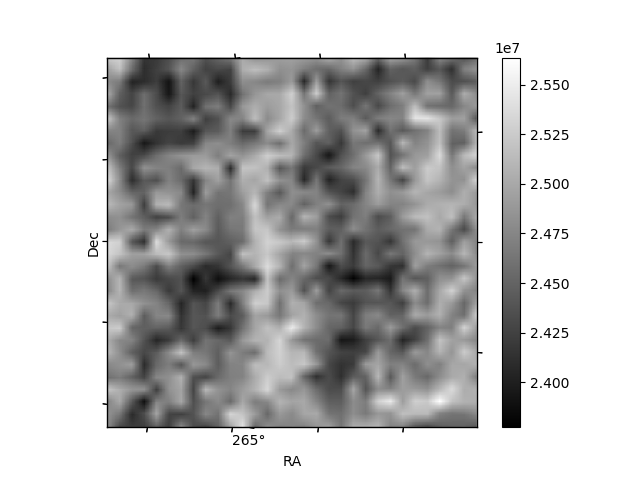
Histogram calculated using DETX and DETY for each event in the final _common_clean file
| Quadrant A | 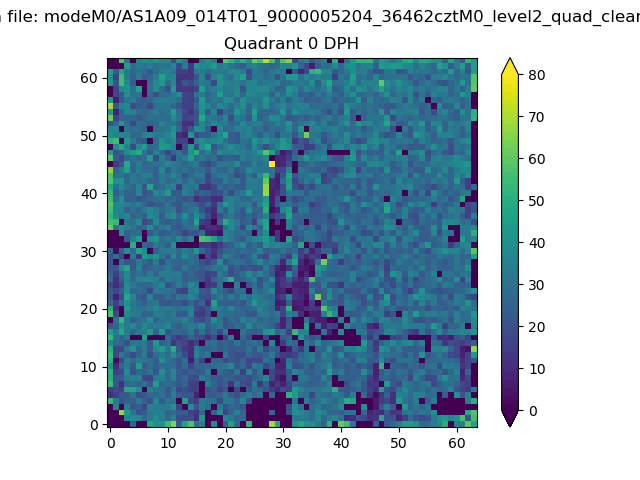 |
 |
Quadrant B |
|---|---|---|---|
| Quadrant D | 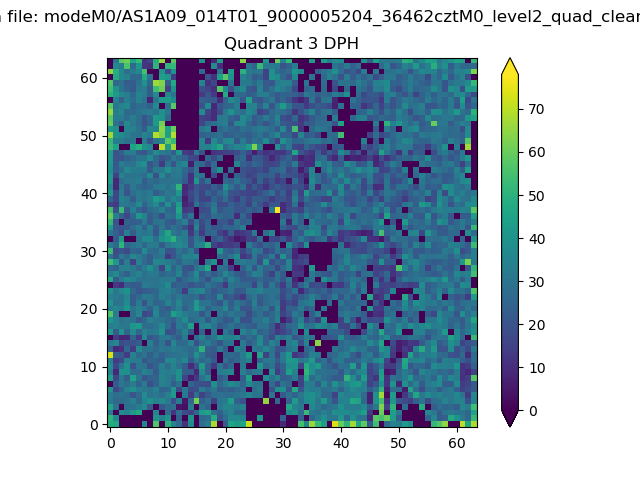 |
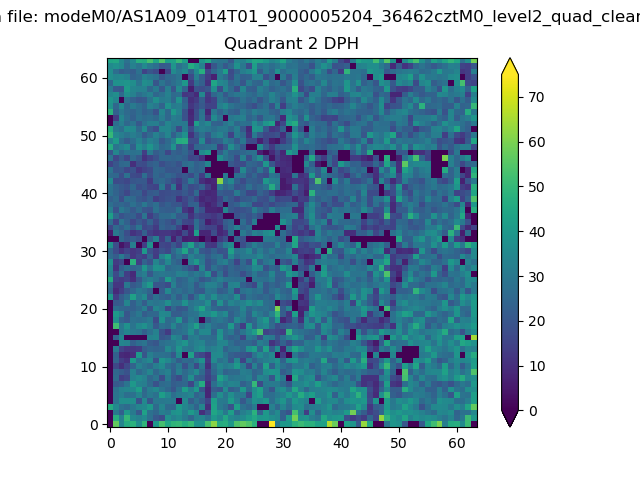 |
Quadrant C |
| Plot type | Count rate plots | Images |
|---|---|---|
| Comparison with Poisson distribution Blue bars denote a histogram of data divided into 1 sec bins. Red curve is a Poisson curve with rate = median count rate of data. |
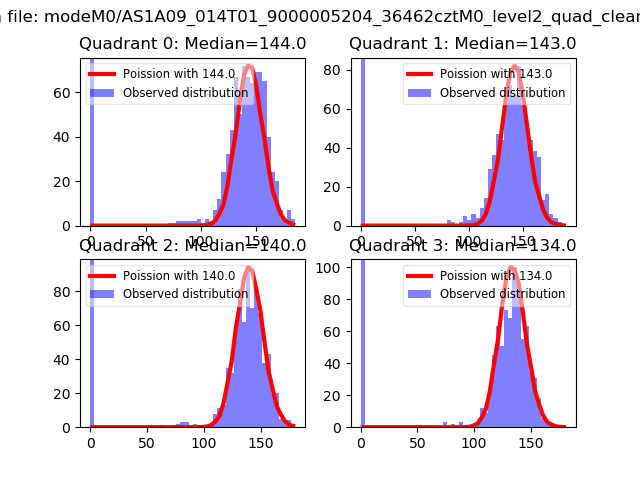 |
 |
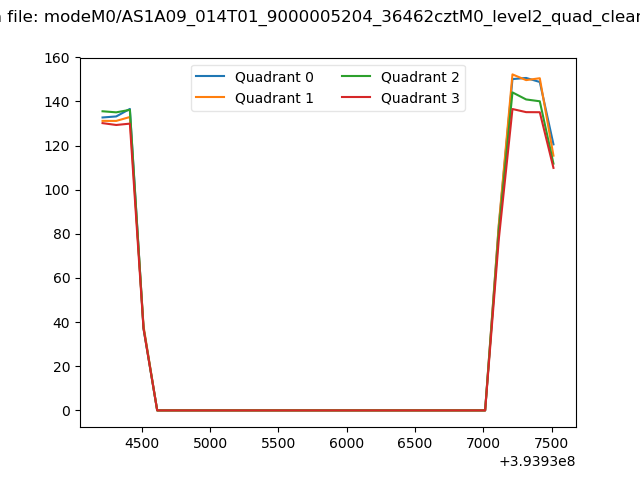
| Quadrant-wise count rates Data is divided into 100 sec bins |
 |
|
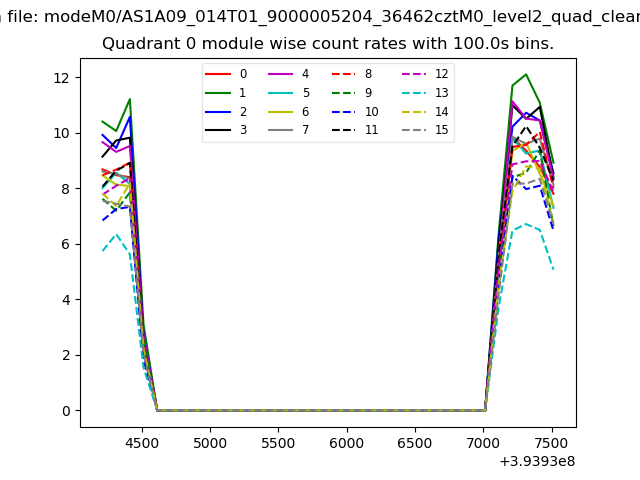
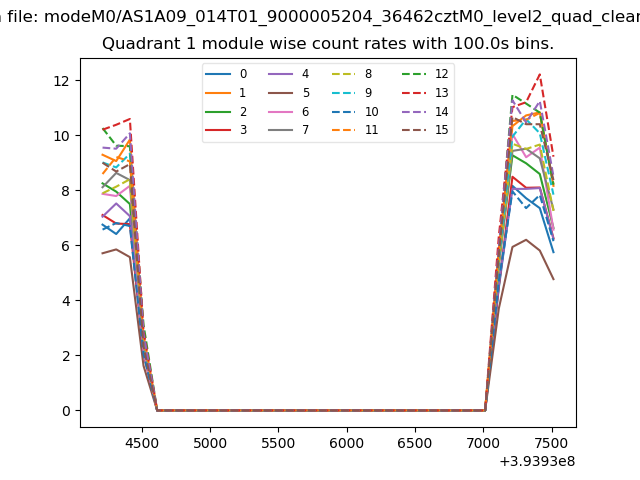
| Module-wise count rates for Quadrant A Data is divided into 100 sec bins |
 |
 |
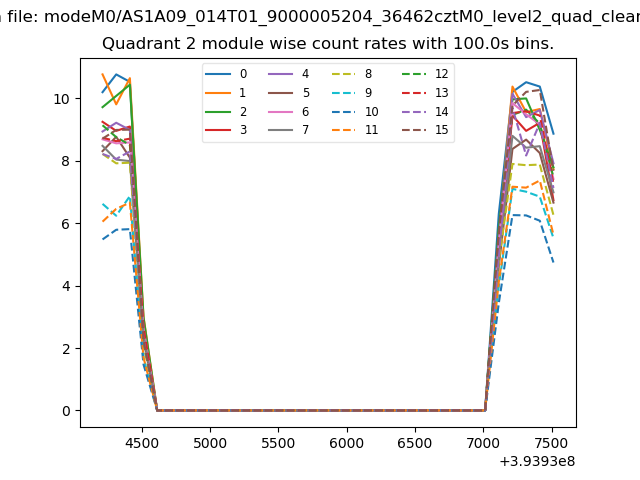
| Module-wise count rates for Quadrant B Data is divided into 100 sec bins |
 |
 |
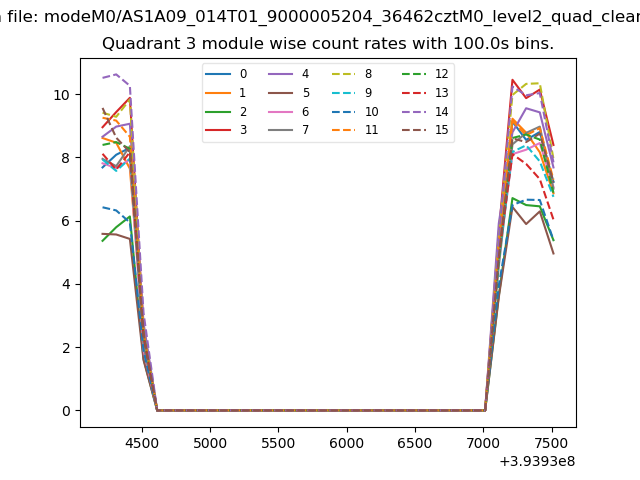
| Module-wise count rates for Quadrant C Data is divided into 100 sec bins |
 |
 |
| Module-wise count rates for Quadrant D Data is divided into 100 sec bins |
 |
 |
| Parameter | Plot |
|---|---|
| CZT HV Monitor | 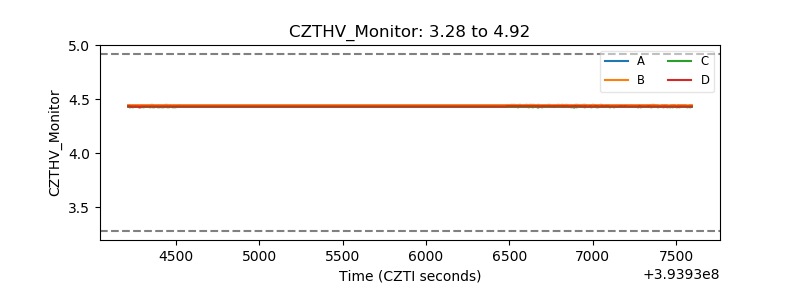 |
| D_VDD | 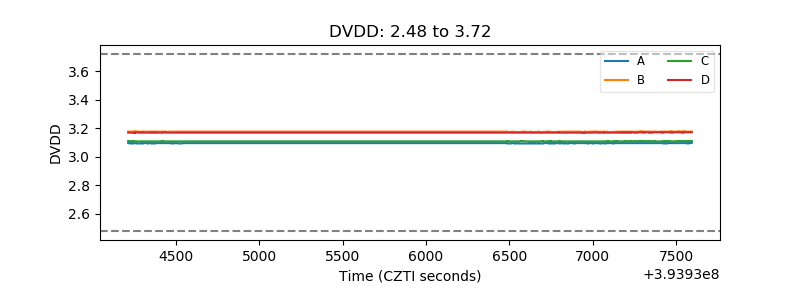 |
| Temperature 1 | 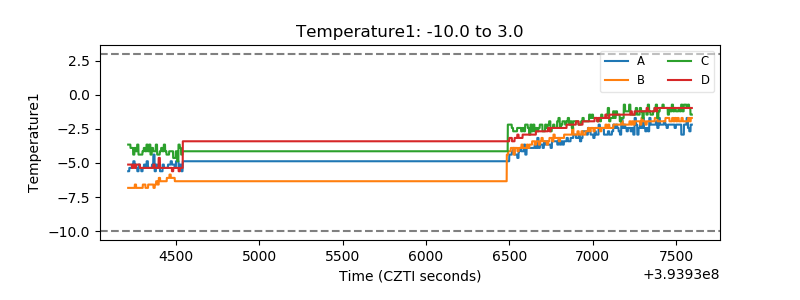 |
| Veto HV Monitor | 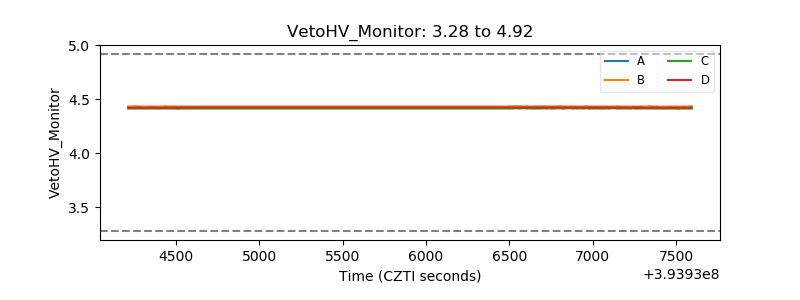 |
| Veto LLD | 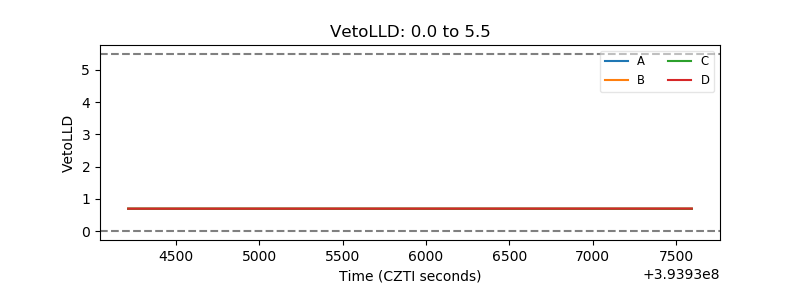 |
| Alpha Counter | 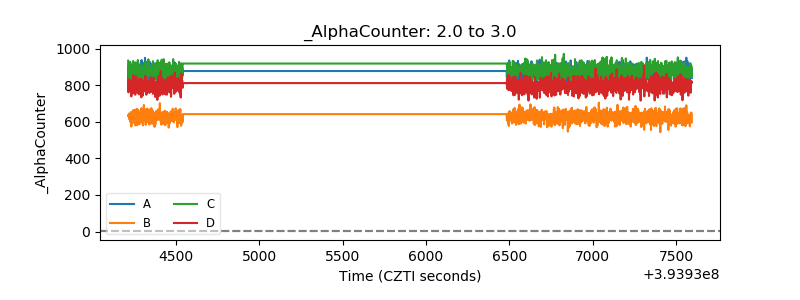 |
| _CPM_Rate | 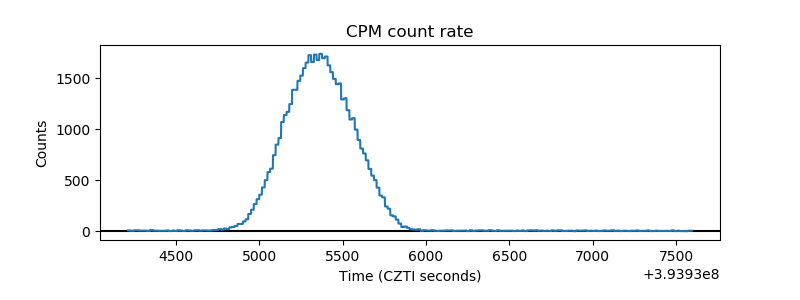 |
| CZT Counter | 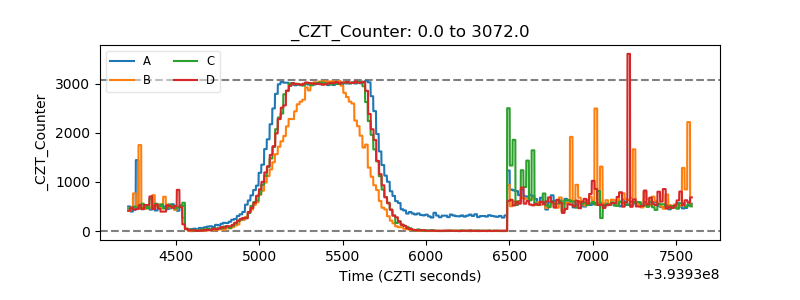 |
| +2.5 Volts monitor | 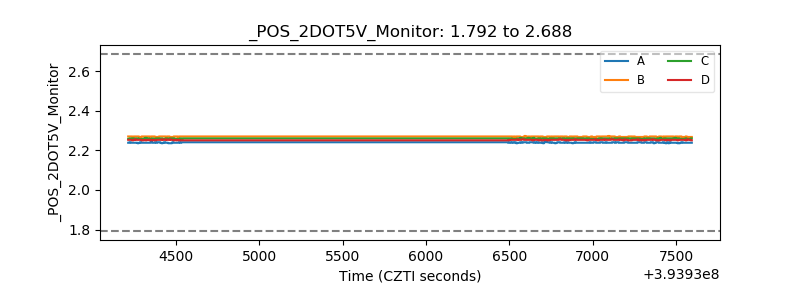 |
| +5 Volts monitor | 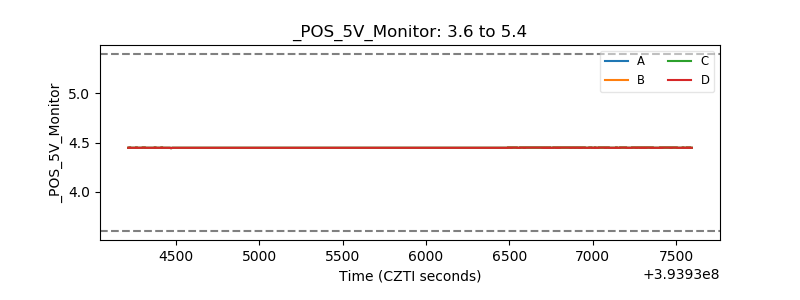 |
| _ROLL_ROT | 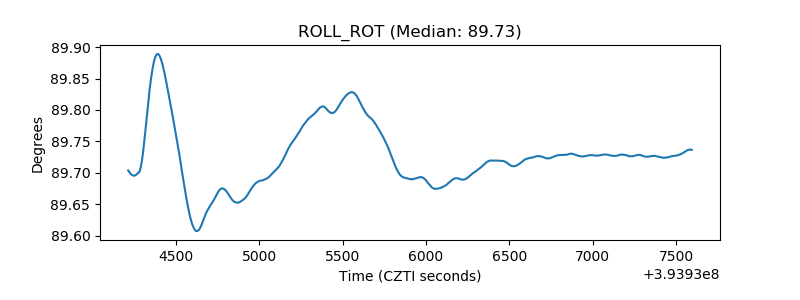 |
| _Roll_DEC | 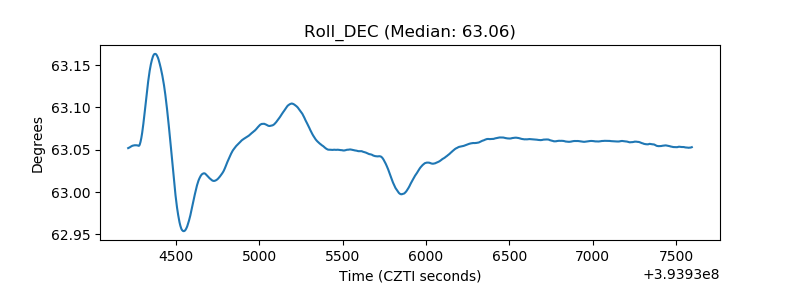 |
| _Roll_RA | 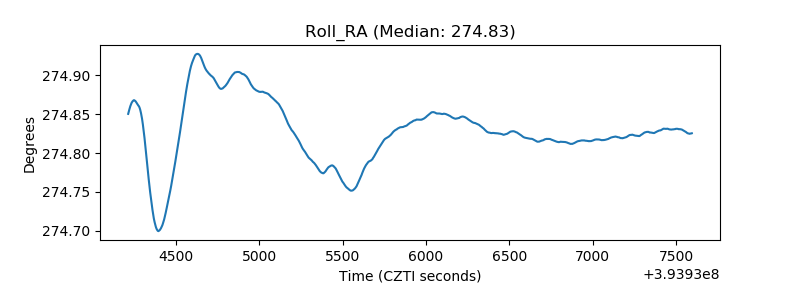 |
| Veto Counter | 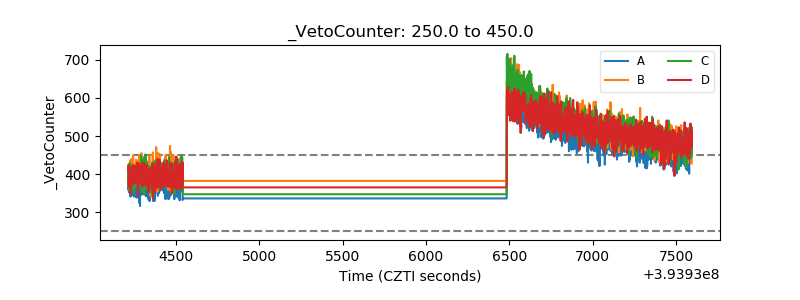 |