| Param | Original file | Final file |
|---|---|---|
| Filename | modeM0/AS1A11_003T08_9000005202_36462cztM0_level2.evt | modeM0/AS1A11_003T08_9000005202_36462cztM0_level2_quad_clean.evt |
| Size (bytes) | 242,521,920 | 52,485,120 |
| Size | 231.3 MB | 50.1 MB |
| Events in quadrant A | 1,595,427 | 354,996 |
| Events in quadrant B | 2,138,609 | 348,553 |
| Events in quadrant C | 1,636,084 | 346,463 |
| Events in quadrant D | 1,774,472 | 330,700 |
| Mode SS | |||
|---|---|---|---|
| Quadrant | BADHDUFLAG | Total packets | Discarded packets |
| A | 0 | 60 | 0 |
| B | 0 | 60 | 0 |
| C | 0 | 60 | 0 |
| D | 0 | 60 | 0 |
| Mode M9 | |||
|---|---|---|---|
| Quadrant | BADHDUFLAG | Total packets | Discarded packets |
| A | 0 | 2 | 0 |
| B | 0 | 2 | 0 |
| C | 0 | 2 | 0 |
| D | 0 | 3 | 0 |
| Mode M0 | |||
|---|---|---|---|
| Quadrant | BADHDUFLAG | Total packets | Discarded packets |
| A | 0 | 6437 | 1 |
| B | 0 | 8183 | 1 |
| C | 0 | 6536 | 1 |
| D | 0 | 7070 | 1 |
| Quadrant | Total seconds | Saturated seconds | Saturation percentage |
|---|---|---|---|
| A | 2918 | 13 | 0.445511% |
| B | 2918 | 258 | 8.841672% |
| C | 2918 | 54 | 1.850583% |
| D | 2918 | 29 | 0.993831% |
Noise dominated data is calculated using 1-second bins in cleaned event files. If a bin has >2000 counts, and if more than 50% of those come from <1% of pixels, then it is considered to be noise-dominated and hence unusable.
| Quadrant | # 1 sec bins | Bins with >0 counts | Bins with >2000 counts | High rate bins dominated by noise | Noise dominated (total time) | Noise dominated (detector-on time) | Marked lightcurve |
|---|---|---|---|---|---|---|---|
| A | 2918 | 2918 | 7 | 7 | 0.24% | 0.24% | 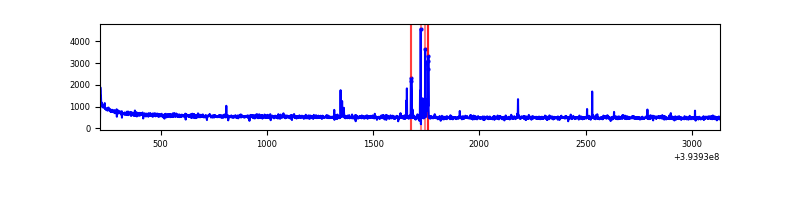 |
| B | 2918 | 2918 | 166 | 166 | 5.69% | 5.69% | 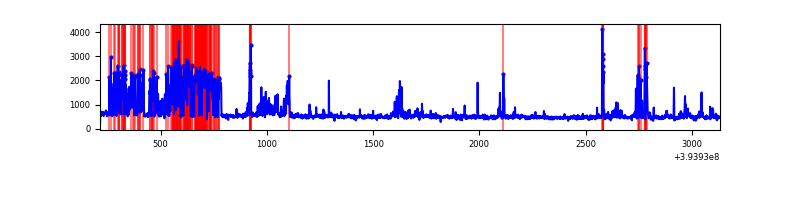 |
| C | 2918 | 2918 | 23 | 23 | 0.79% | 0.79% | 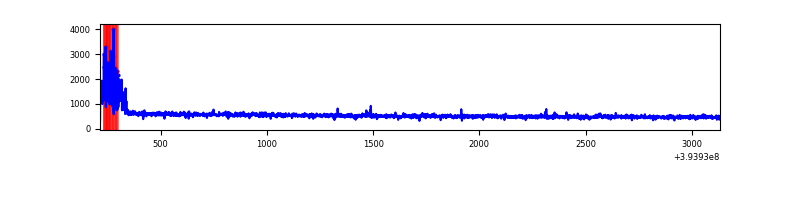 |
| D | 2918 | 2918 | 17 | 17 | 0.58% | 0.58% | 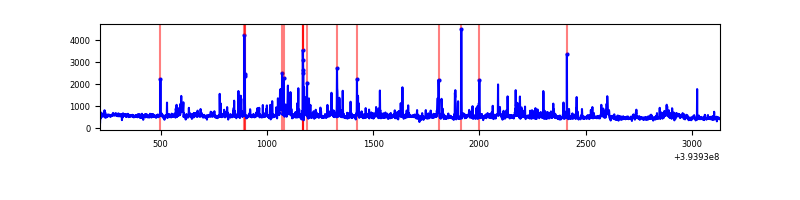 |
Top three noisy pixels from each quadrant. If the there are fewer than three noisy pixels in the level2.evt file, extra rows are filled as -1
| Pixel properties | Quadrant properties | ||||||
|---|---|---|---|---|---|---|---|
| Quadrant | DetID | PixID | Counts | Sigma | Mean | Median | Sigma |
| A | 10 | 83 | 106243 | 1424.12 | 369 | 363 | 74.3 |
| A | 9 | 143 | 45273 | 604.05 | 369 | 363 | 74.3 |
| A | 7 | 191 | 6402 | 81.23 | 369 | 363 | 74.3 |
| B | 0 | 182 | 506056 | 7436.42 | 351 | 343 | 68.0 |
| B | 5 | 172 | 158716 | 2328.85 | 351 | 343 | 68.0 |
| B | 15 | 85 | 30591 | 444.79 | 351 | 343 | 68.0 |
| C | 15 | 214 | 135152 | 1645.65 | 349 | 353 | 81.9 |
| C | 0 | 10 | 133218 | 1622.04 | 349 | 353 | 81.9 |
| C | 13 | 61 | 2375 | 24.68 | 349 | 353 | 81.9 |
| D | 2 | 153 | 74558 | 847.65 | 357 | 349 | 87.5 |
| D | 2 | 120 | 55730 | 632.59 | 357 | 349 | 87.5 |
| D | 2 | 250 | 54991 | 624.15 | 357 | 349 | 87.5 |
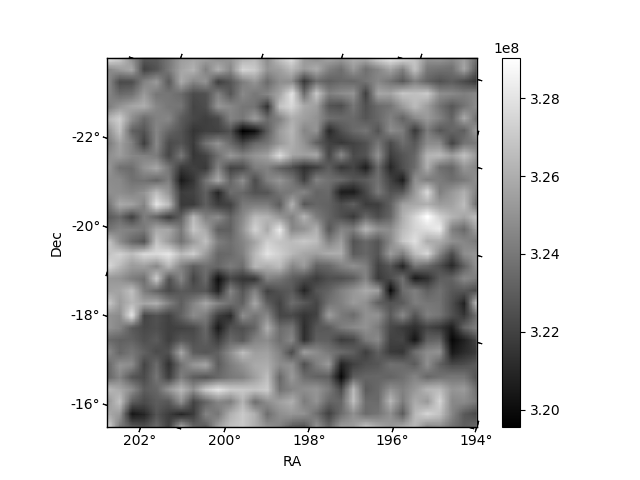
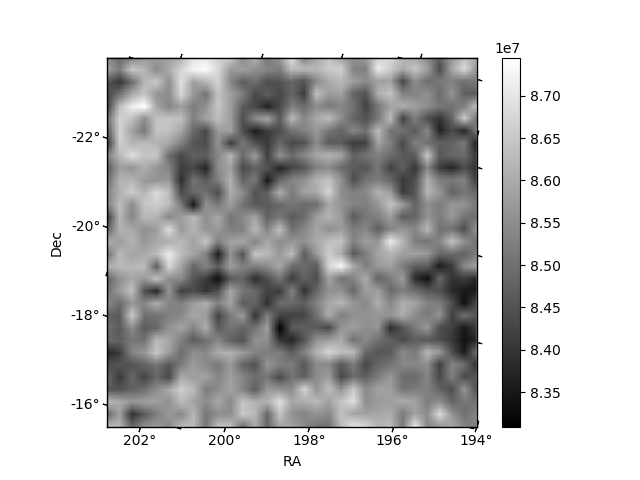
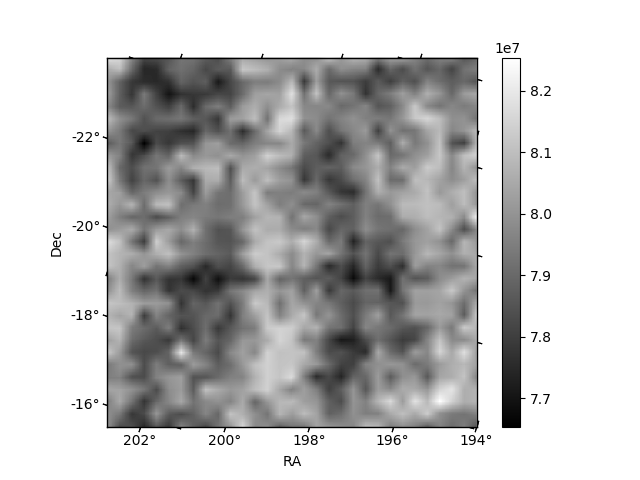
Histogram calculated using DETX and DETY for each event in the final _common_clean file
| Quadrant A | 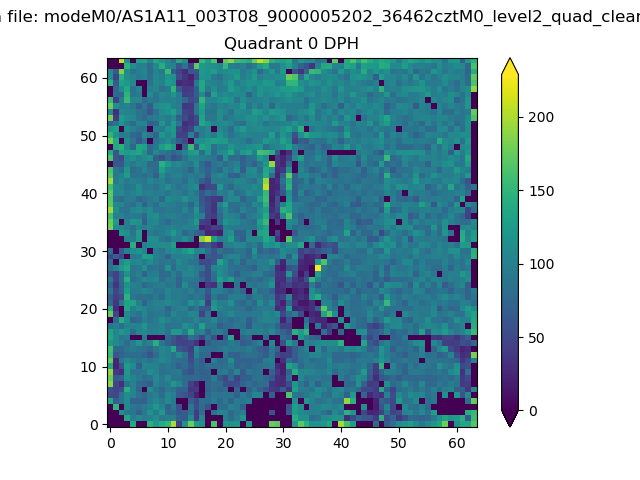 |
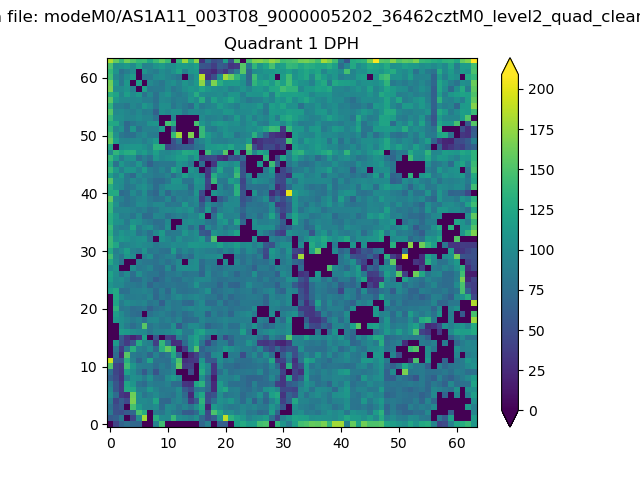 |
Quadrant B |
|---|---|---|---|
| Quadrant D |  |
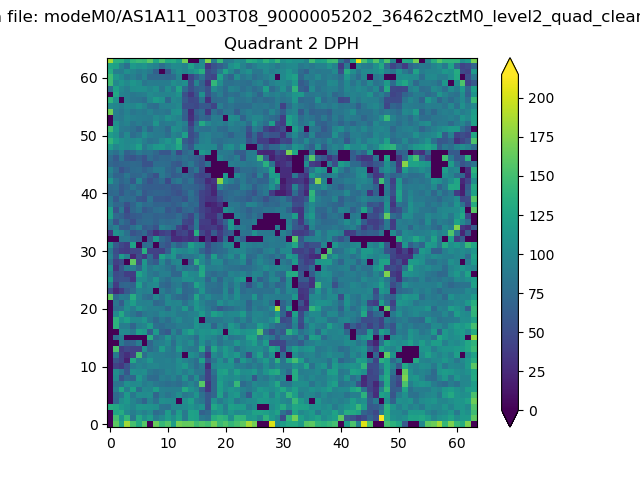 |
Quadrant C |
| Plot type | Count rate plots | Images |
|---|---|---|
| Comparison with Poisson distribution Blue bars denote a histogram of data divided into 1 sec bins. Red curve is a Poisson curve with rate = median count rate of data. |
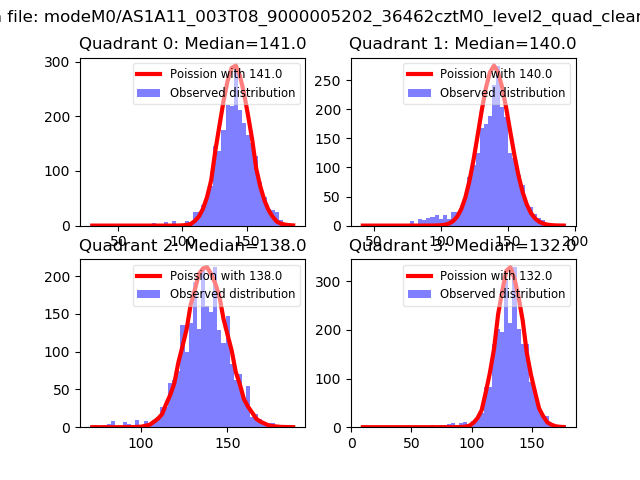 |
 |
| Quadrant-wise count rates Data is divided into 100 sec bins |
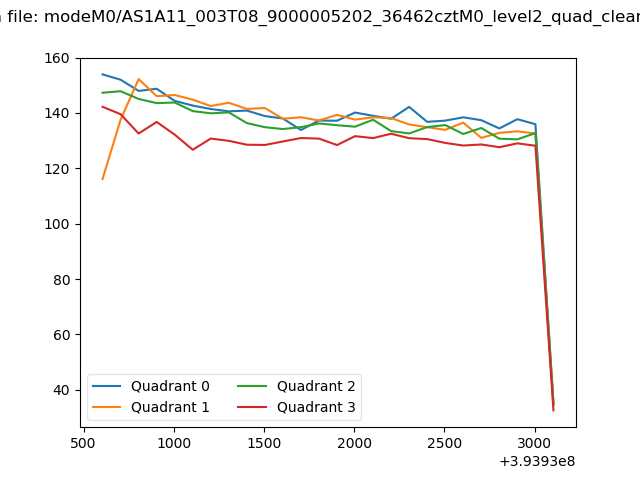 |
|
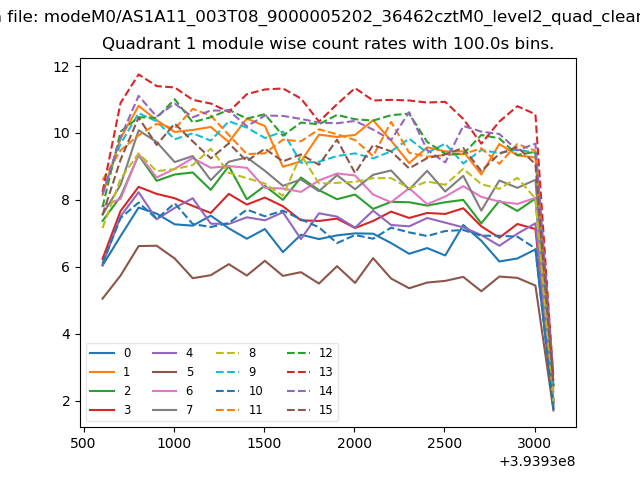
| Module-wise count rates for Quadrant A Data is divided into 100 sec bins |
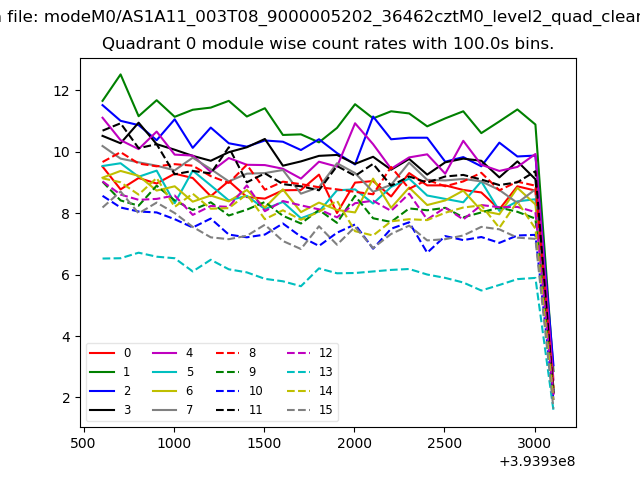 |
 |
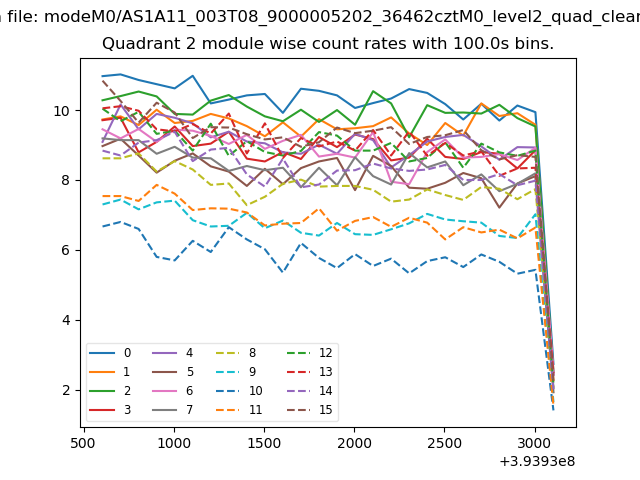
| Module-wise count rates for Quadrant B Data is divided into 100 sec bins |
 |
 |
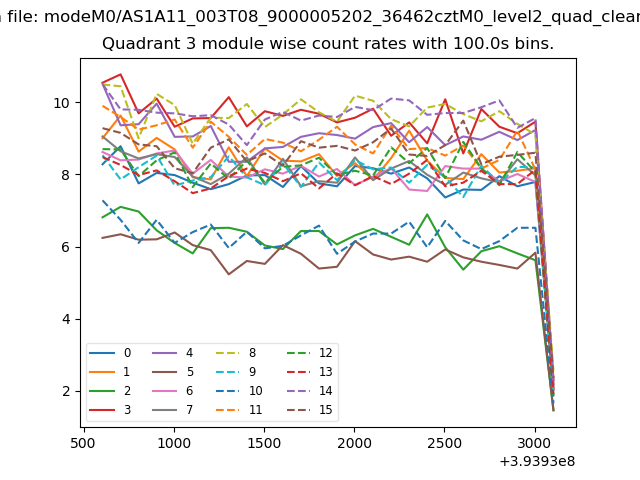
| Module-wise count rates for Quadrant C Data is divided into 100 sec bins |
 |
 |
| Module-wise count rates for Quadrant D Data is divided into 100 sec bins |
 |
 |
| Parameter | Plot |
|---|---|
| CZT HV Monitor | 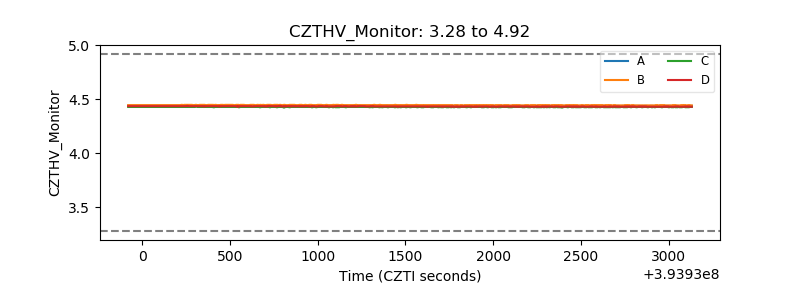 |
| D_VDD | 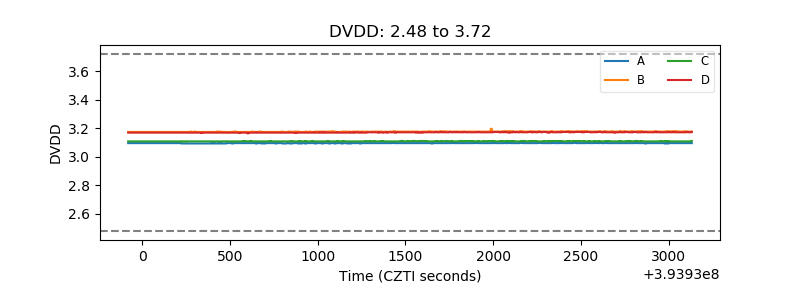 |
| Temperature 1 | 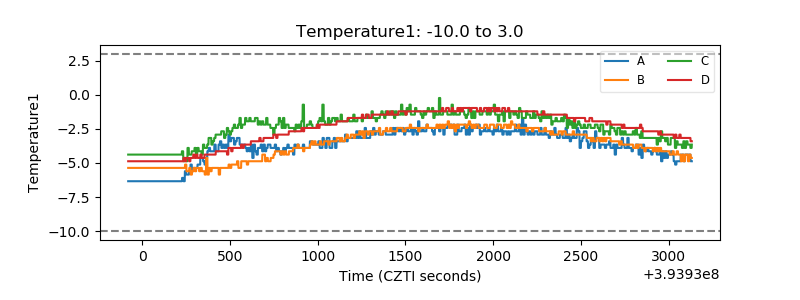 |
| Veto HV Monitor | 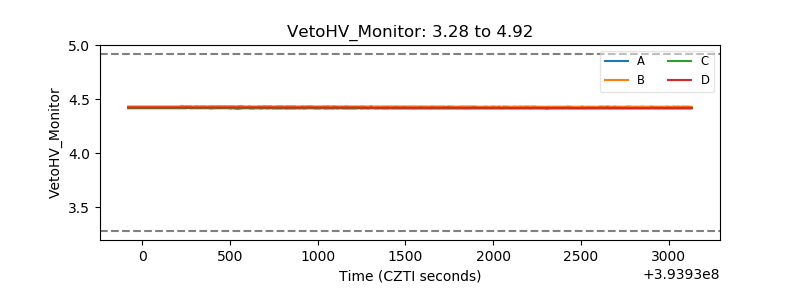 |
| Veto LLD | 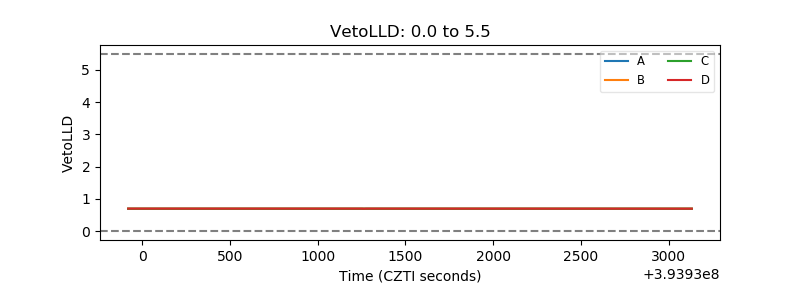 |
| Alpha Counter | 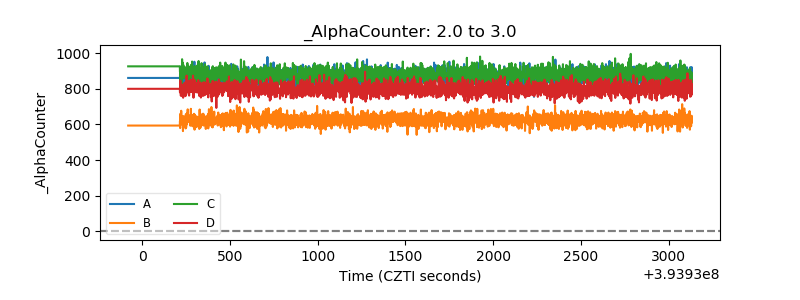 |
| _CPM_Rate | 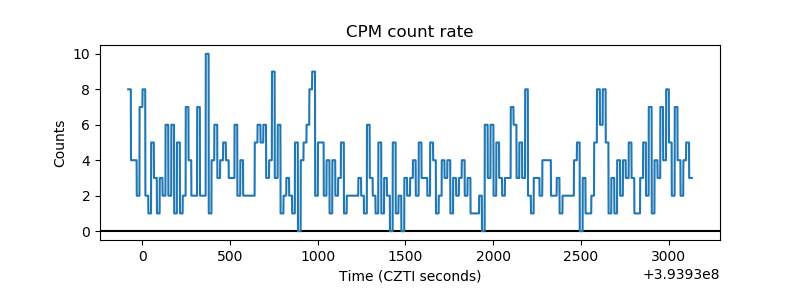 |
| CZT Counter | 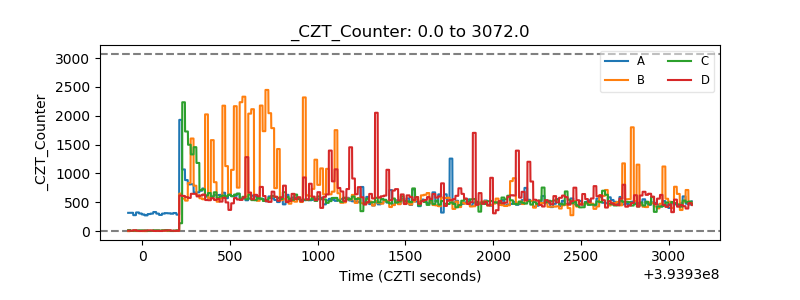 |
| +2.5 Volts monitor | 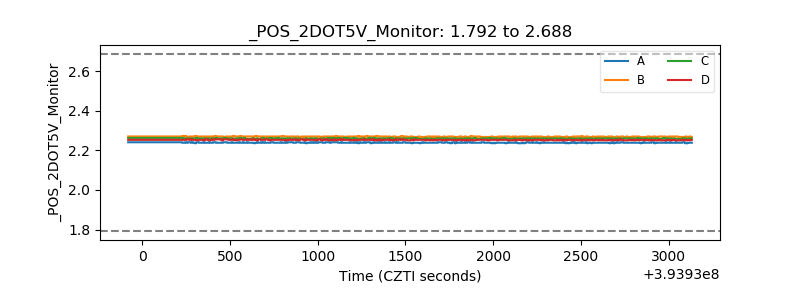 |
| +5 Volts monitor | 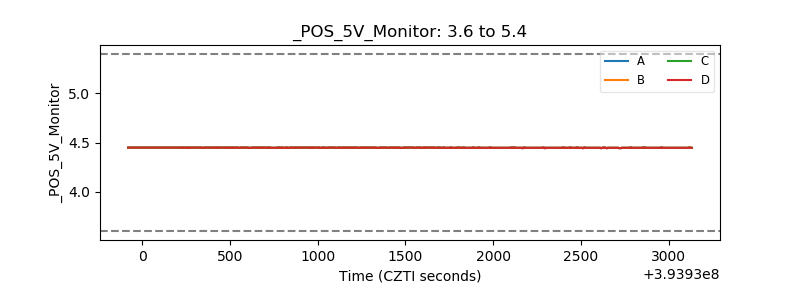 |
| _ROLL_ROT | 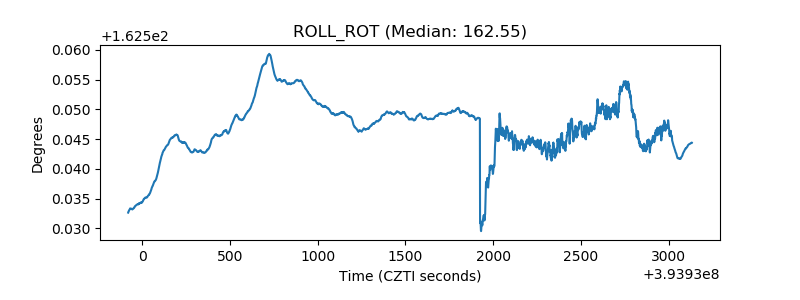 |
| _Roll_DEC | 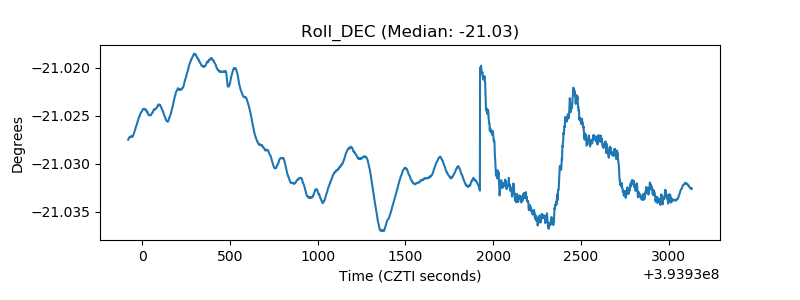 |
| _Roll_RA | 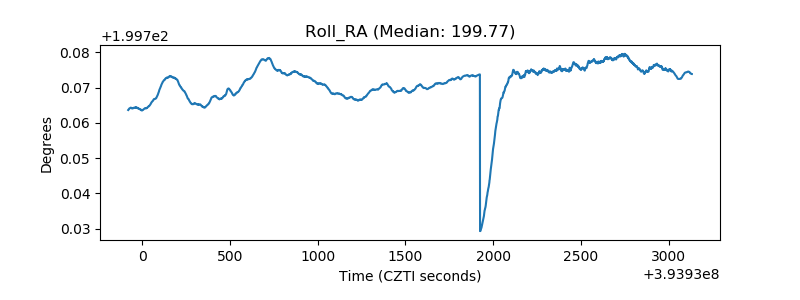 |
| Veto Counter | 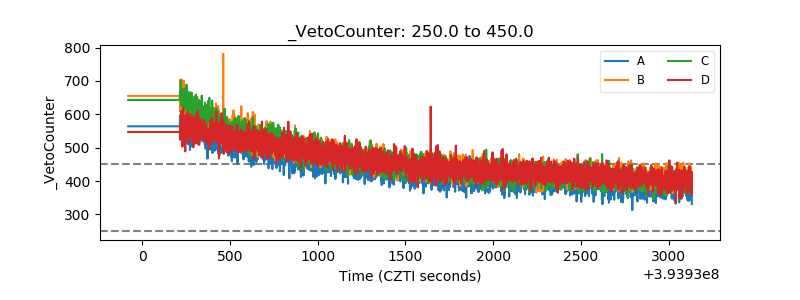 |