| Param | Original file | Final file |
|---|---|---|
| Filename | modeM0/AS1A11_003T08_9000005202_36459cztM0_level2.evt | modeM0/AS1A11_003T08_9000005202_36459cztM0_level2_quad_clean.evt |
| Size (bytes) | 430,303,680 | 76,890,240 |
| Size | 410.4 MB | 73.3 MB |
| Events in quadrant A | 2,926,128 | 488,127 |
| Events in quadrant B | 3,506,158 | 484,887 |
| Events in quadrant C | 3,093,051 | 479,282 |
| Events in quadrant D | 3,103,443 | 461,837 |
| Mode SS | |||
|---|---|---|---|
| Quadrant | BADHDUFLAG | Total packets | Discarded packets |
| A | 0 | 124 | 0 |
| B | 0 | 124 | 0 |
| C | 0 | 124 | 0 |
| D | 0 | 124 | 0 |
| Mode M9 | |||
|---|---|---|---|
| Quadrant | BADHDUFLAG | Total packets | Discarded packets |
| A | 0 | 32 | 0 |
| B | 0 | 32 | 0 |
| C | 0 | 32 | 0 |
| D | 0 | 32 | 0 |
| Mode M0 | |||
|---|---|---|---|
| Quadrant | BADHDUFLAG | Total packets | Discarded packets |
| A | 0 | 12316 | 3 |
| B | 0 | 14185 | 2 |
| C | 0 | 12621 | 2 |
| D | 0 | 13155 | 2 |
| Quadrant | Total seconds | Saturated seconds | Saturation percentage |
|---|---|---|---|
| A | 5924 | 18 | 0.303849% |
| B | 5924 | 173 | 2.920324% |
| C | 5924 | 65 | 1.097232% |
| D | 5924 | 61 | 1.029710% |
Noise dominated data is calculated using 1-second bins in cleaned event files. If a bin has >2000 counts, and if more than 50% of those come from <1% of pixels, then it is considered to be noise-dominated and hence unusable.
| Quadrant | # 1 sec bins | Bins with >0 counts | Bins with >2000 counts | High rate bins dominated by noise | Noise dominated (total time) | Noise dominated (detector-on time) | Marked lightcurve |
|---|---|---|---|---|---|---|---|
| A | 9177 | 5926 | 0 | 0 | 0.00% | 0.00% |  |
| B | 9177 | 5926 | 97 | 97 | 1.06% | 1.64% | 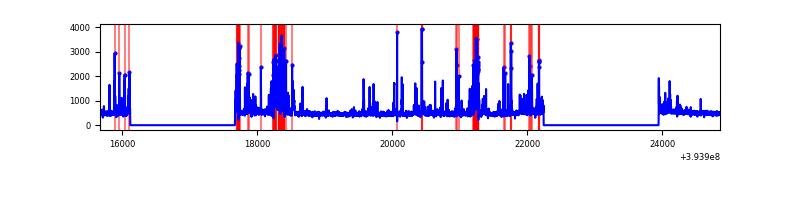 |
| C | 9177 | 5926 | 32 | 32 | 0.35% | 0.54% | 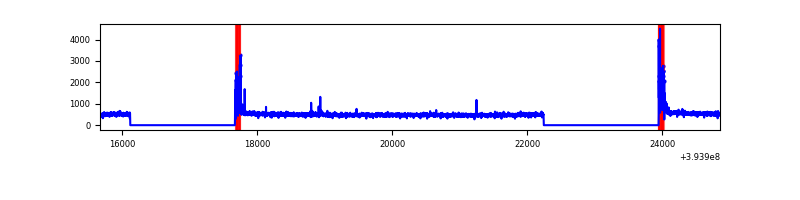 |
| D | 9177 | 5926 | 38 | 38 | 0.41% | 0.64% | 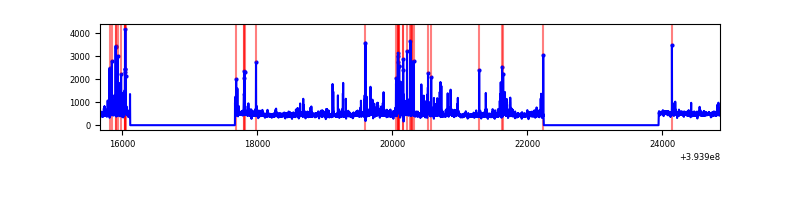 |
Top three noisy pixels from each quadrant. If the there are fewer than three noisy pixels in the level2.evt file, extra rows are filled as -1
| Pixel properties | Quadrant properties | ||||||
|---|---|---|---|---|---|---|---|
| Quadrant | DetID | PixID | Counts | Sigma | Mean | Median | Sigma |
| A | 10 | 83 | 207224 | 1471.97 | 699 | 686 | 140.3 |
| A | 13 | 254 | 9995 | 66.34 | 699 | 686 | 140.3 |
| A | 13 | 6 | 9655 | 63.92 | 699 | 686 | 140.3 |
| B | 5 | 172 | 571037 | 4327.85 | 685 | 668 | 131.8 |
| B | 5 | 255 | 106783 | 805.18 | 685 | 668 | 131.8 |
| B | 15 | 85 | 32010 | 237.82 | 685 | 668 | 131.8 |
| C | 15 | 214 | 275408 | 1751.65 | 671 | 675 | 156.8 |
| C | 0 | 10 | 186813 | 1186.78 | 671 | 675 | 156.8 |
| C | 0 | 207 | 5607 | 31.45 | 671 | 675 | 156.8 |
| D | 13 | 249 | 90132 | 541.76 | 675 | 658 | 165.2 |
| D | 10 | 199 | 84372 | 506.88 | 675 | 658 | 165.2 |
| D | 2 | 250 | 77858 | 467.44 | 675 | 658 | 165.2 |
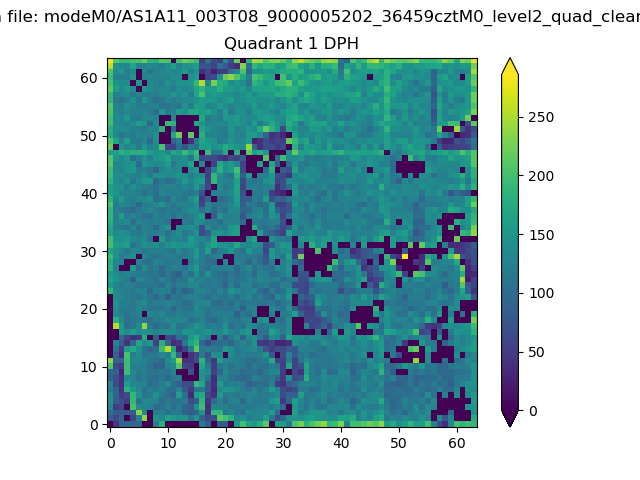
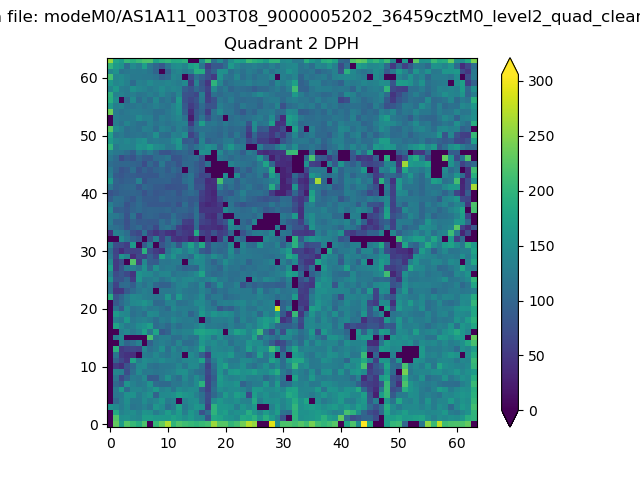
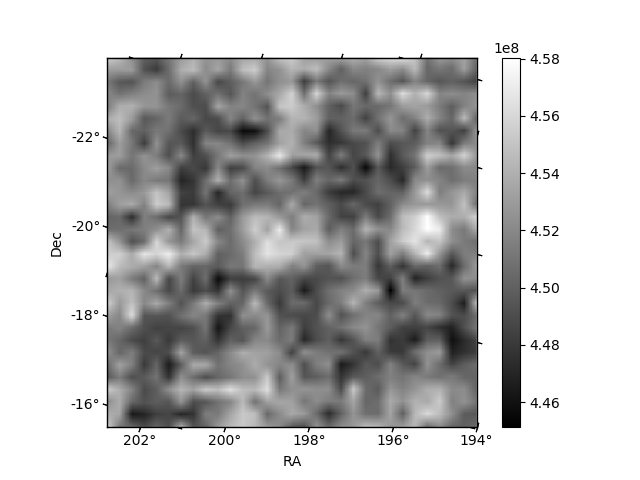
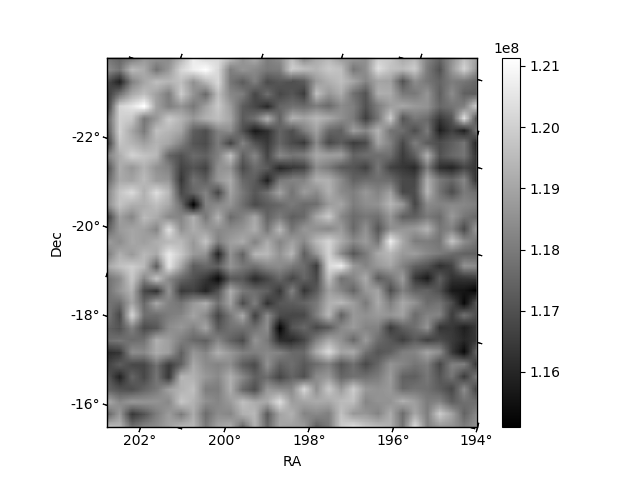
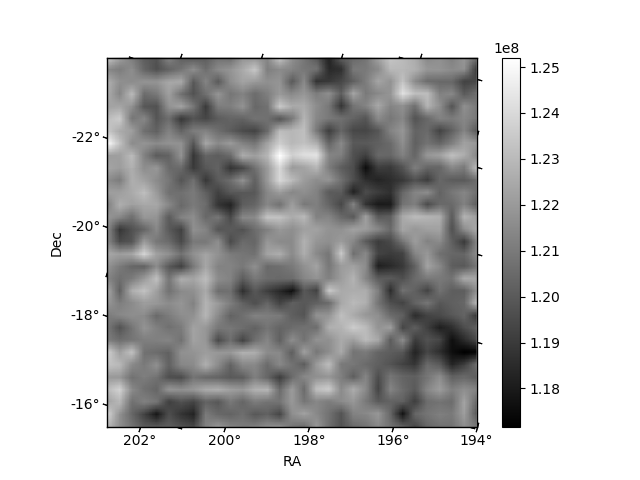
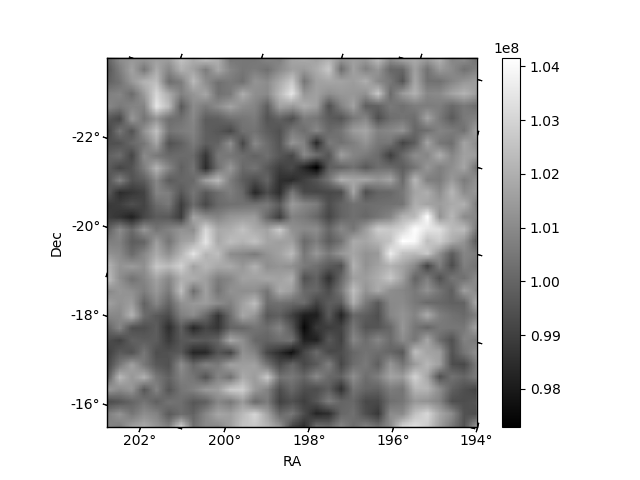
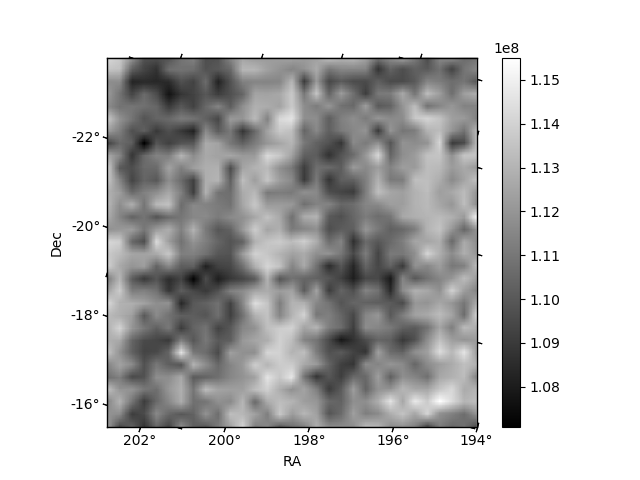
Histogram calculated using DETX and DETY for each event in the final _common_clean file
| Quadrant A | 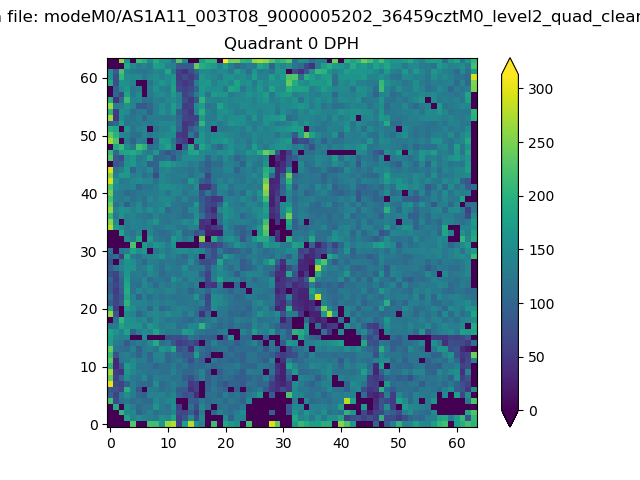 |
 |
Quadrant B |
|---|---|---|---|
| Quadrant D | 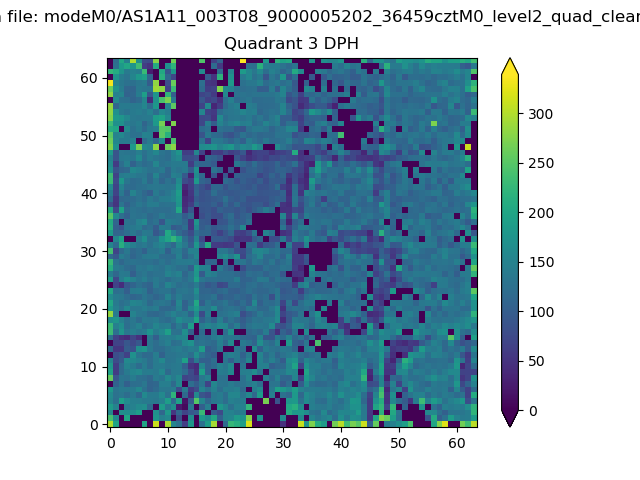 |
 |
Quadrant C |
| Plot type | Count rate plots | Images |
|---|---|---|
| Comparison with Poisson distribution Blue bars denote a histogram of data divided into 1 sec bins. Red curve is a Poisson curve with rate = median count rate of data. |
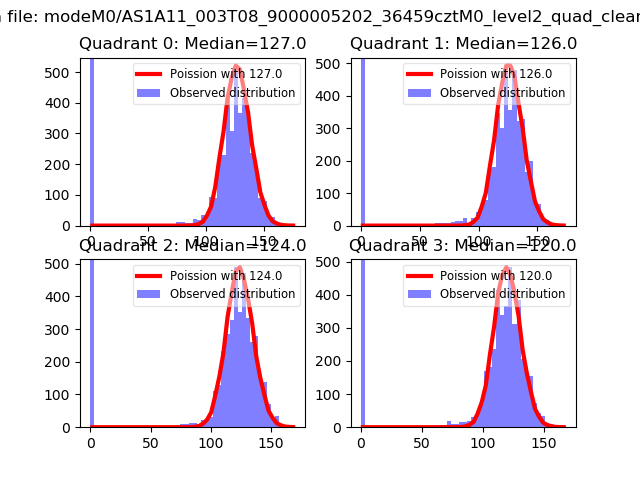 |
 |
| Quadrant-wise count rates Data is divided into 100 sec bins |
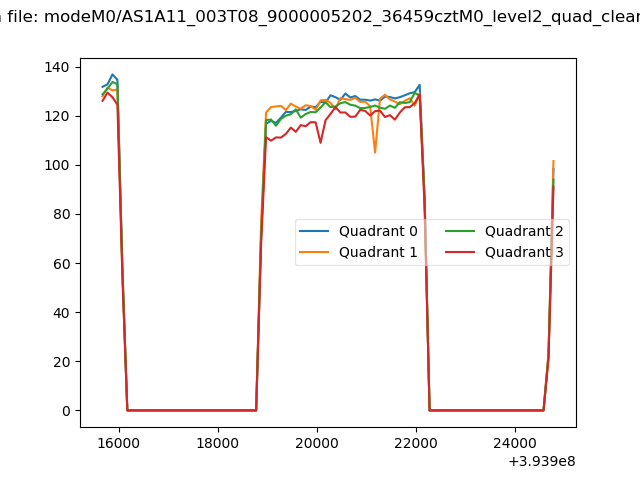 |
|
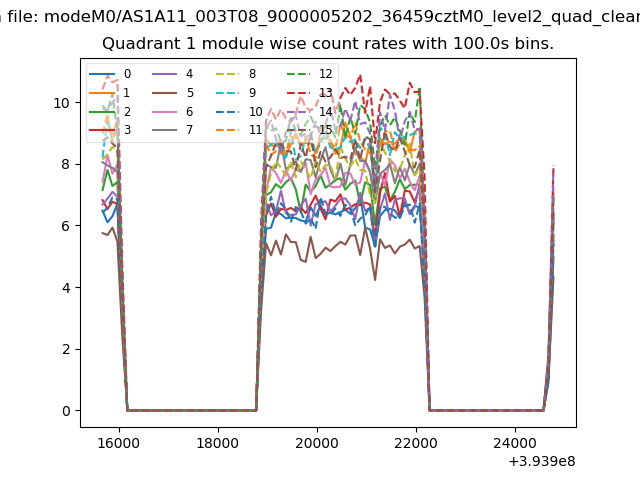
| Module-wise count rates for Quadrant A Data is divided into 100 sec bins |
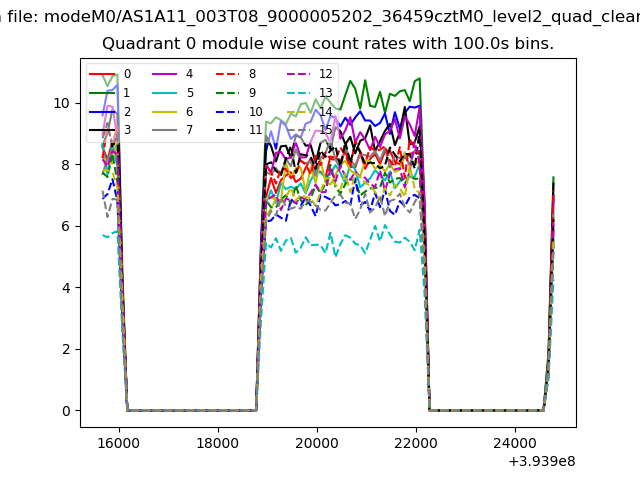 |
 |
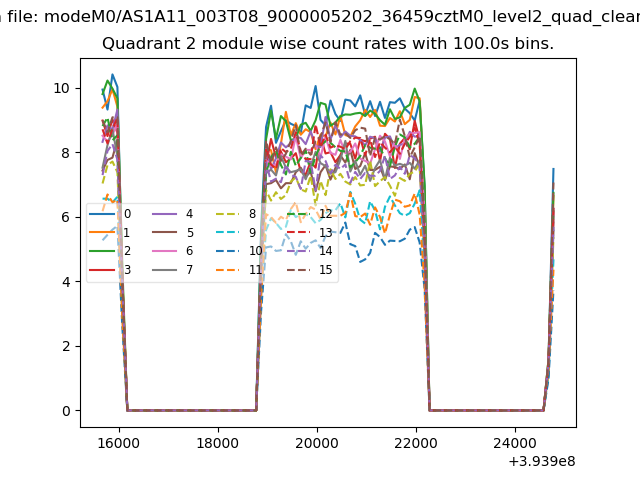
| Module-wise count rates for Quadrant B Data is divided into 100 sec bins |
 |
 |
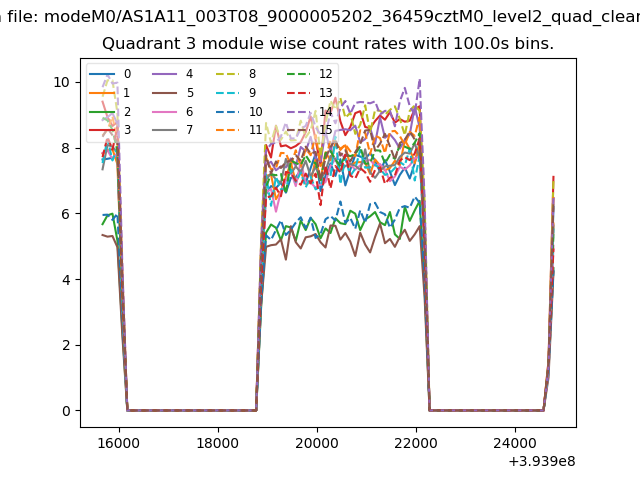
| Module-wise count rates for Quadrant C Data is divided into 100 sec bins |
 |
 |
| Module-wise count rates for Quadrant D Data is divided into 100 sec bins |
 |
 |
| Parameter | Plot |
|---|---|
| CZT HV Monitor | 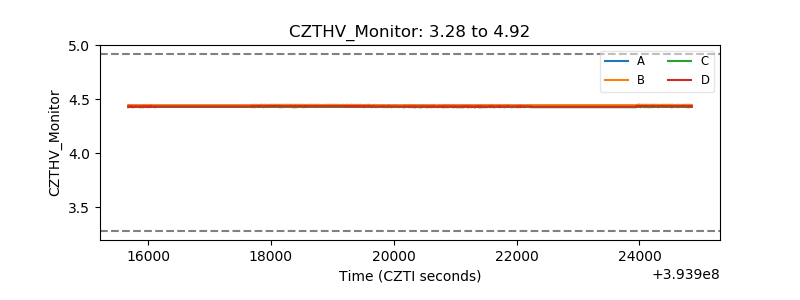 |
| D_VDD | 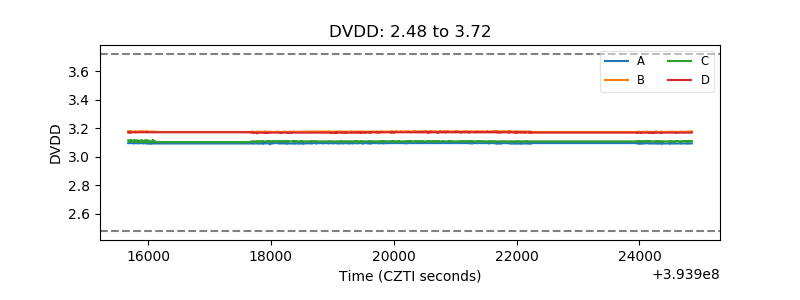 |
| Temperature 1 | 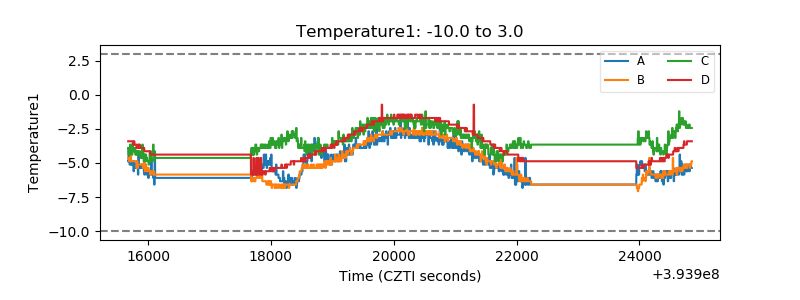 |
| Veto HV Monitor | 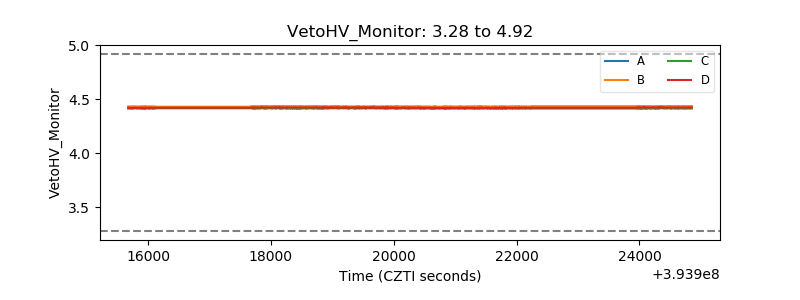 |
| Veto LLD | 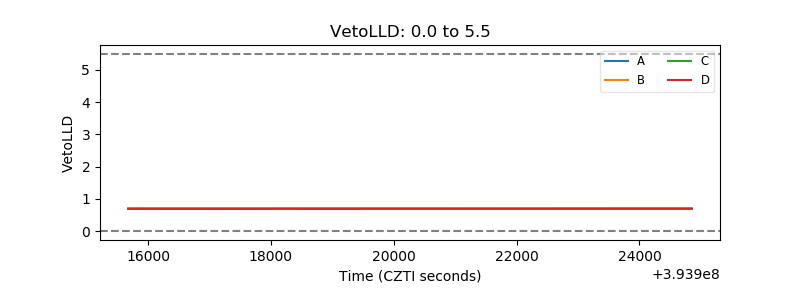 |
| Alpha Counter | 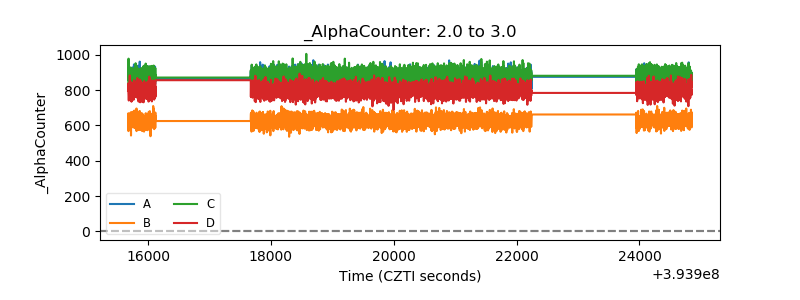 |
| _CPM_Rate |  |
| CZT Counter | 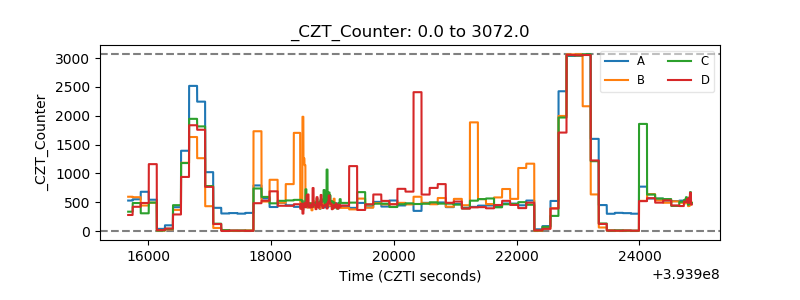 |
| +2.5 Volts monitor | 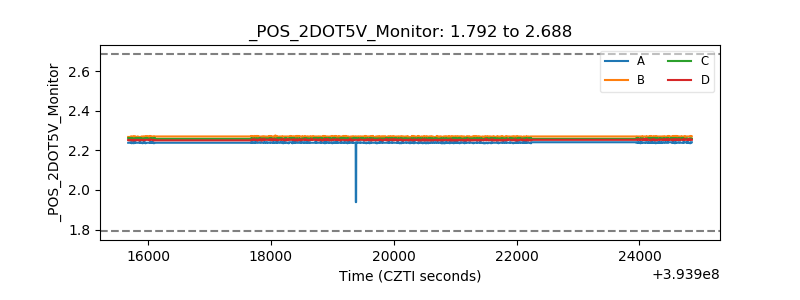 |
| +5 Volts monitor | 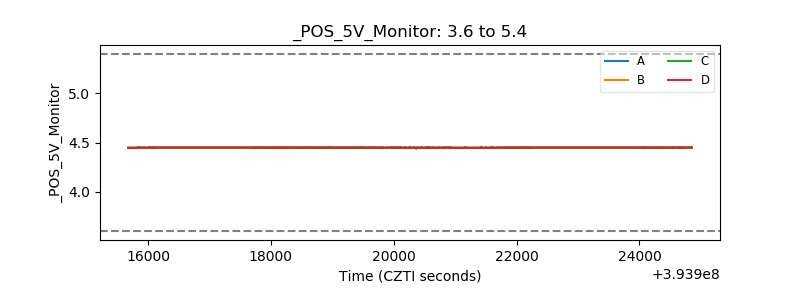 |
| _ROLL_ROT | 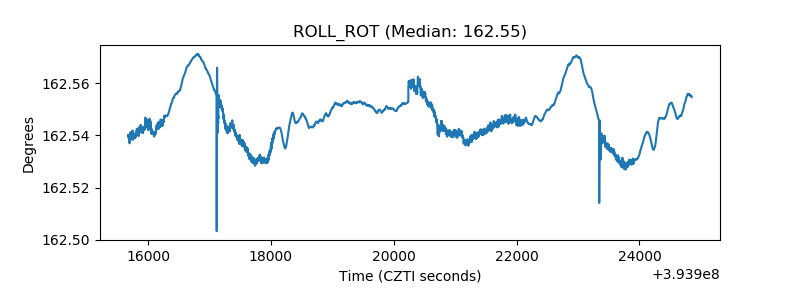 |
| _Roll_DEC |  |
| _Roll_RA | 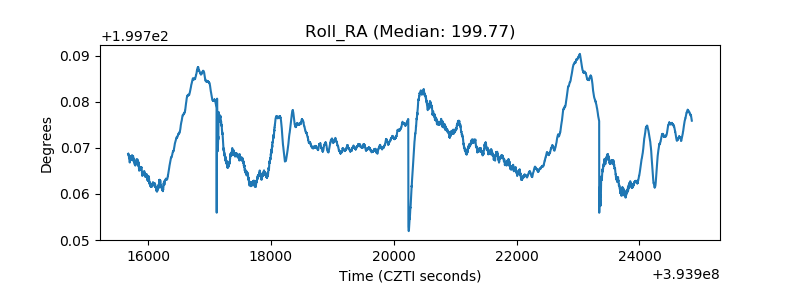 |
| Veto Counter |  |