| Param | Original file | Final file |
|---|---|---|
| Filename | modeM0/AS1A11_003T08_9000005202_36455cztM0_level2.evt | modeM0/AS1A11_003T08_9000005202_36455cztM0_level2_quad_clean.evt |
| Size (bytes) | 251,064,000 | 47,263,680 |
| Size | 239.4 MB | 45.1 MB |
| Events in quadrant A | 1,674,622 | 306,185 |
| Events in quadrant B | 2,015,023 | 303,901 |
| Events in quadrant C | 1,913,281 | 296,325 |
| Events in quadrant D | 1,774,593 | 289,951 |
| Mode SS | |||
|---|---|---|---|
| Quadrant | BADHDUFLAG | Total packets | Discarded packets |
| A | 0 | 68 | 0 |
| B | 0 | 68 | 0 |
| C | 0 | 68 | 0 |
| D | 0 | 68 | 0 |
| Mode M9 | |||
|---|---|---|---|
| Quadrant | BADHDUFLAG | Total packets | Discarded packets |
| A | 0 | 13 | 0 |
| B | 0 | 13 | 0 |
| C | 0 | 13 | 0 |
| D | 0 | 13 | 0 |
| Mode M0 | |||
|---|---|---|---|
| Quadrant | BADHDUFLAG | Total packets | Discarded packets |
| A | 0 | 6901 | 2 |
| B | 0 | 8027 | 1 |
| C | 0 | 7547 | 1 |
| D | 0 | 7452 | 1 |
| Quadrant | Total seconds | Saturated seconds | Saturation percentage |
|---|---|---|---|
| A | 3303 | 9 | 0.272480% |
| B | 3303 | 59 | 1.786255% |
| C | 3303 | 58 | 1.755979% |
| D | 3303 | 32 | 0.968816% |
Noise dominated data is calculated using 1-second bins in cleaned event files. If a bin has >2000 counts, and if more than 50% of those come from <1% of pixels, then it is considered to be noise-dominated and hence unusable.
| Quadrant | # 1 sec bins | Bins with >0 counts | Bins with >2000 counts | High rate bins dominated by noise | Noise dominated (total time) | Noise dominated (detector-on time) | Marked lightcurve |
|---|---|---|---|---|---|---|---|
| A | 4586 | 3304 | 6 | 6 | 0.13% | 0.18% | 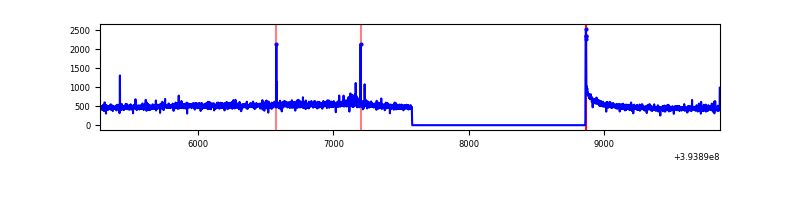 |
| B | 4586 | 3304 | 34 | 34 | 0.74% | 1.03% | 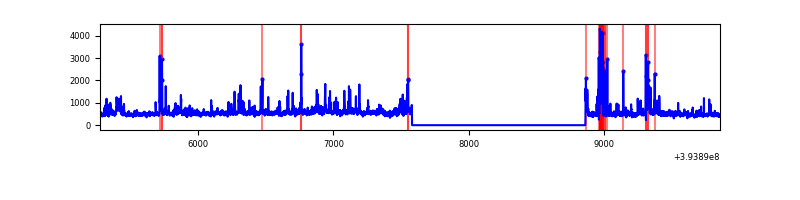 |
| C | 4586 | 3304 | 47 | 47 | 1.02% | 1.42% | 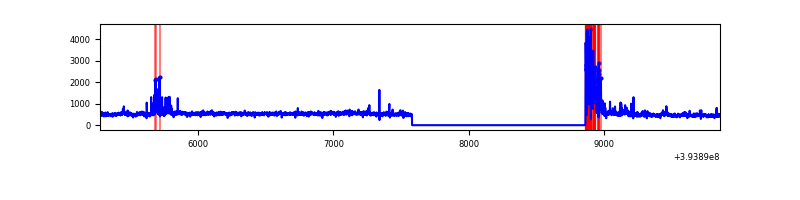 |
| D | 4586 | 3304 | 19 | 19 | 0.41% | 0.58% | 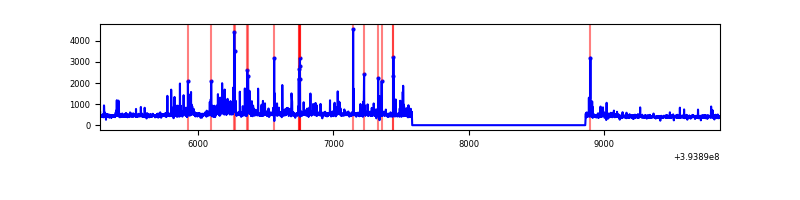 |
Top three noisy pixels from each quadrant. If the there are fewer than three noisy pixels in the level2.evt file, extra rows are filled as -1
| Pixel properties | Quadrant properties | ||||||
|---|---|---|---|---|---|---|---|
| Quadrant | DetID | PixID | Counts | Sigma | Mean | Median | Sigma |
| A | 10 | 83 | 107700 | 1308.95 | 399 | 390 | 82.0 |
| A | 9 | 143 | 13443 | 159.21 | 399 | 390 | 82.0 |
| A | 13 | 254 | 6021 | 68.68 | 399 | 390 | 82.0 |
| B | 5 | 172 | 227768 | 2990.43 | 389 | 380 | 76.0 |
| B | 0 | 189 | 83899 | 1098.38 | 389 | 380 | 76.0 |
| B | 5 | 255 | 69286 | 906.2 | 389 | 380 | 76.0 |
| C | 0 | 10 | 174827 | 1948.93 | 380 | 382 | 89.5 |
| C | 15 | 214 | 151108 | 1683.94 | 380 | 382 | 89.5 |
| C | 0 | 207 | 60924 | 676.39 | 380 | 382 | 89.5 |
| D | 13 | 249 | 48354 | 501.46 | 386 | 375 | 95.7 |
| D | 2 | 153 | 47943 | 497.16 | 386 | 375 | 95.7 |
| D | 10 | 199 | 41437 | 429.16 | 386 | 375 | 95.7 |
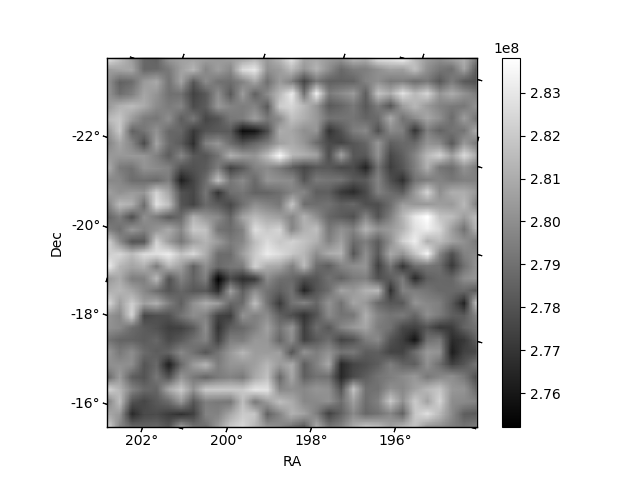
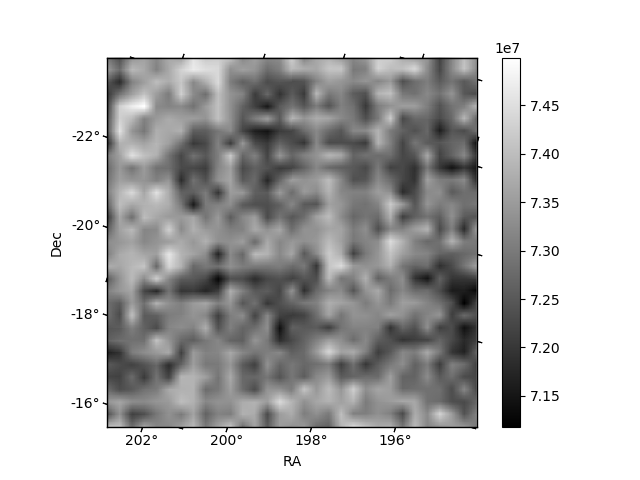
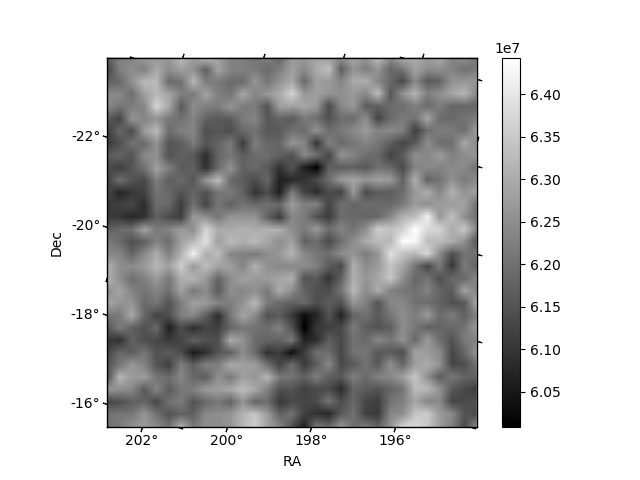
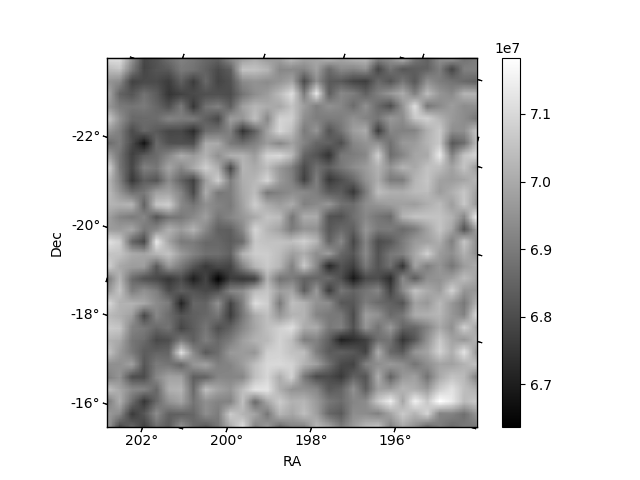
Histogram calculated using DETX and DETY for each event in the final _common_clean file
| Quadrant A | 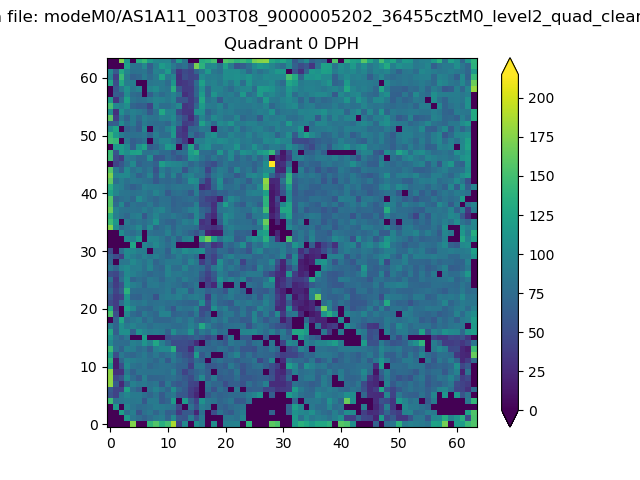 |
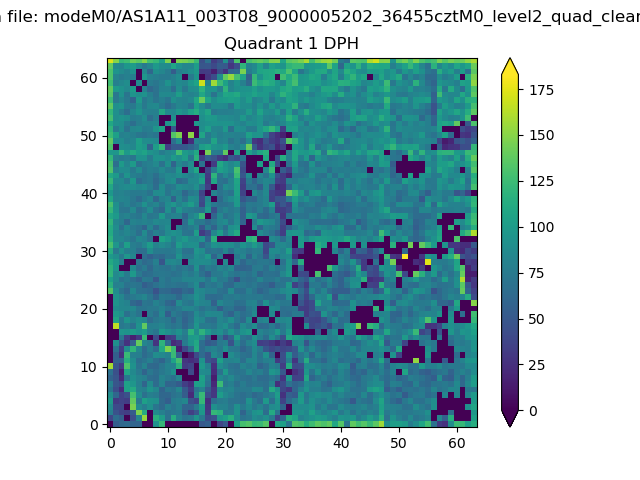 |
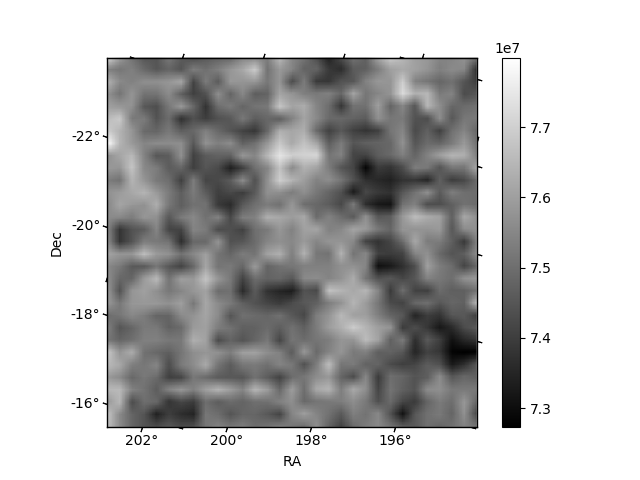
Quadrant B |
|---|---|---|---|
| Quadrant D | 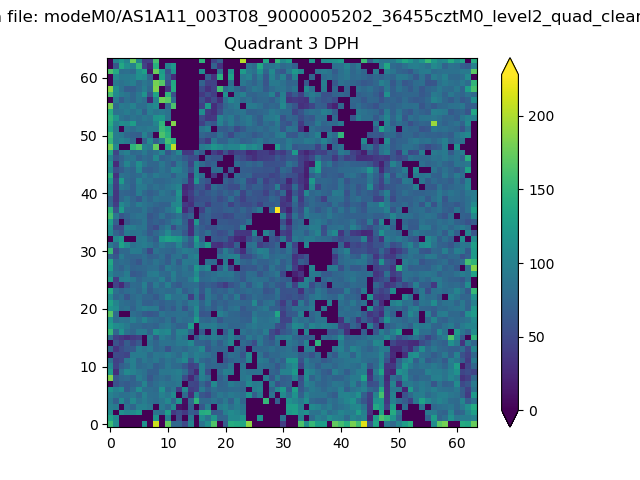 |
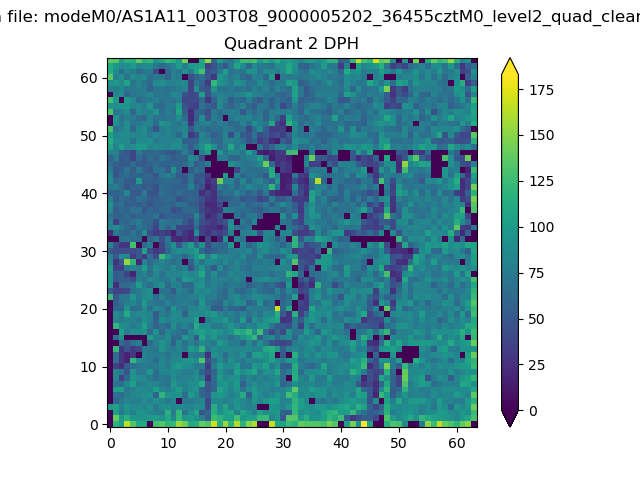 |
Quadrant C |
| Plot type | Count rate plots | Images |
|---|---|---|
| Comparison with Poisson distribution Blue bars denote a histogram of data divided into 1 sec bins. Red curve is a Poisson curve with rate = median count rate of data. |
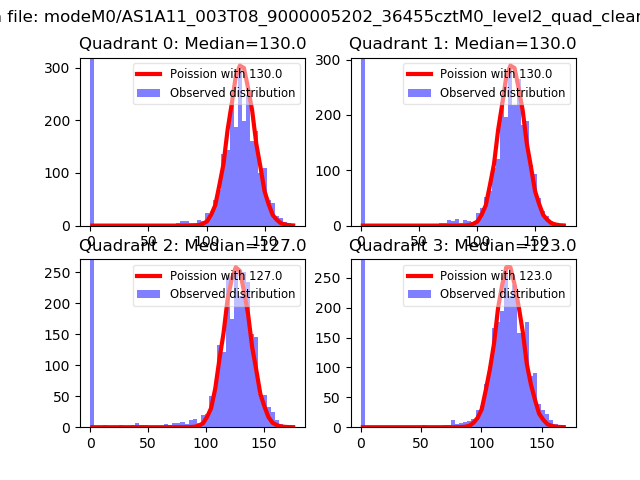 |
 |
| Quadrant-wise count rates Data is divided into 100 sec bins |
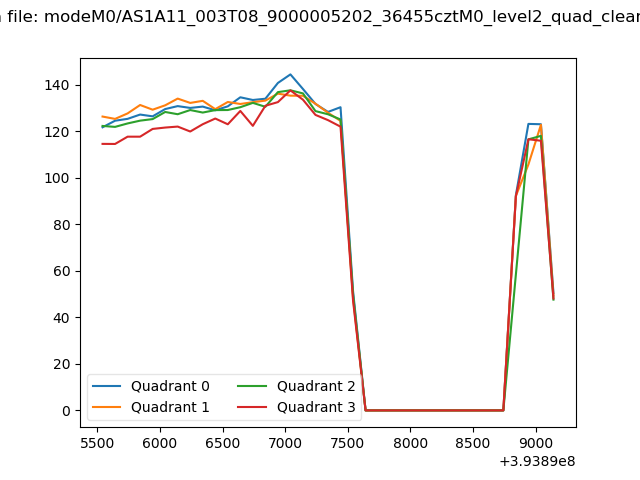 |
|
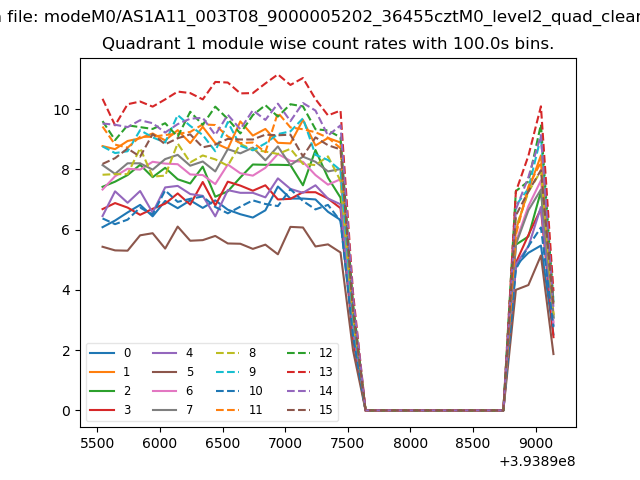
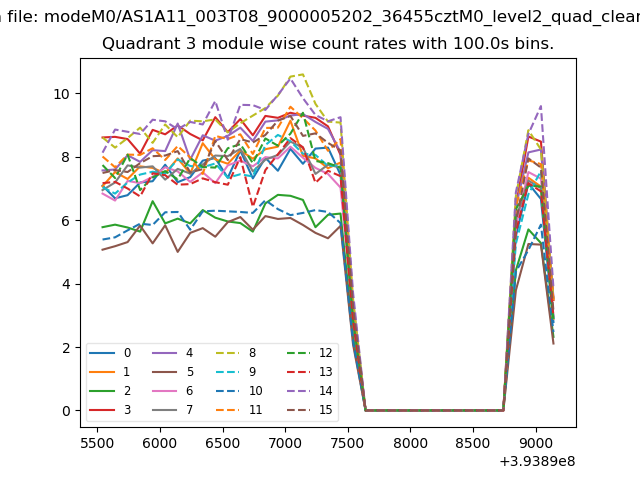
| Module-wise count rates for Quadrant A Data is divided into 100 sec bins |
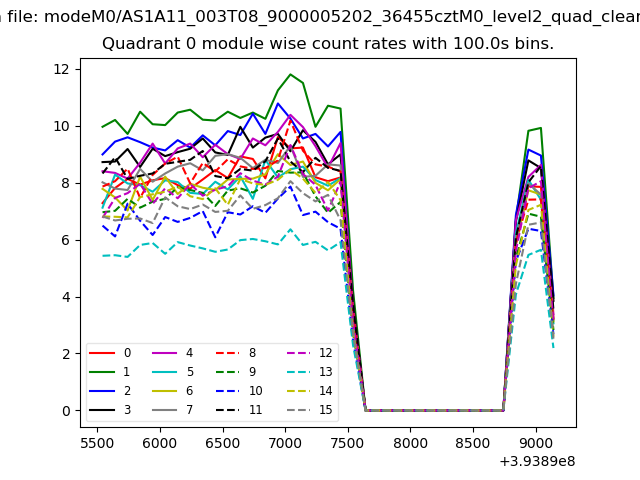 |
 |
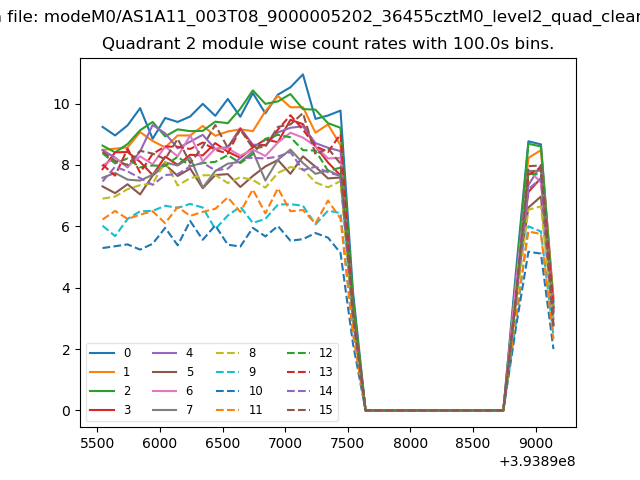
| Module-wise count rates for Quadrant B Data is divided into 100 sec bins |
 |
 |
| Module-wise count rates for Quadrant C Data is divided into 100 sec bins |
 |
 |
| Module-wise count rates for Quadrant D Data is divided into 100 sec bins |
 |
 |
| Parameter | Plot |
|---|---|
| CZT HV Monitor | 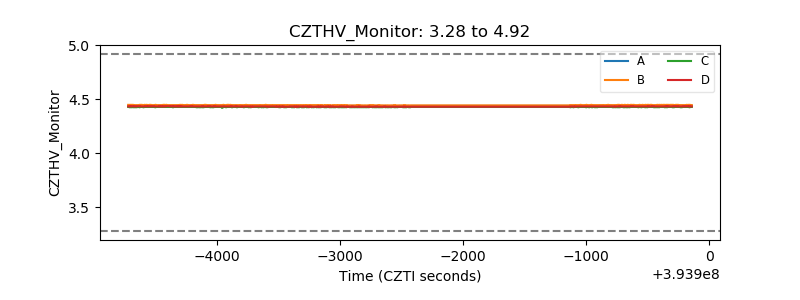 |
| D_VDD | 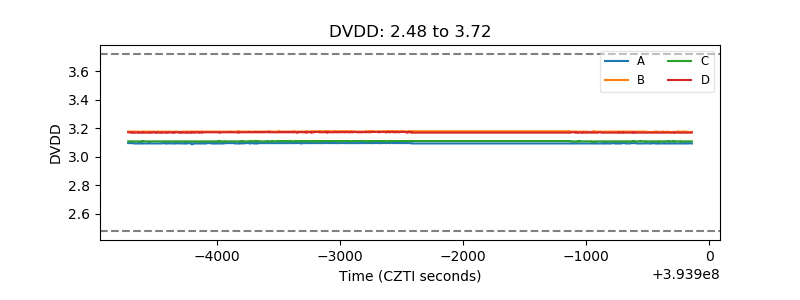 |
| Temperature 1 | 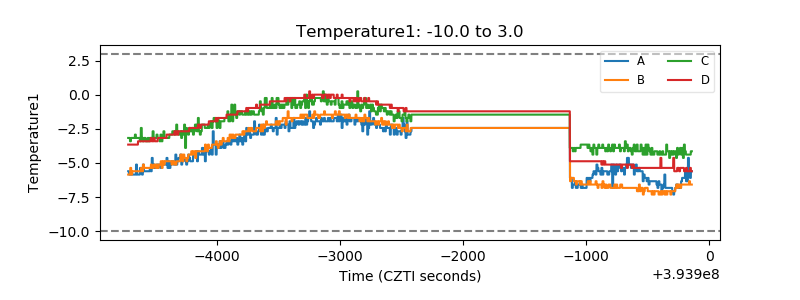 |
| Veto HV Monitor | 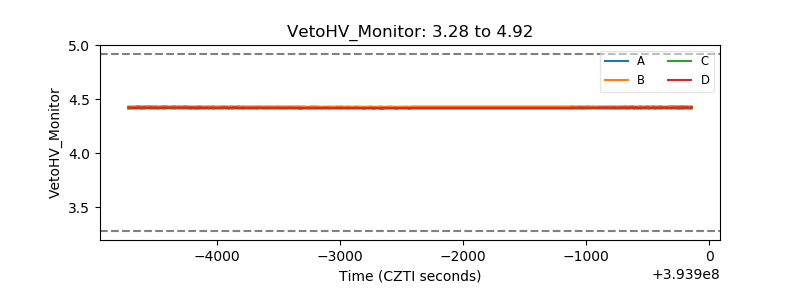 |
| Veto LLD | 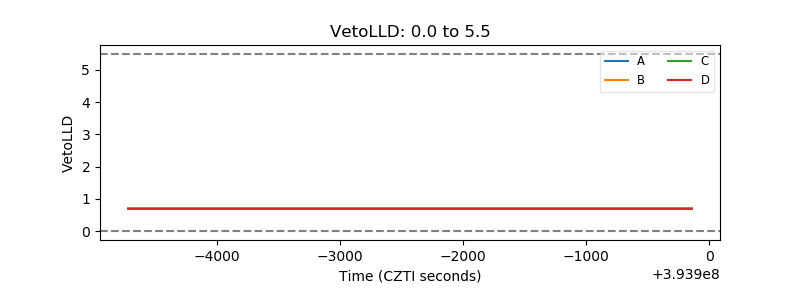 |
| Alpha Counter | 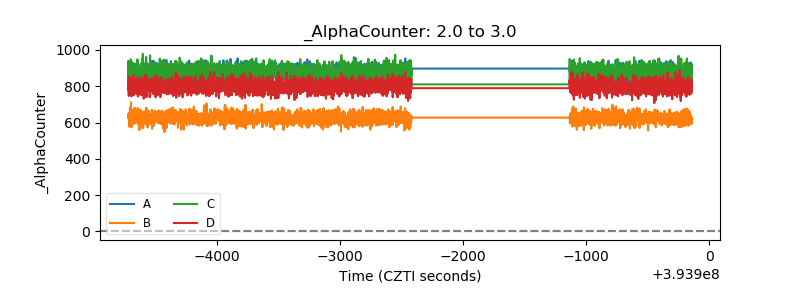 |
| _CPM_Rate | 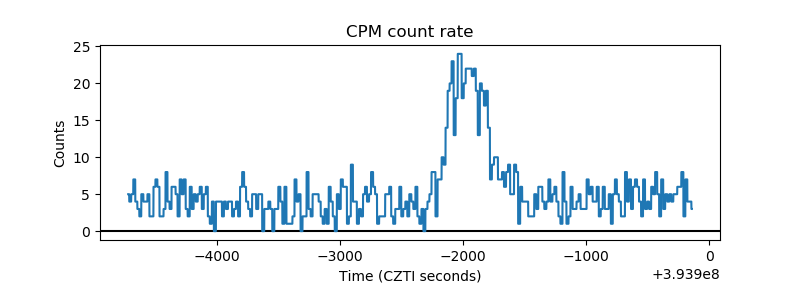 |
| CZT Counter | 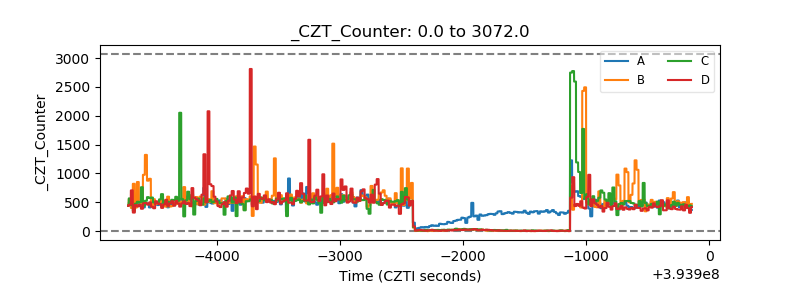 |
| +2.5 Volts monitor |  |
| +5 Volts monitor | 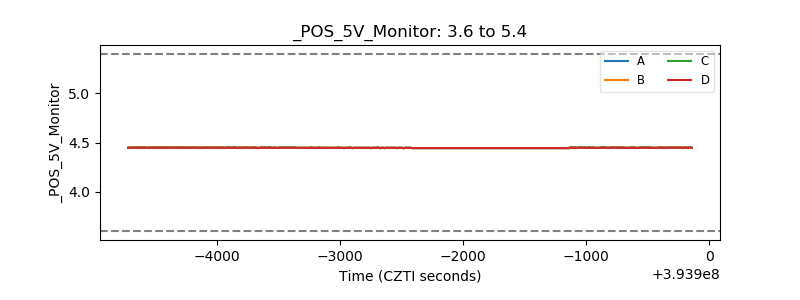 |
| _ROLL_ROT | 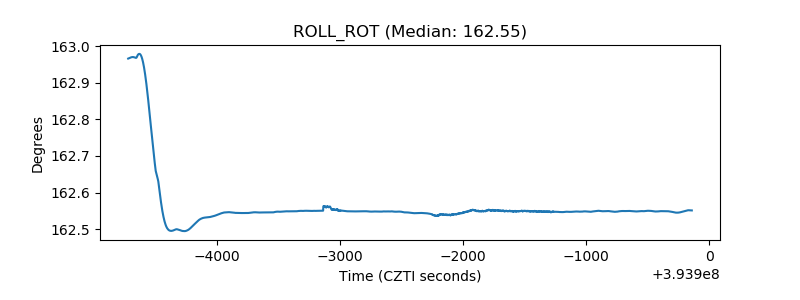 |
| _Roll_DEC | 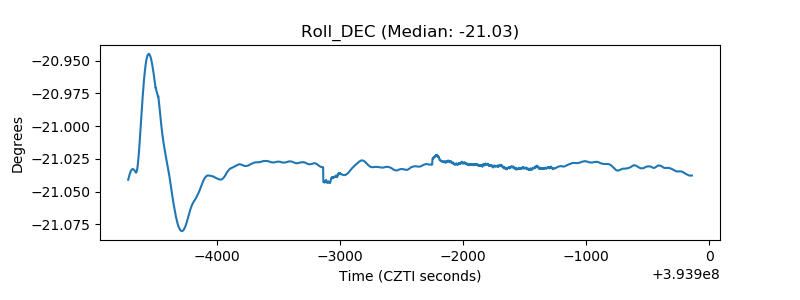 |
| _Roll_RA | 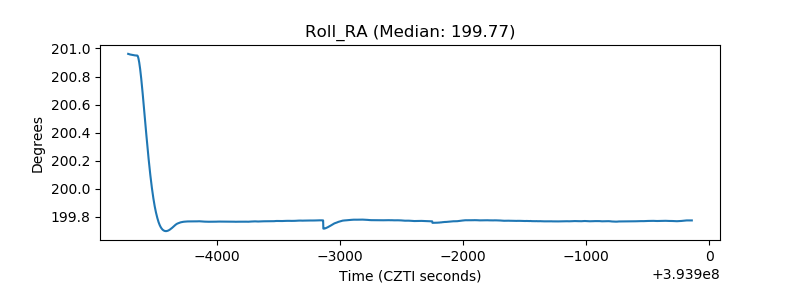 |
| Veto Counter | 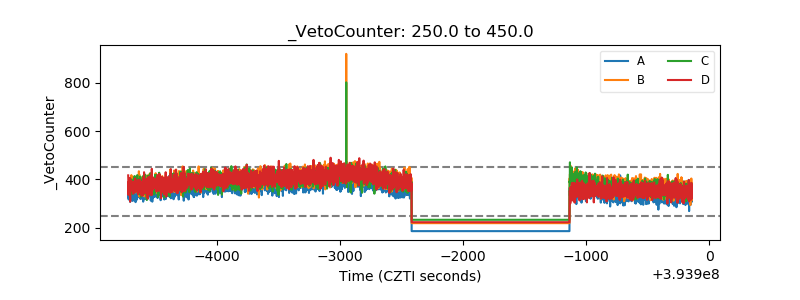 |