| Param | Original file | Final file |
|---|---|---|
| Filename | modeM0/AS1C07_009T01_9000005200_36455cztM0_level2.evt | modeM0/AS1C07_009T01_9000005200_36455cztM0_level2_quad_clean.evt |
| Size (bytes) | 150,048,000 | 30,513,600 |
| Size | 143.1 MB | 29.1 MB |
| Events in quadrant A | 946,644 | 200,291 |
| Events in quadrant B | 1,321,955 | 196,682 |
| Events in quadrant C | 1,070,177 | 192,243 |
| Events in quadrant D | 1,066,914 | 188,850 |
| Mode M0 | |||
|---|---|---|---|
| Quadrant | BADHDUFLAG | Total packets | Discarded packets |
| A | 0 | 4153 | 1 |
| B | 0 | 5272 | 1 |
| C | 0 | 4402 | 1 |
| D | 0 | 4647 | 1 |
| Mode SS | |||
|---|---|---|---|
| Quadrant | BADHDUFLAG | Total packets | Discarded packets |
| A | 0 | 44 | 0 |
| B | 0 | 44 | 0 |
| C | 0 | 44 | 0 |
| D | 0 | 44 | 0 |
| Mode M9 | |||
|---|---|---|---|
| Quadrant | BADHDUFLAG | Total packets | Discarded packets |
| A | 0 | 13 | 0 |
| B | 0 | 13 | 0 |
| C | 0 | 13 | 0 |
| D | 0 | 13 | 0 |
| Quadrant | Total seconds | Saturated seconds | Saturation percentage |
|---|---|---|---|
| A | 1995 | 5 | 0.250627% |
| B | 1995 | 92 | 4.611529% |
| C | 1995 | 37 | 1.854637% |
| D | 1995 | 33 | 1.654135% |
Noise dominated data is calculated using 1-second bins in cleaned event files. If a bin has >2000 counts, and if more than 50% of those come from <1% of pixels, then it is considered to be noise-dominated and hence unusable.
| Quadrant | # 1 sec bins | Bins with >0 counts | Bins with >2000 counts | High rate bins dominated by noise | Noise dominated (total time) | Noise dominated (detector-on time) | Marked lightcurve |
|---|---|---|---|---|---|---|---|
| A | 3337 | 1996 | 0 | 0 | 0.00% | 0.00% | 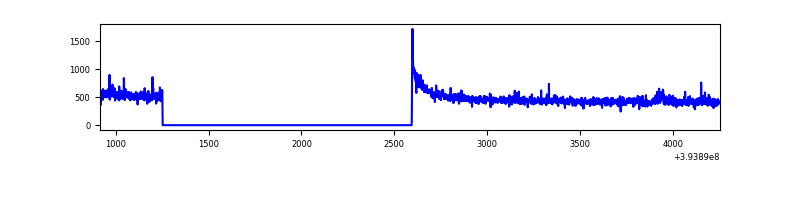 |
| B | 3337 | 1996 | 56 | 56 | 1.68% | 2.81% | 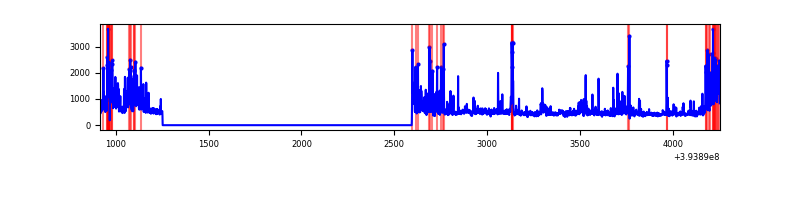 |
| C | 3337 | 1996 | 24 | 24 | 0.72% | 1.20% | 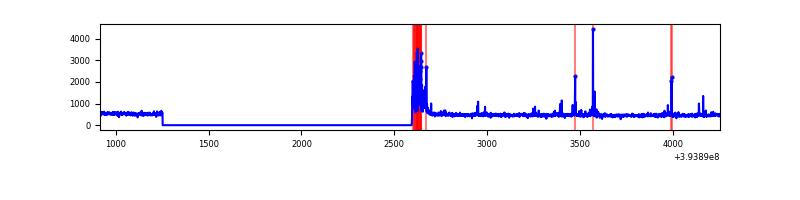 |
| D | 3337 | 1996 | 25 | 25 | 0.75% | 1.25% | 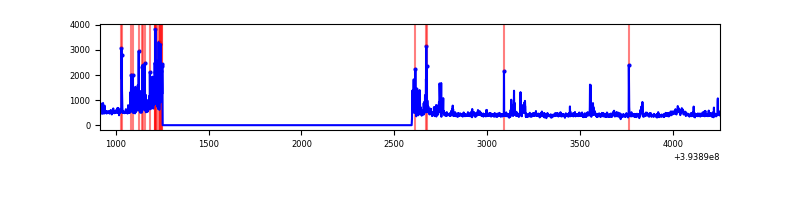 |
Top three noisy pixels from each quadrant. If the there are fewer than three noisy pixels in the level2.evt file, extra rows are filled as -1
| Pixel properties | Quadrant properties | ||||||
|---|---|---|---|---|---|---|---|
| Quadrant | DetID | PixID | Counts | Sigma | Mean | Median | Sigma |
| A | 10 | 83 | 84558 | 1843.23 | 218 | 214 | 45.8 |
| A | 5 | 168 | 5751 | 121.0 | 218 | 214 | 45.8 |
| A | 13 | 254 | 3433 | 70.35 | 218 | 214 | 45.8 |
| B | 5 | 172 | 235019 | 5461.54 | 215 | 209 | 43.0 |
| B | 5 | 255 | 125020 | 2903.03 | 215 | 209 | 43.0 |
| B | 4 | 171 | 39384 | 911.19 | 215 | 209 | 43.0 |
| C | 0 | 10 | 96331 | 1883.07 | 212 | 213 | 51.0 |
| C | 15 | 214 | 95651 | 1869.75 | 212 | 213 | 51.0 |
| C | 0 | 207 | 48006 | 936.33 | 212 | 213 | 51.0 |
| D | 2 | 250 | 81344 | 1552.33 | 210 | 203 | 52.3 |
| D | 10 | 199 | 30822 | 585.78 | 210 | 203 | 52.3 |
| D | 12 | 233 | 27320 | 518.78 | 210 | 203 | 52.3 |
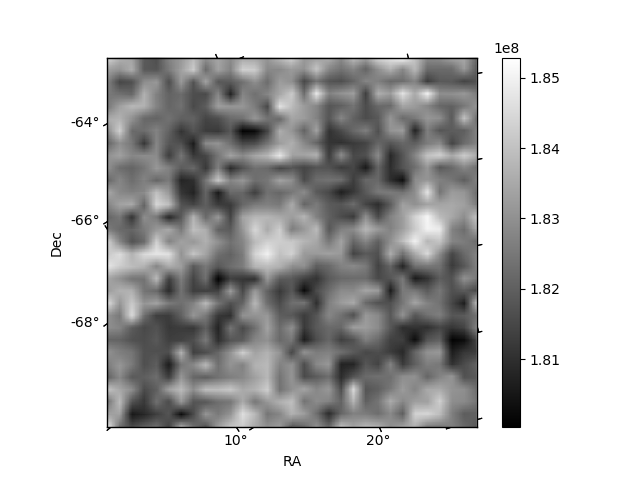
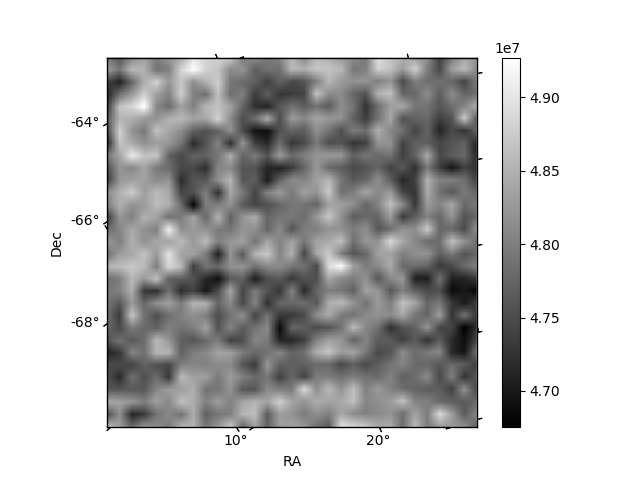
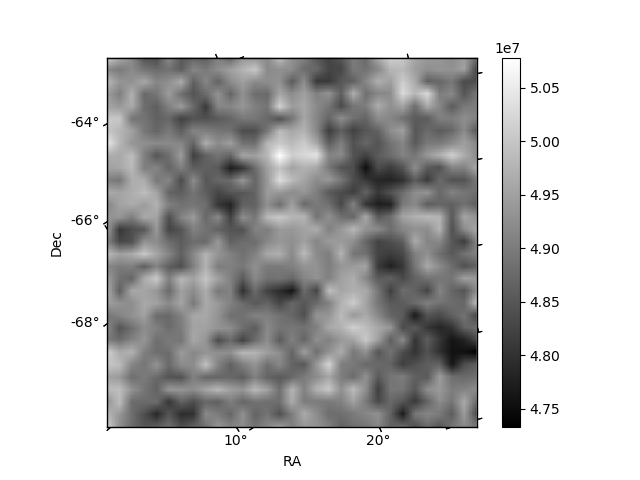
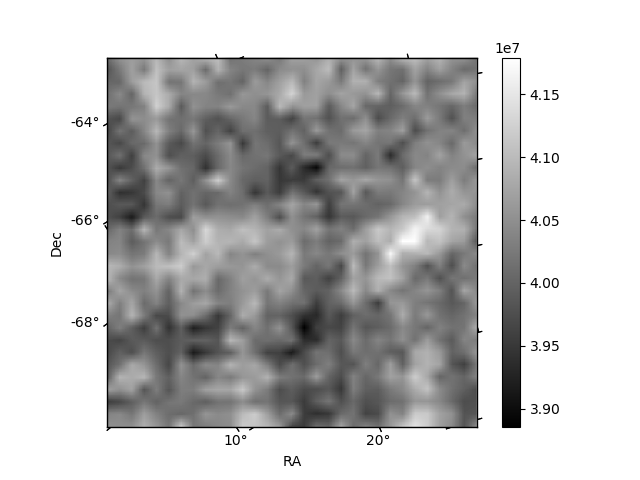
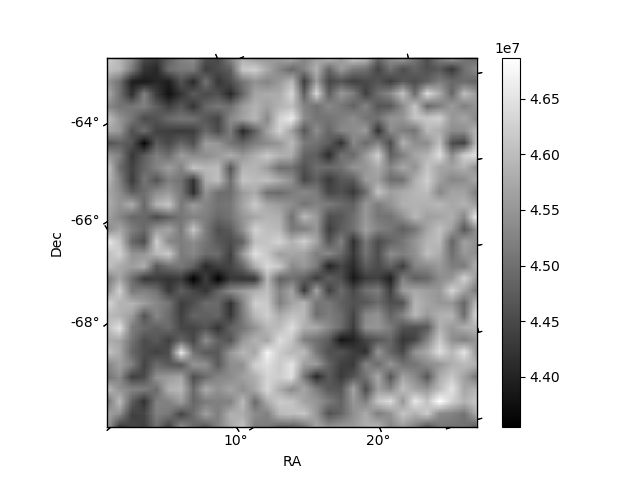
Histogram calculated using DETX and DETY for each event in the final _common_clean file
| Quadrant A | 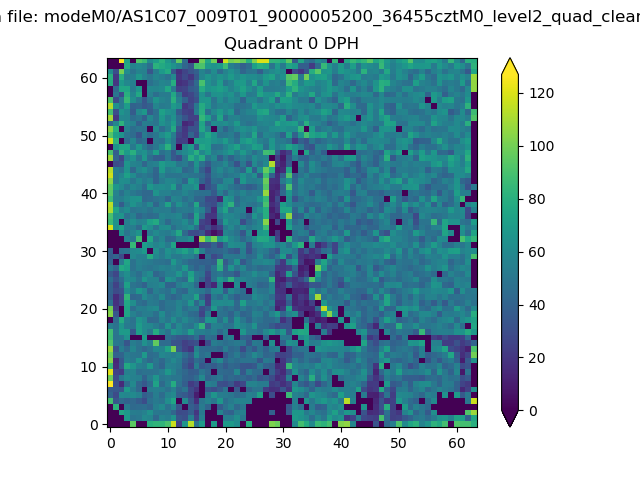 |
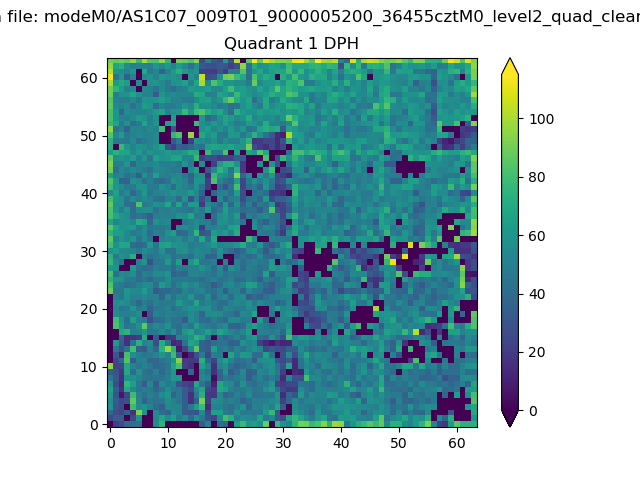 |
Quadrant B |
|---|---|---|---|
| Quadrant D | 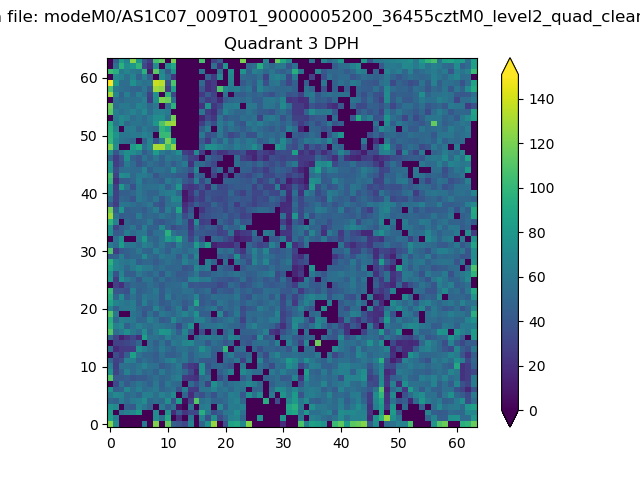 |
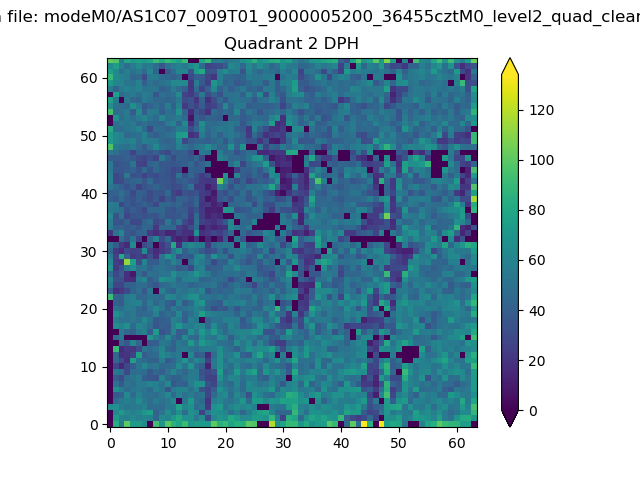 |
Quadrant C |
| Plot type | Count rate plots | Images |
|---|---|---|
| Comparison with Poisson distribution Blue bars denote a histogram of data divided into 1 sec bins. Red curve is a Poisson curve with rate = median count rate of data. |
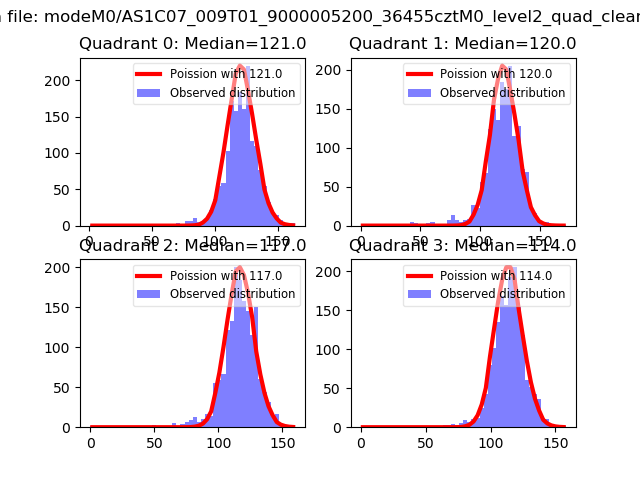 |
 |
| Quadrant-wise count rates Data is divided into 100 sec bins |
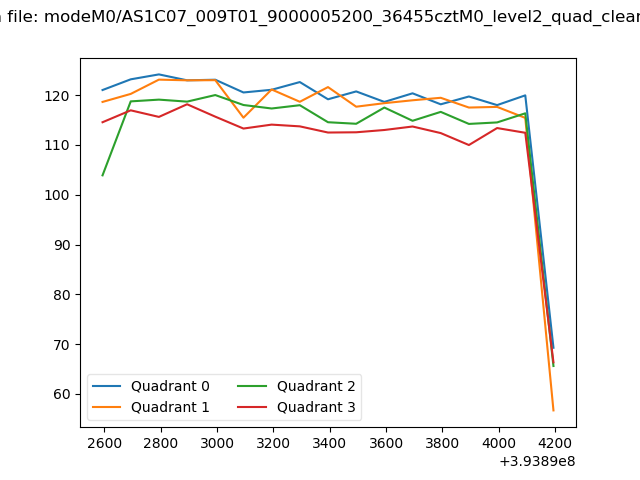 |
|
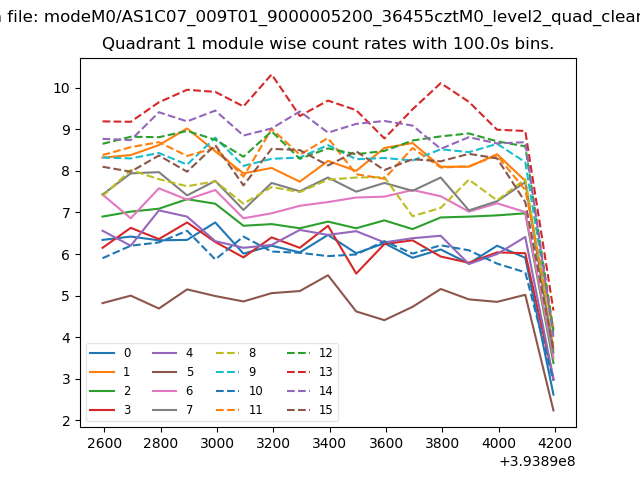
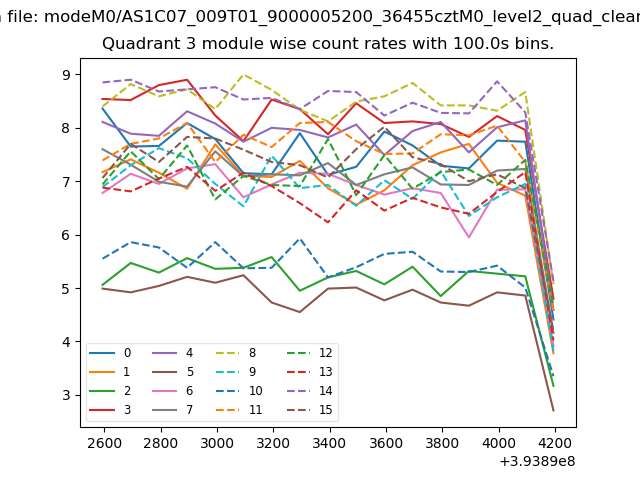
| Module-wise count rates for Quadrant A Data is divided into 100 sec bins |
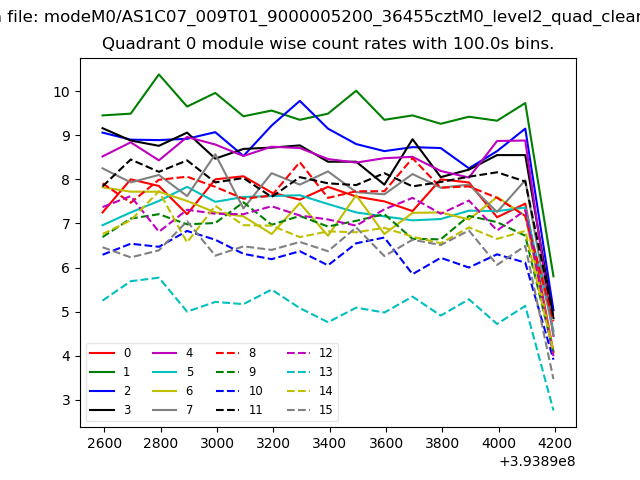 |
 |
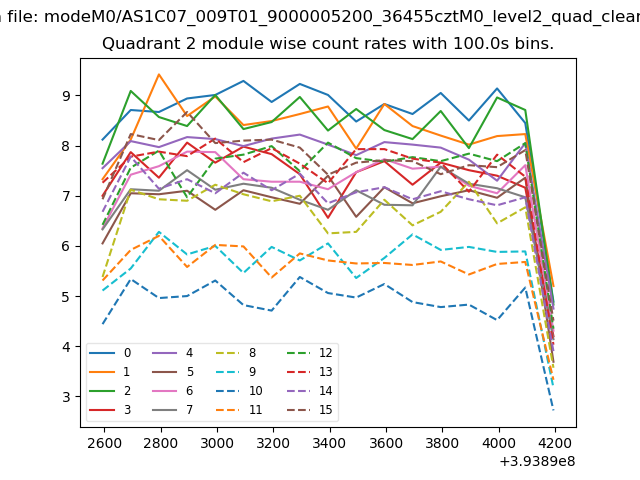
| Module-wise count rates for Quadrant B Data is divided into 100 sec bins |
 |
 |
| Module-wise count rates for Quadrant C Data is divided into 100 sec bins |
 |
 |
| Module-wise count rates for Quadrant D Data is divided into 100 sec bins |
 |
 |
| Parameter | Plot |
|---|---|
| CZT HV Monitor | 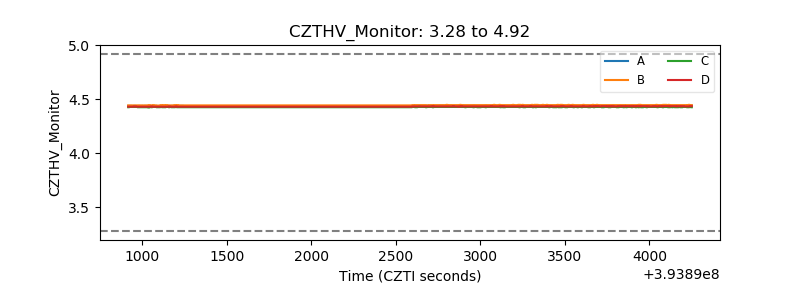 |
| D_VDD | 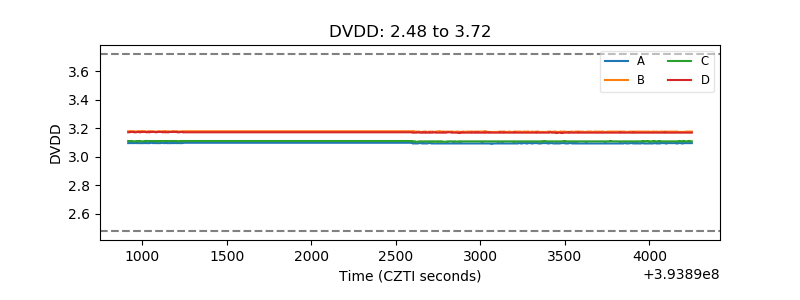 |
| Temperature 1 | 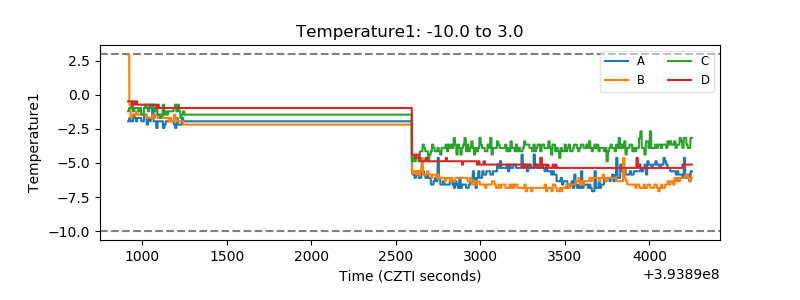 |
| Veto HV Monitor | 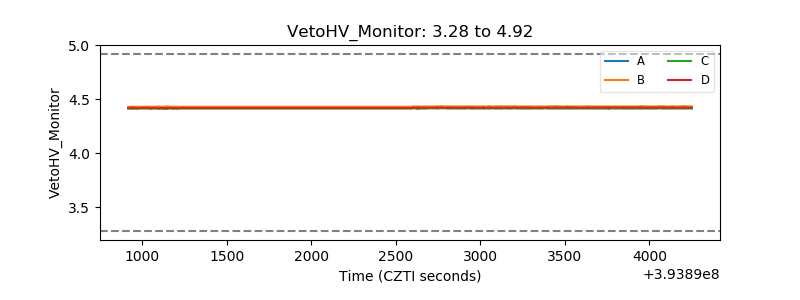 |
| Veto LLD | 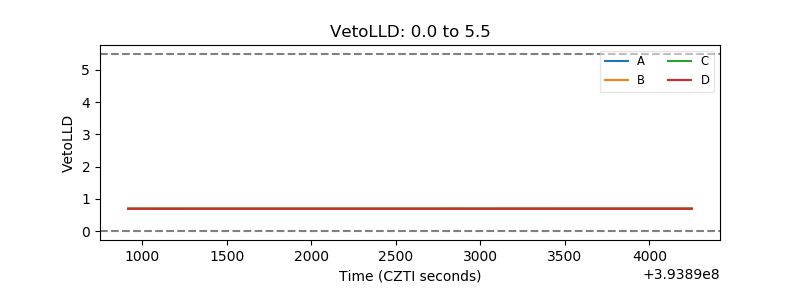 |
| Alpha Counter | 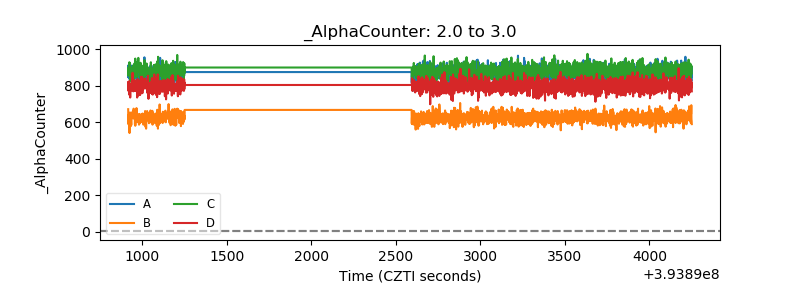 |
| _CPM_Rate | 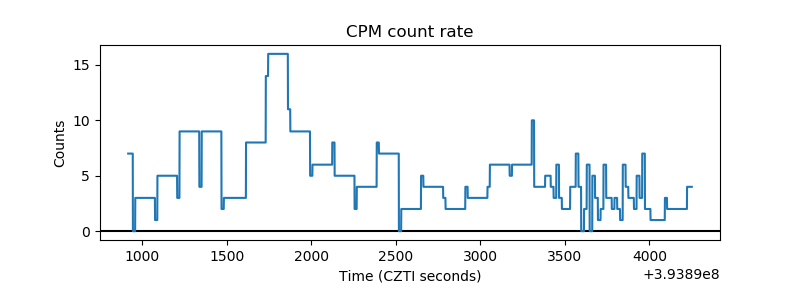 |
| CZT Counter | 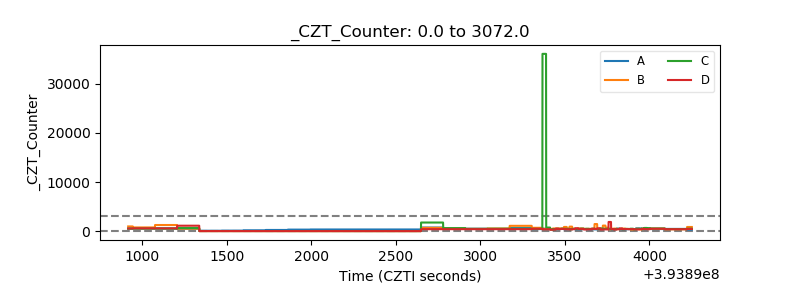 |
| +2.5 Volts monitor | 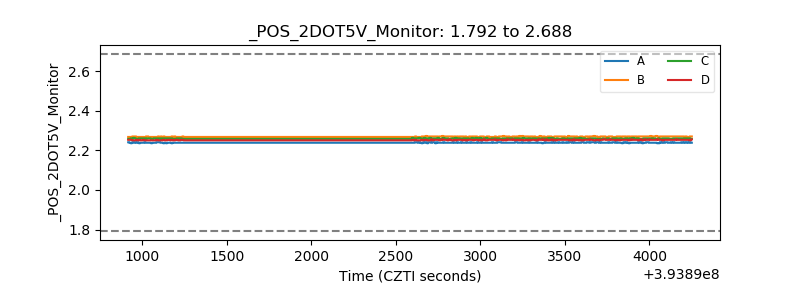 |
| +5 Volts monitor | 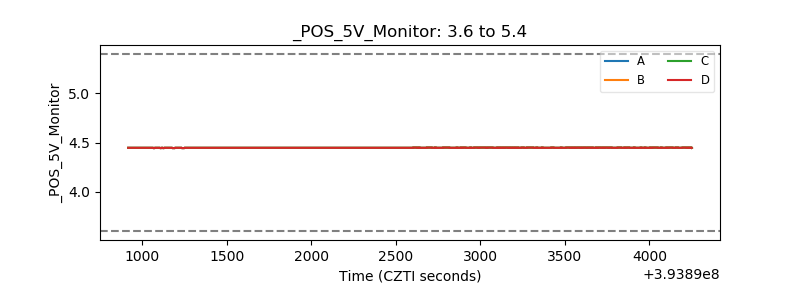 |
| _ROLL_ROT | 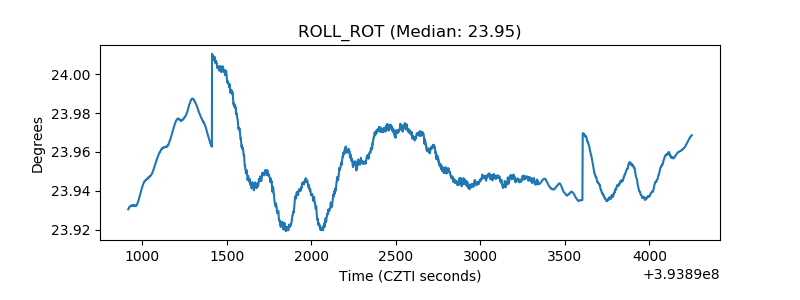 |
| _Roll_DEC | 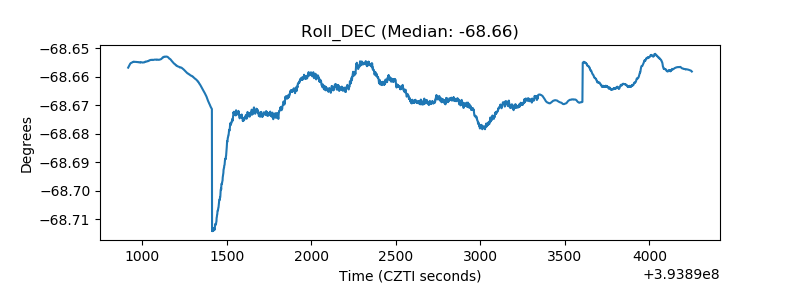 |
| _Roll_RA | 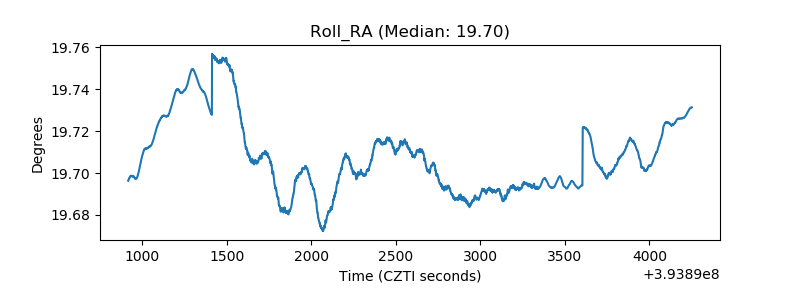 |
| Veto Counter | 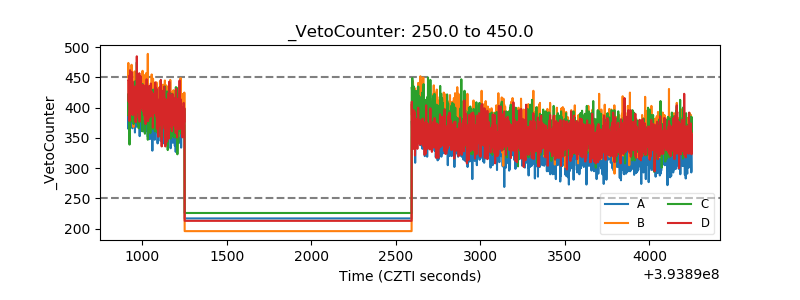 |