| Param | Original file | Final file |
|---|---|---|
| Filename | modeM0/AS1C07_009T01_9000005200_36454cztM0_level2.evt | modeM0/AS1C07_009T01_9000005200_36454cztM0_level2_quad_clean.evt |
| Size (bytes) | 419,515,200 | 97,888,320 |
| Size | 400.1 MB | 93.4 MB |
| Events in quadrant A | 2,755,595 | 654,512 |
| Events in quadrant B | 3,435,689 | 648,225 |
| Events in quadrant C | 2,998,149 | 639,010 |
| Events in quadrant D | 3,121,942 | 618,233 |
| Mode M0 | |||
|---|---|---|---|
| Quadrant | BADHDUFLAG | Total packets | Discarded packets |
| A | 0 | 11986 | 3 |
| B | 0 | 14128 | 2 |
| C | 0 | 12288 | 2 |
| D | 0 | 13391 | 2 |
| Mode SS | |||
|---|---|---|---|
| Quadrant | BADHDUFLAG | Total packets | Discarded packets |
| A | 0 | 120 | 0 |
| B | 0 | 120 | 0 |
| C | 0 | 120 | 0 |
| D | 0 | 120 | 0 |
| Mode M9 | |||
|---|---|---|---|
| Quadrant | BADHDUFLAG | Total packets | Discarded packets |
| A | 0 | 29 | 0 |
| B | 0 | 29 | 0 |
| C | 0 | 29 | 0 |
| D | 0 | 29 | 0 |
| Quadrant | Total seconds | Saturated seconds | Saturation percentage |
|---|---|---|---|
| A | 5789 | 11 | 0.190016% |
| B | 5789 | 135 | 2.332009% |
| C | 5789 | 53 | 0.915529% |
| D | 5789 | 92 | 1.589221% |
Noise dominated data is calculated using 1-second bins in cleaned event files. If a bin has >2000 counts, and if more than 50% of those come from <1% of pixels, then it is considered to be noise-dominated and hence unusable.
| Quadrant | # 1 sec bins | Bins with >0 counts | Bins with >2000 counts | High rate bins dominated by noise | Noise dominated (total time) | Noise dominated (detector-on time) | Marked lightcurve |
|---|---|---|---|---|---|---|---|
| A | 8654 | 5791 | 0 | 0 | 0.00% | 0.00% | 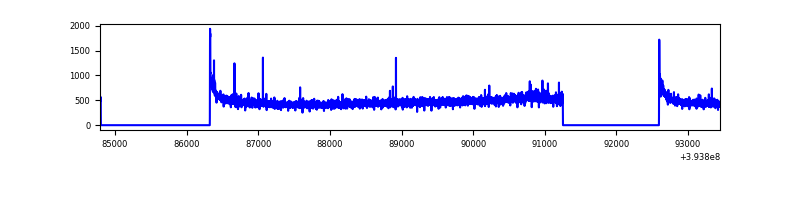 |
| B | 8654 | 5791 | 85 | 85 | 0.98% | 1.47% | 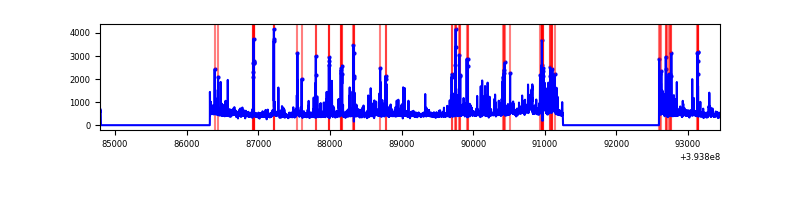 |
| C | 8654 | 5791 | 33 | 33 | 0.38% | 0.57% | 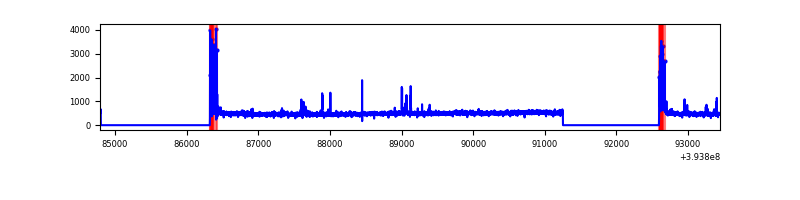 |
| D | 8654 | 5791 | 70 | 70 | 0.81% | 1.21% | 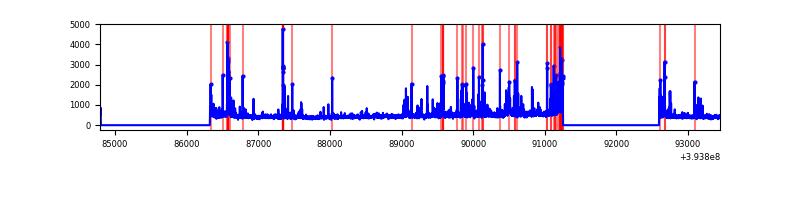 |
Top three noisy pixels from each quadrant. If the there are fewer than three noisy pixels in the level2.evt file, extra rows are filled as -1
| Pixel properties | Quadrant properties | ||||||
|---|---|---|---|---|---|---|---|
| Quadrant | DetID | PixID | Counts | Sigma | Mean | Median | Sigma |
| A | 10 | 83 | 199299 | 1519.83 | 649 | 635 | 130.7 |
| A | 13 | 210 | 10350 | 74.32 | 649 | 635 | 130.7 |
| A | 13 | 6 | 10196 | 73.14 | 649 | 635 | 130.7 |
| B | 5 | 172 | 411943 | 3369.34 | 638 | 621 | 122.1 |
| B | 5 | 255 | 275378 | 2250.67 | 638 | 621 | 122.1 |
| B | 0 | 190 | 81489 | 662.43 | 638 | 621 | 122.1 |
| C | 15 | 214 | 270407 | 1830.11 | 631 | 635 | 147.4 |
| C | 0 | 10 | 166284 | 1123.75 | 631 | 635 | 147.4 |
| C | 15 | 159 | 51071 | 342.15 | 631 | 635 | 147.4 |
| D | 2 | 250 | 156533 | 1020.88 | 630 | 612 | 152.7 |
| D | 10 | 199 | 86687 | 563.57 | 630 | 612 | 152.7 |
| D | 12 | 233 | 86348 | 561.35 | 630 | 612 | 152.7 |
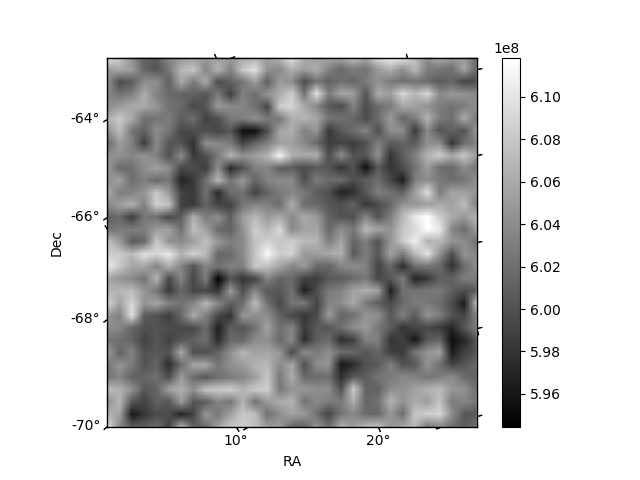
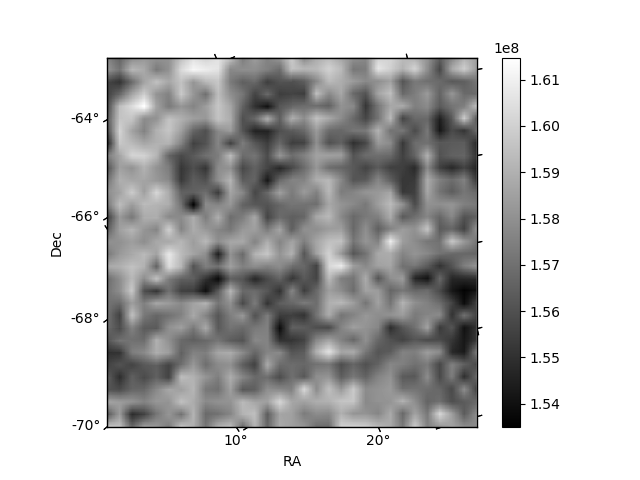
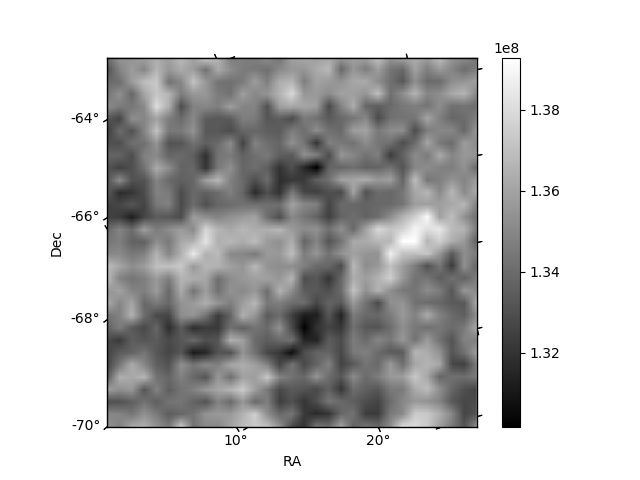
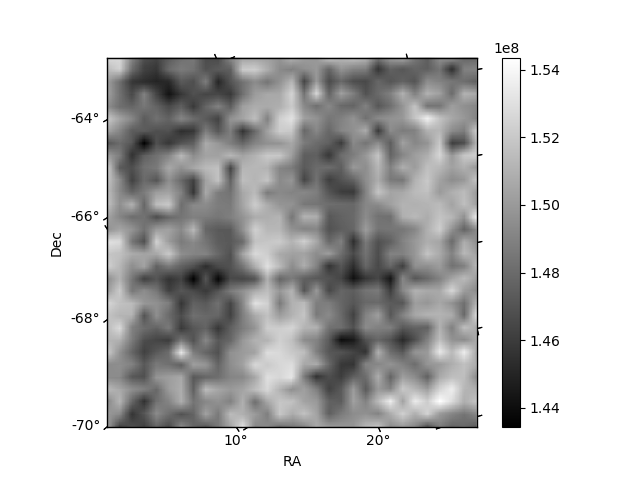
Histogram calculated using DETX and DETY for each event in the final _common_clean file
| Quadrant A | 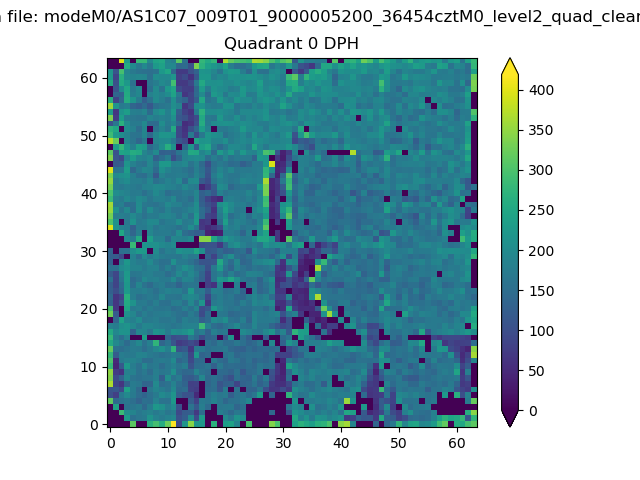 |
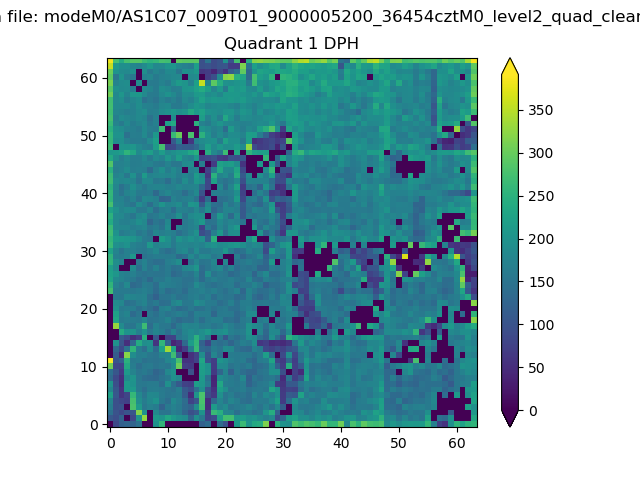 |
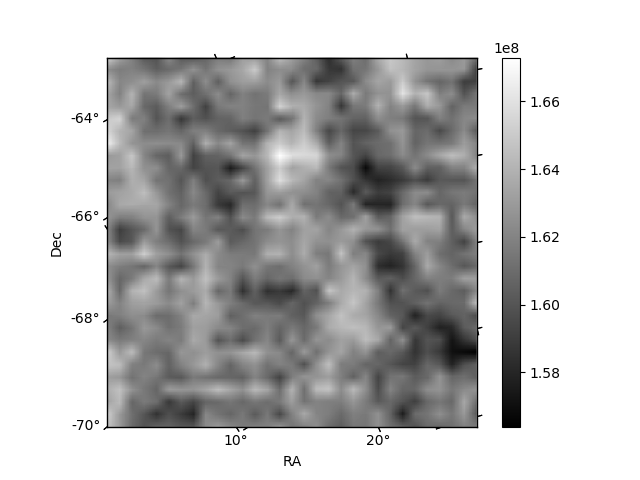
Quadrant B |
|---|---|---|---|
| Quadrant D | 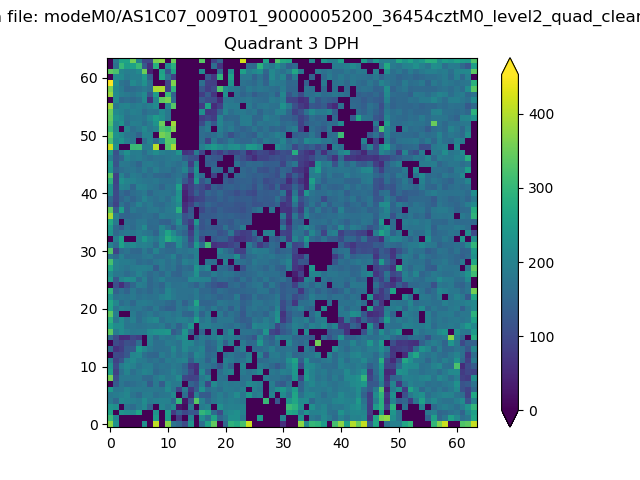 |
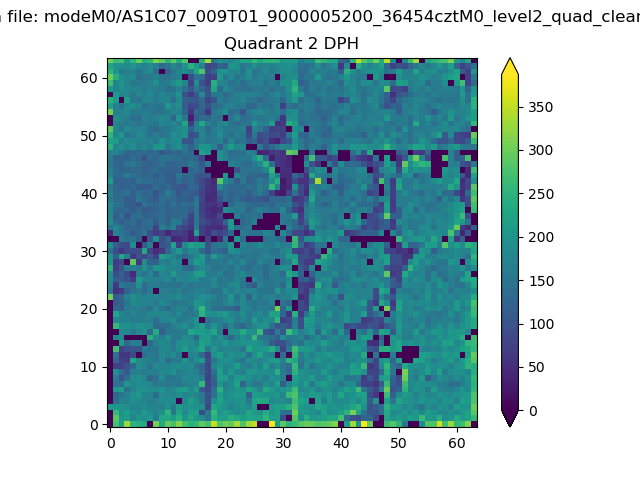 |
Quadrant C |
| Plot type | Count rate plots | Images |
|---|---|---|
| Comparison with Poisson distribution Blue bars denote a histogram of data divided into 1 sec bins. Red curve is a Poisson curve with rate = median count rate of data. |
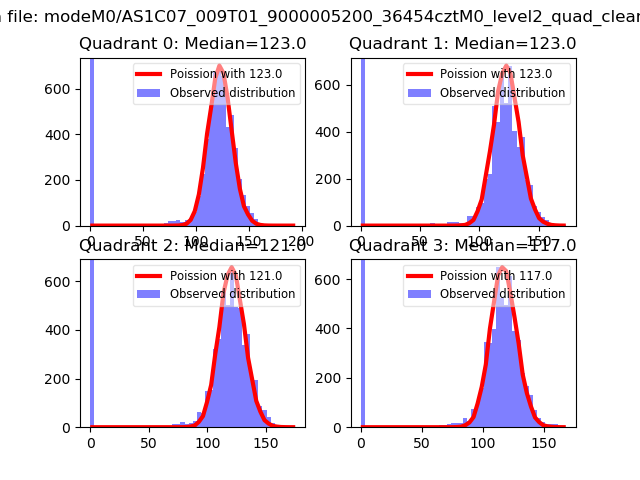 |
 |
| Quadrant-wise count rates Data is divided into 100 sec bins |
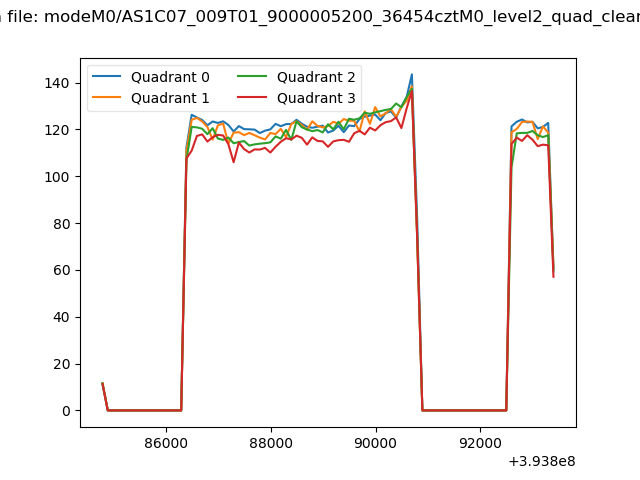 |
|
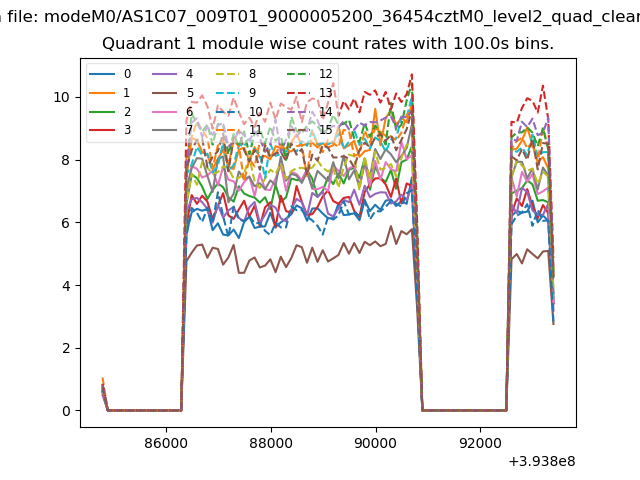
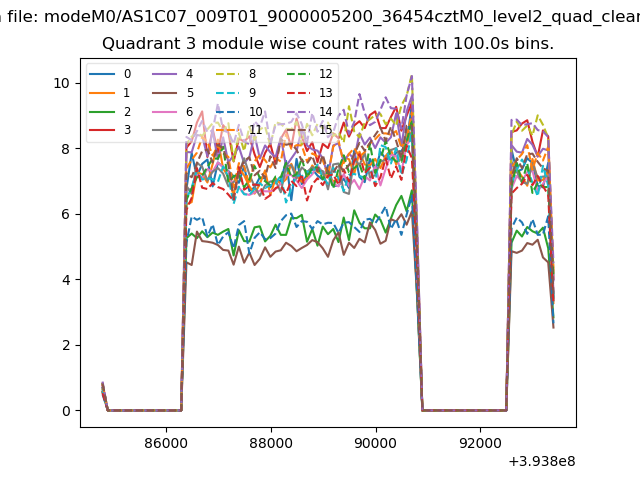
| Module-wise count rates for Quadrant A Data is divided into 100 sec bins |
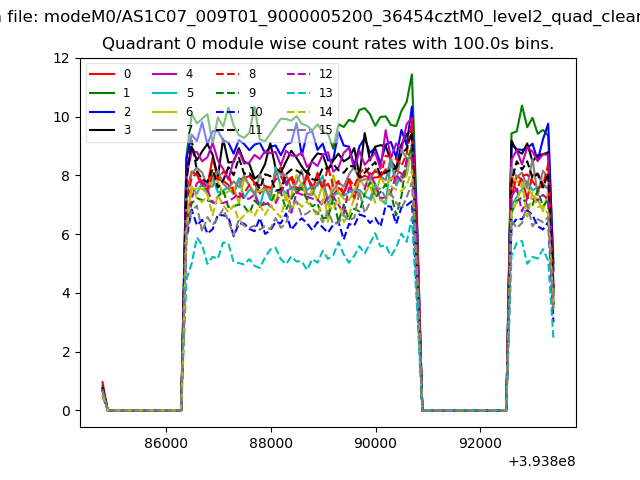 |
 |
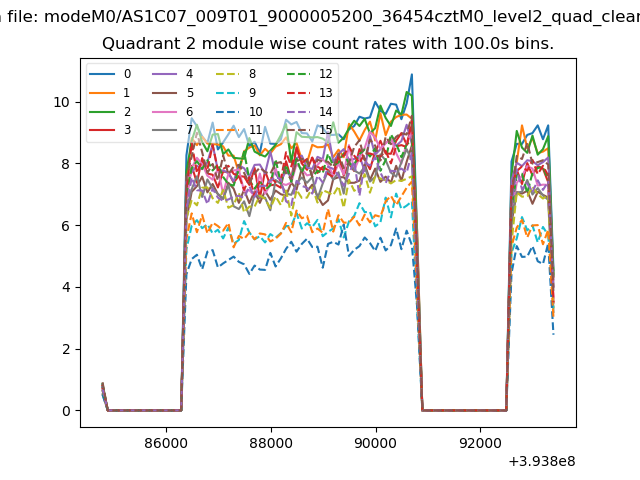
| Module-wise count rates for Quadrant B Data is divided into 100 sec bins |
 |
 |
| Module-wise count rates for Quadrant C Data is divided into 100 sec bins |
 |
 |
| Module-wise count rates for Quadrant D Data is divided into 100 sec bins |
 |
 |
| Parameter | Plot |
|---|---|
| CZT HV Monitor | 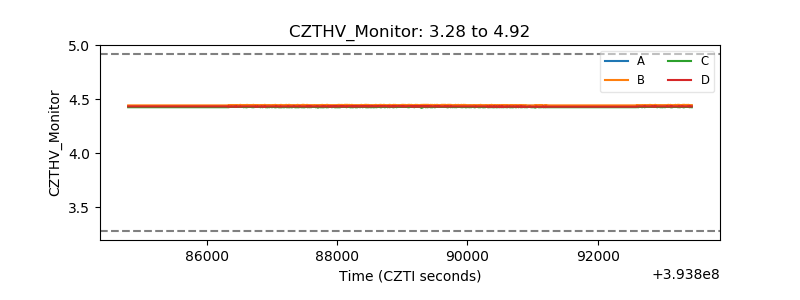 |
| D_VDD | 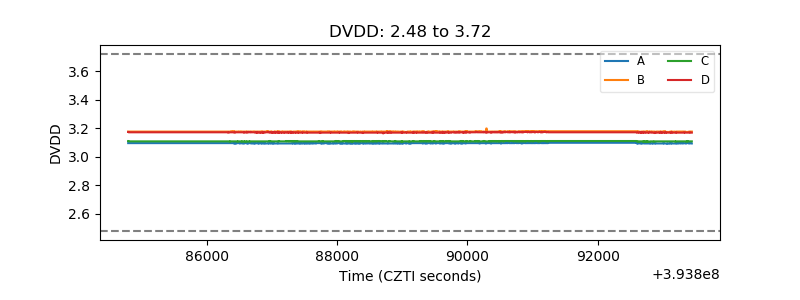 |
| Temperature 1 | 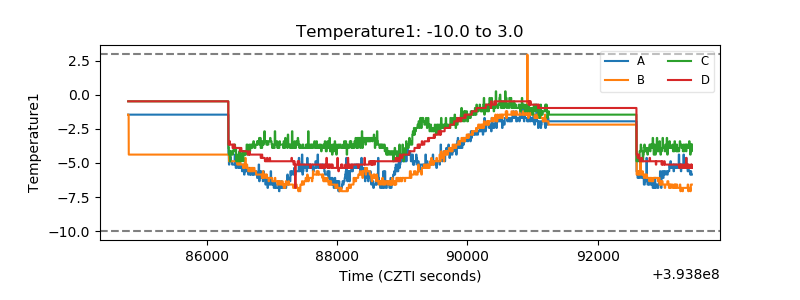 |
| Veto HV Monitor | 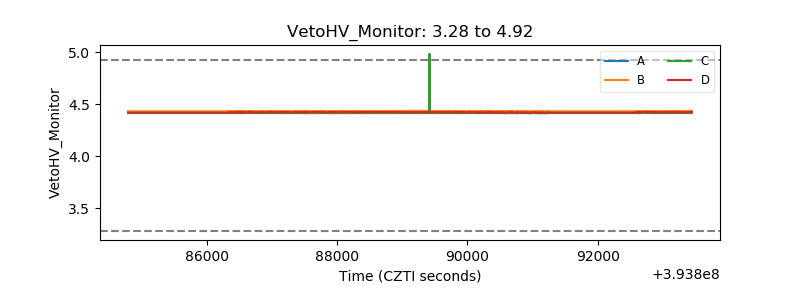 |
| Veto LLD | 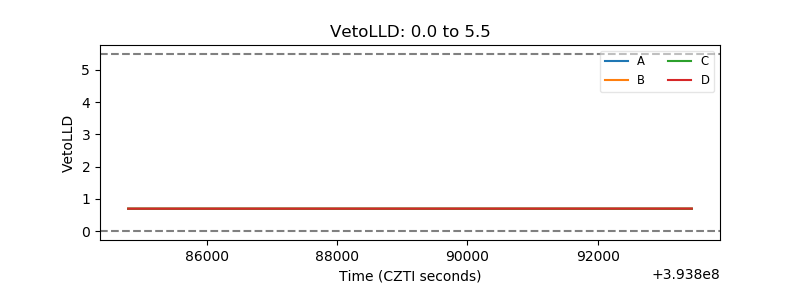 |
| Alpha Counter | 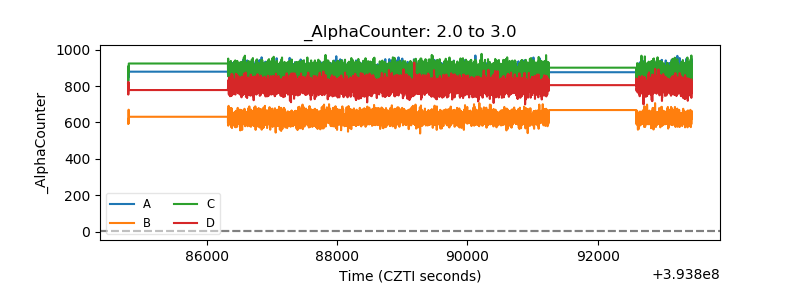 |
| _CPM_Rate | 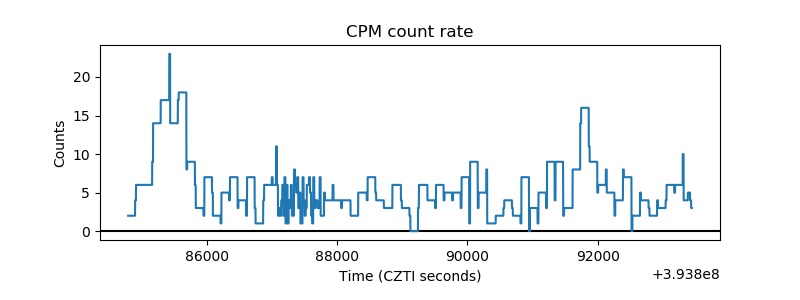 |
| CZT Counter | 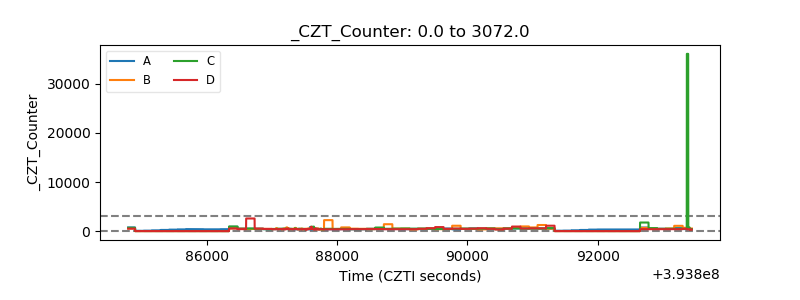 |
| +2.5 Volts monitor | 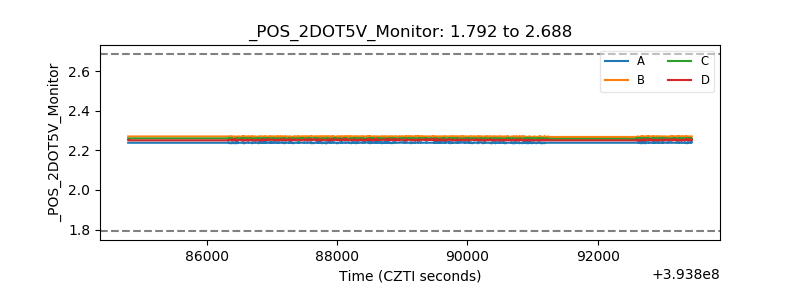 |
| +5 Volts monitor | 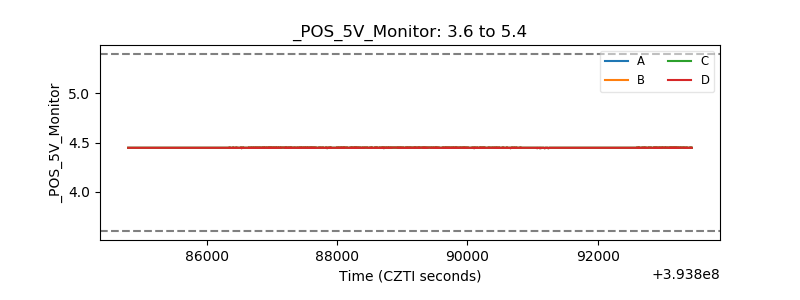 |
| _ROLL_ROT | 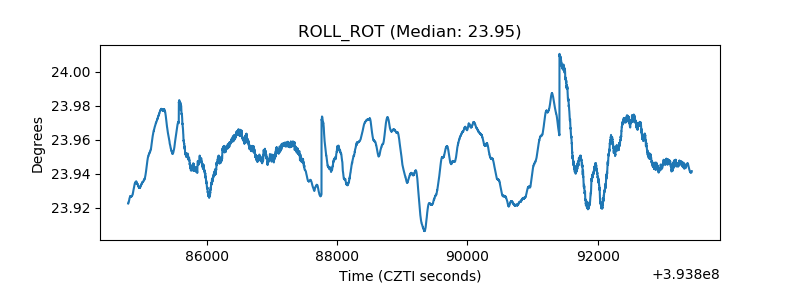 |
| _Roll_DEC | 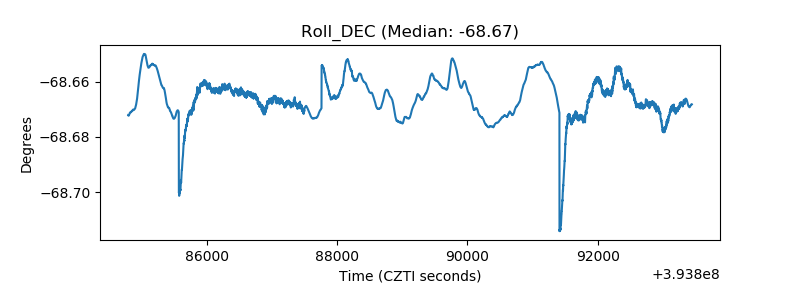 |
| _Roll_RA | 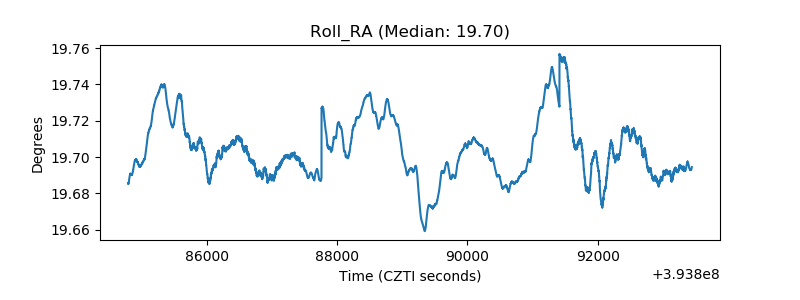 |
| Veto Counter | 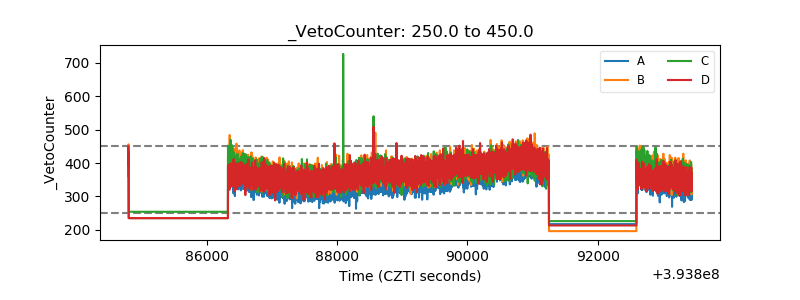 |