| Param | Original file | Final file |
|---|---|---|
| Filename | modeM0/AS1C07_009T01_9000005200_36449cztM0_level2.evt | modeM0/AS1C07_009T01_9000005200_36449cztM0_level2_quad_clean.evt |
| Size (bytes) | 406,621,440 | 71,029,440 |
| Size | 387.8 MB | 67.7 MB |
| Events in quadrant A | 2,743,172 | 461,742 |
| Events in quadrant B | 3,360,439 | 455,315 |
| Events in quadrant C | 2,858,402 | 441,739 |
| Events in quadrant D | 3,001,030 | 429,506 |
| Mode M0 | |||
|---|---|---|---|
| Quadrant | BADHDUFLAG | Total packets | Discarded packets |
| A | 0 | 11235 | 2 |
| B | 0 | 13302 | 1 |
| C | 0 | 11436 | 1 |
| D | 0 | 12258 | 1 |
| Mode SS | |||
|---|---|---|---|
| Quadrant | BADHDUFLAG | Total packets | Discarded packets |
| A | 0 | 104 | 0 |
| B | 0 | 104 | 0 |
| C | 0 | 104 | 0 |
| D | 0 | 104 | 0 |
| Mode M9 | |||
|---|---|---|---|
| Quadrant | BADHDUFLAG | Total packets | Discarded packets |
| A | 0 | 21 | 0 |
| B | 0 | 21 | 0 |
| C | 0 | 21 | 0 |
| D | 0 | 21 | 0 |
| Quadrant | Total seconds | Saturated seconds | Saturation percentage |
|---|---|---|---|
| A | 5178 | 9 | 0.173812% |
| B | 5178 | 122 | 2.356122% |
| C | 5178 | 75 | 1.448436% |
| D | 5178 | 88 | 1.699498% |
Noise dominated data is calculated using 1-second bins in cleaned event files. If a bin has >2000 counts, and if more than 50% of those come from <1% of pixels, then it is considered to be noise-dominated and hence unusable.
| Quadrant | # 1 sec bins | Bins with >0 counts | Bins with >2000 counts | High rate bins dominated by noise | Noise dominated (total time) | Noise dominated (detector-on time) | Marked lightcurve |
|---|---|---|---|---|---|---|---|
| A | 7270 | 5179 | 4 | 4 | 0.06% | 0.08% | 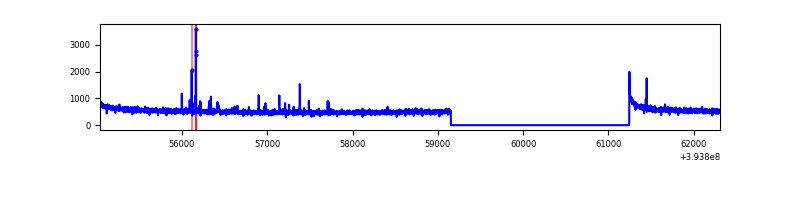 |
| B | 7270 | 5179 | 65 | 65 | 0.89% | 1.26% | 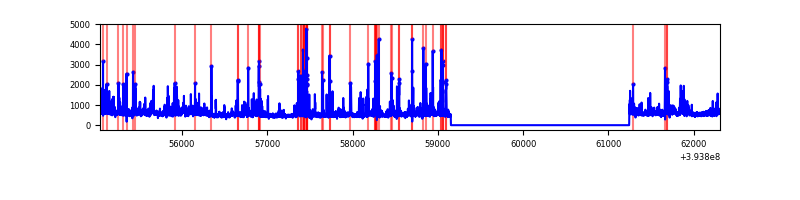 |
| C | 7270 | 5179 | 50 | 50 | 0.69% | 0.97% | 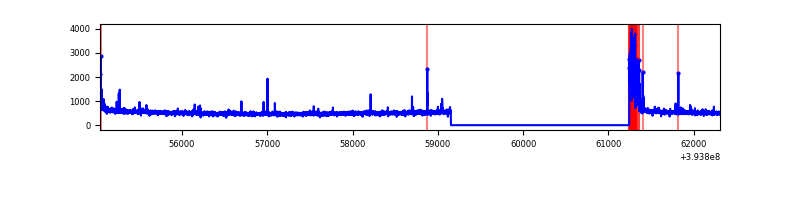 |
| D | 7270 | 5179 | 62 | 62 | 0.85% | 1.20% | 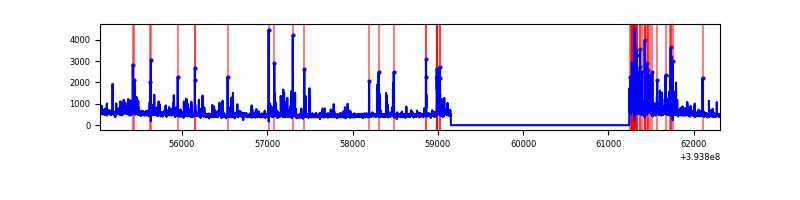 |
Top three noisy pixels from each quadrant. If the there are fewer than three noisy pixels in the level2.evt file, extra rows are filled as -1
| Pixel properties | Quadrant properties | ||||||
|---|---|---|---|---|---|---|---|
| Quadrant | DetID | PixID | Counts | Sigma | Mean | Median | Sigma |
| A | 10 | 83 | 172445 | 1345.18 | 648 | 638 | 127.7 |
| A | 9 | 143 | 44641 | 344.53 | 648 | 638 | 127.7 |
| A | 13 | 6 | 9639 | 70.47 | 648 | 638 | 127.7 |
| B | 5 | 172 | 329675 | 2802.66 | 632 | 619 | 117.4 |
| B | 5 | 255 | 221866 | 1884.42 | 632 | 619 | 117.4 |
| B | 0 | 189 | 86683 | 733.03 | 632 | 619 | 117.4 |
| C | 0 | 10 | 232939 | 1669.19 | 609 | 613 | 139.2 |
| C | 15 | 214 | 224362 | 1607.56 | 609 | 613 | 139.2 |
| C | 0 | 207 | 16193 | 111.94 | 609 | 613 | 139.2 |
| D | 13 | 249 | 220253 | 1465.57 | 620 | 605 | 149.9 |
| D | 13 | 171 | 142271 | 945.25 | 620 | 605 | 149.9 |
| D | 10 | 118 | 60140 | 397.24 | 620 | 605 | 149.9 |
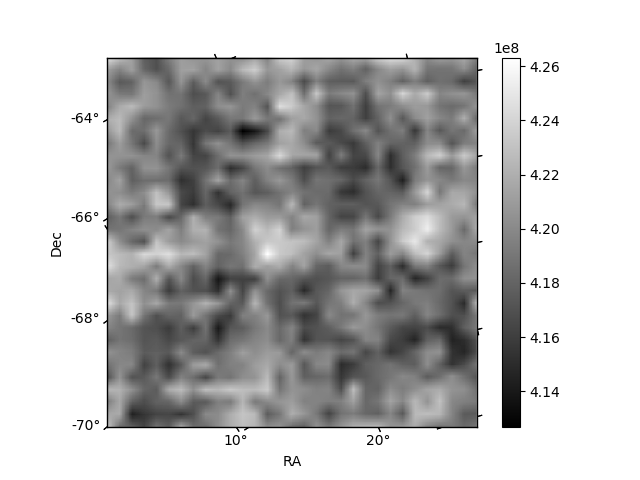
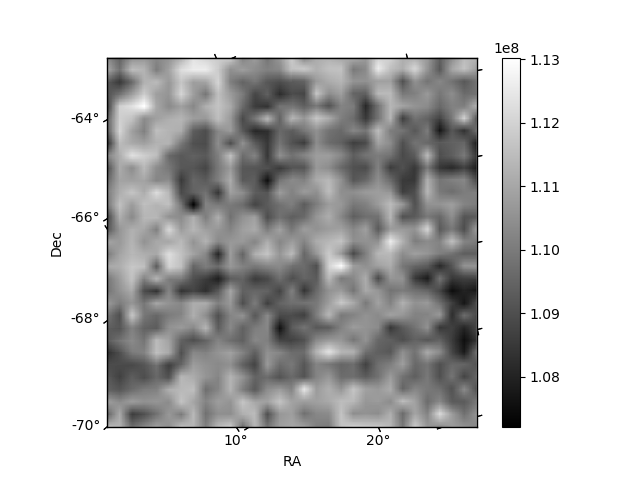
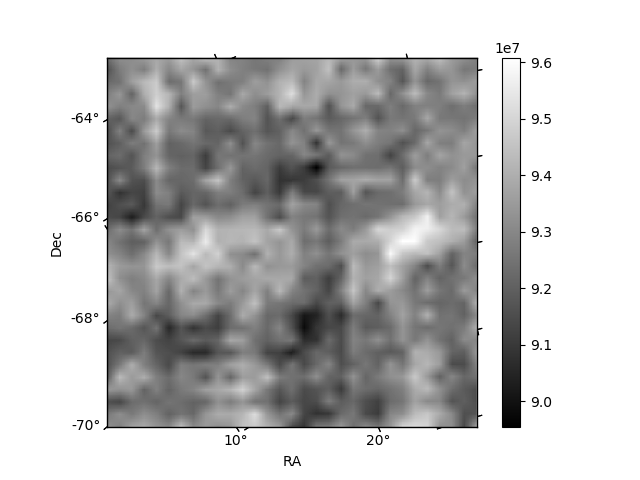
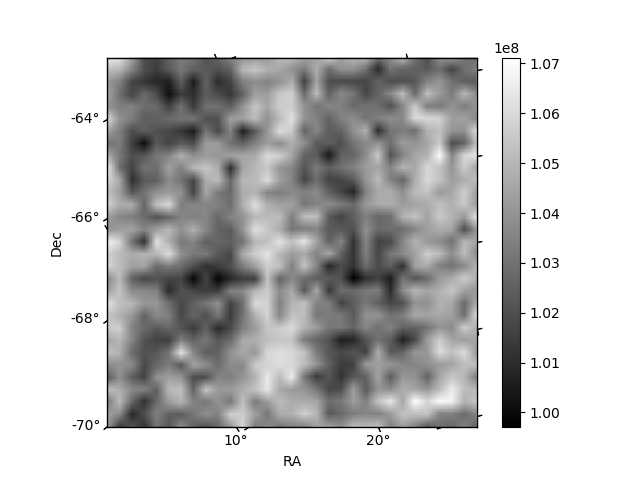
Histogram calculated using DETX and DETY for each event in the final _common_clean file
| Quadrant A | 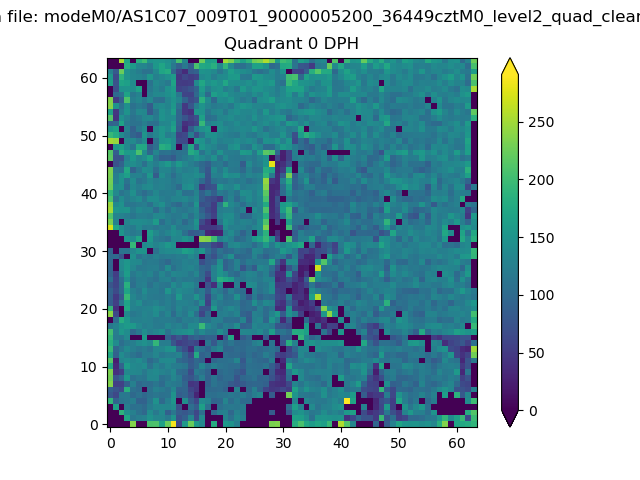 |
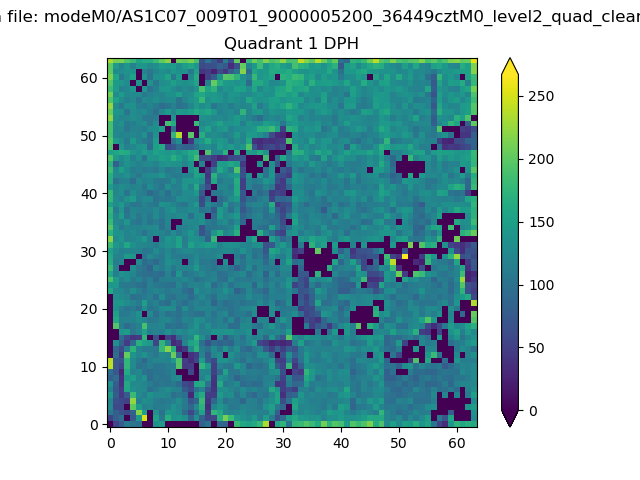 |
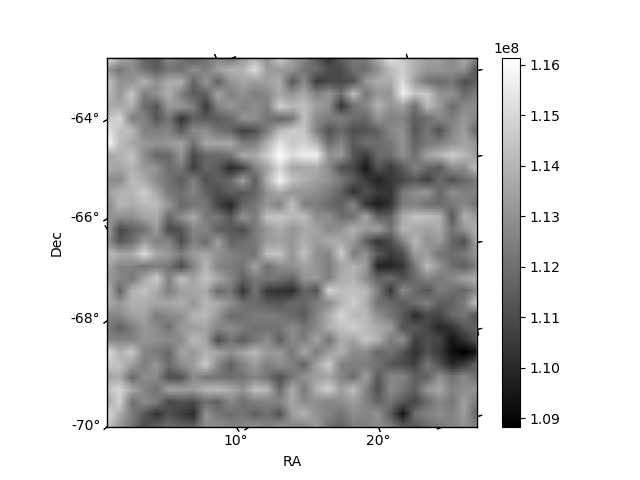
Quadrant B |
|---|---|---|---|
| Quadrant D | 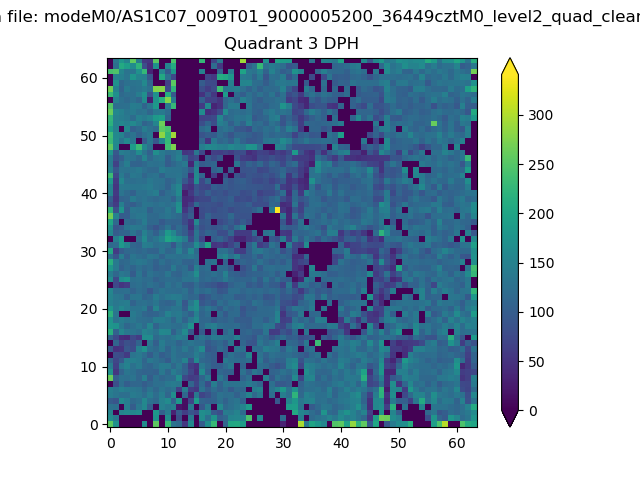 |
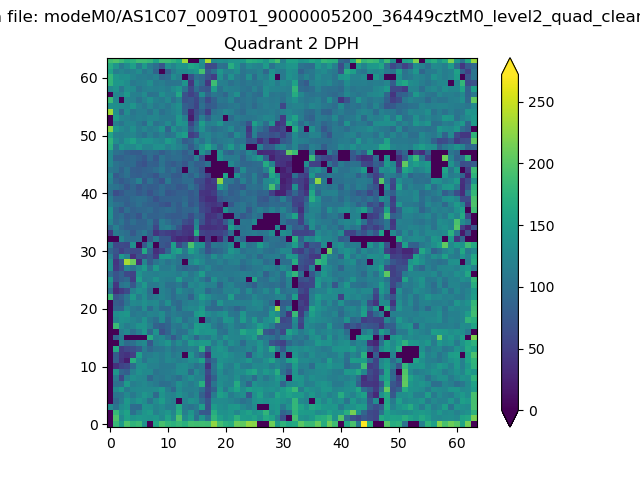 |
Quadrant C |
| Plot type | Count rate plots | Images |
|---|---|---|
| Comparison with Poisson distribution Blue bars denote a histogram of data divided into 1 sec bins. Red curve is a Poisson curve with rate = median count rate of data. |
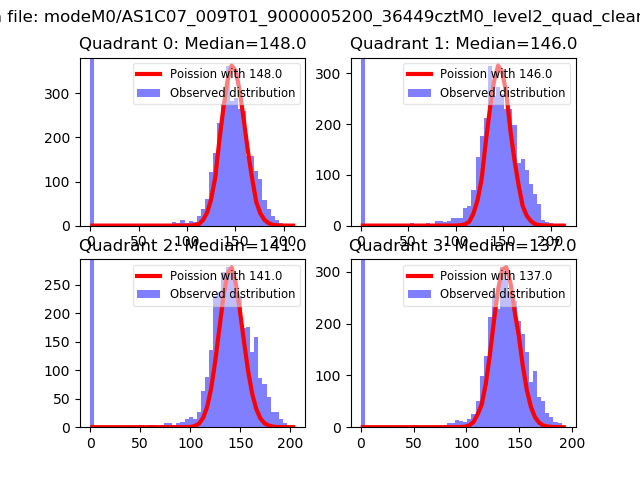 |
 |
| Quadrant-wise count rates Data is divided into 100 sec bins |
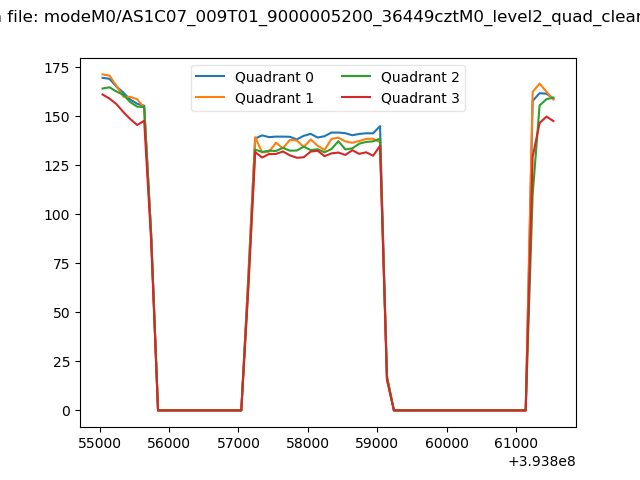 |
|
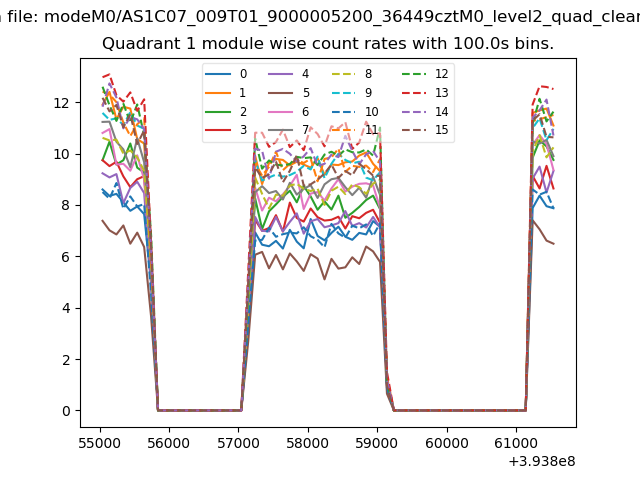
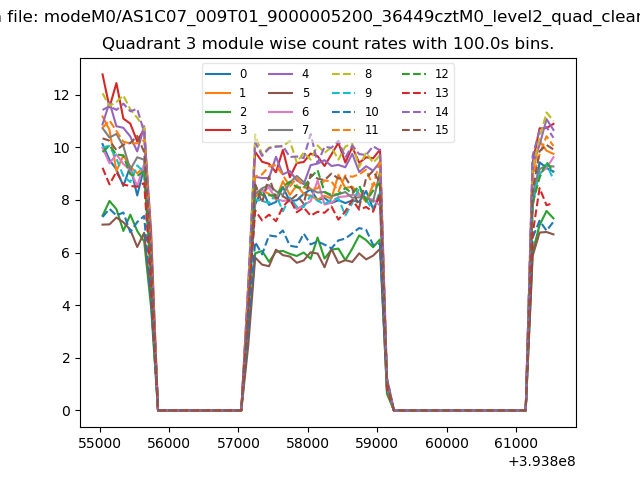
| Module-wise count rates for Quadrant A Data is divided into 100 sec bins |
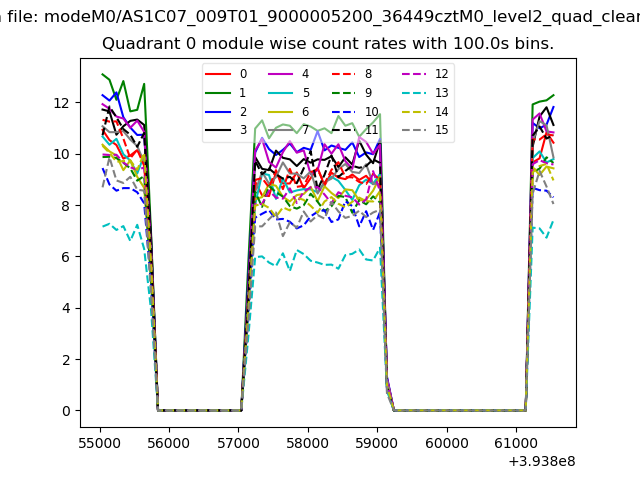 |
 |
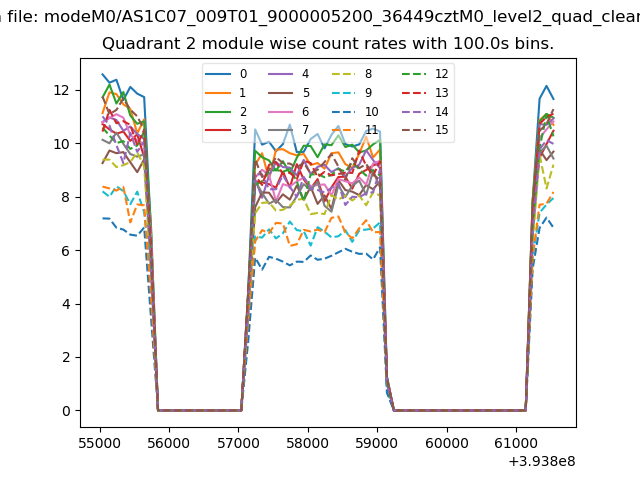
| Module-wise count rates for Quadrant B Data is divided into 100 sec bins |
 |
 |
| Module-wise count rates for Quadrant C Data is divided into 100 sec bins |
 |
 |
| Module-wise count rates for Quadrant D Data is divided into 100 sec bins |
 |
 |
| Parameter | Plot |
|---|---|
| CZT HV Monitor | 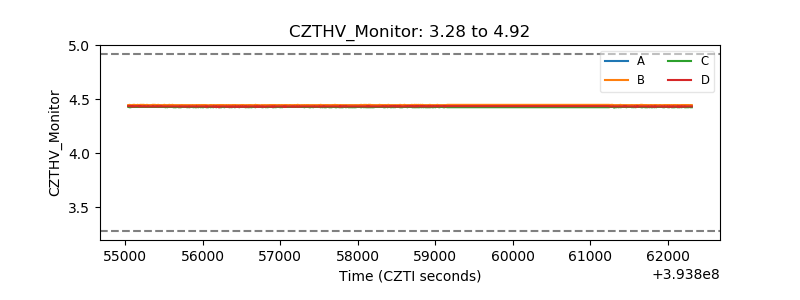 |
| D_VDD | 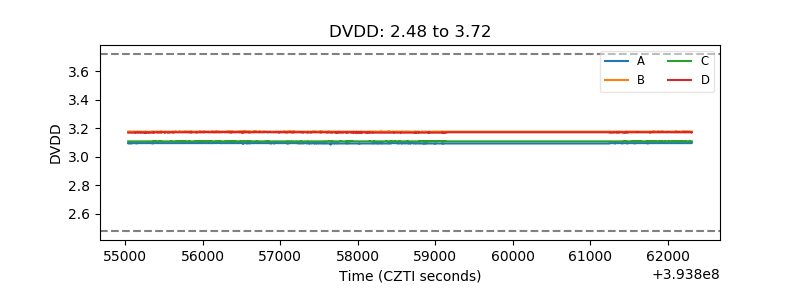 |
| Temperature 1 | 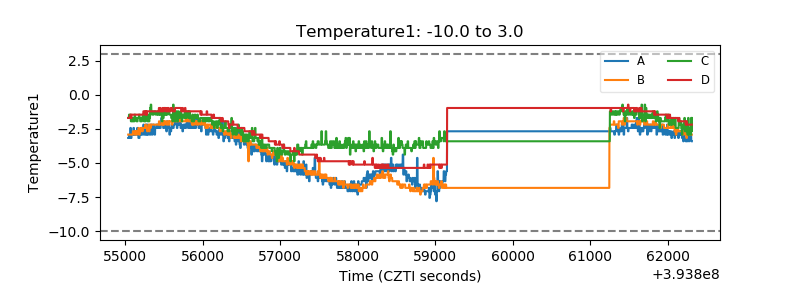 |
| Veto HV Monitor | 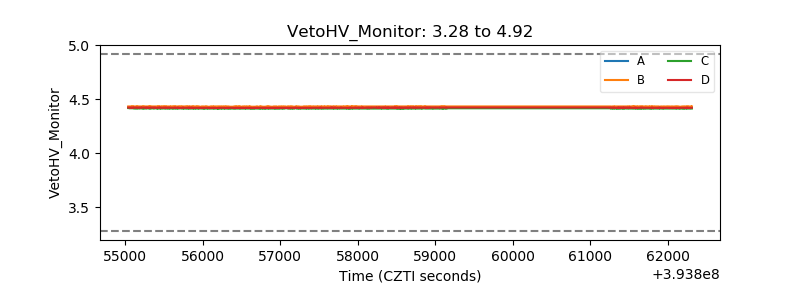 |
| Veto LLD | 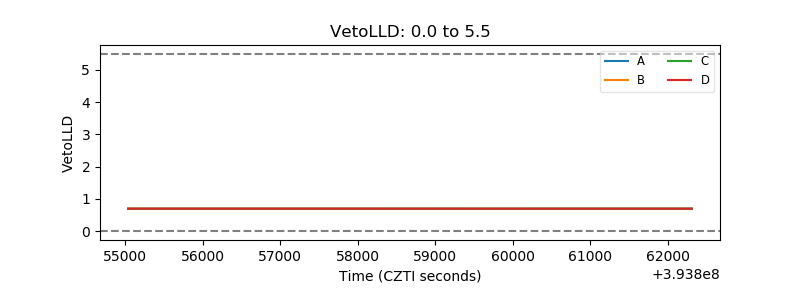 |
| Alpha Counter | 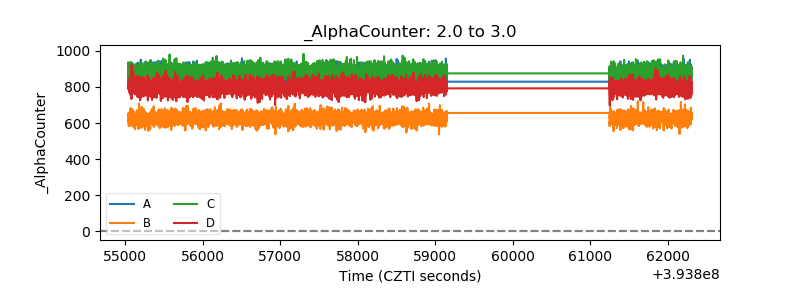 |
| _CPM_Rate | 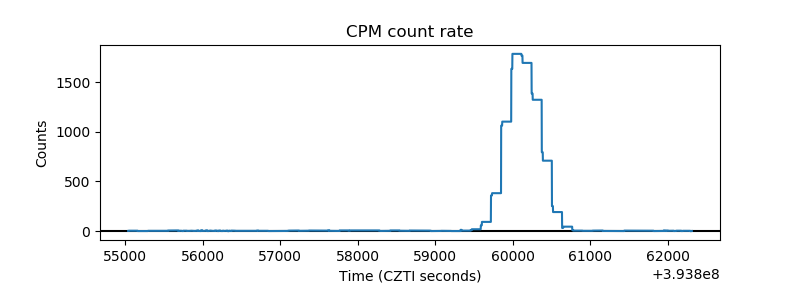 |
| CZT Counter | 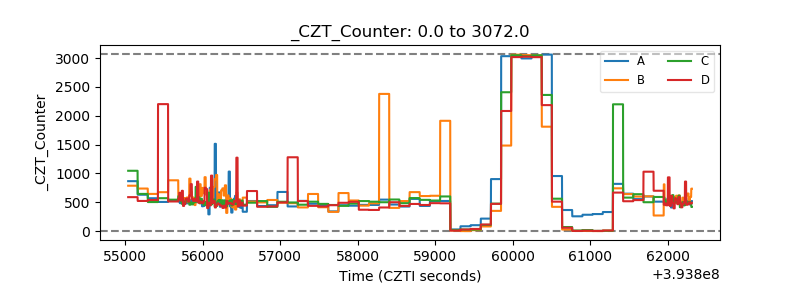 |
| +2.5 Volts monitor | 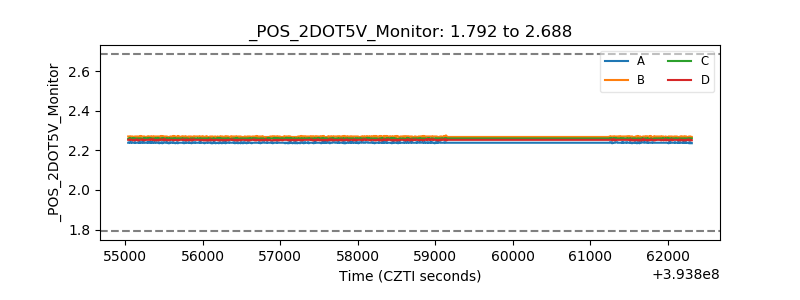 |
| +5 Volts monitor | 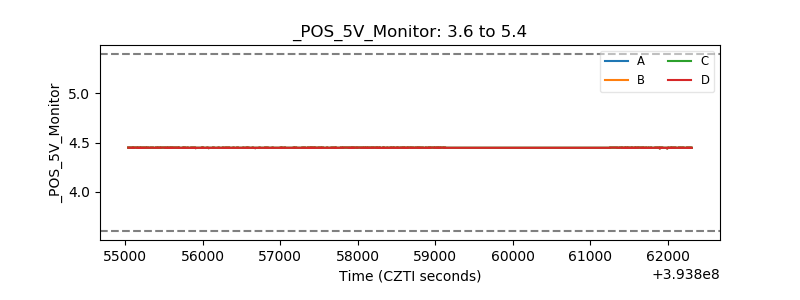 |
| _ROLL_ROT | 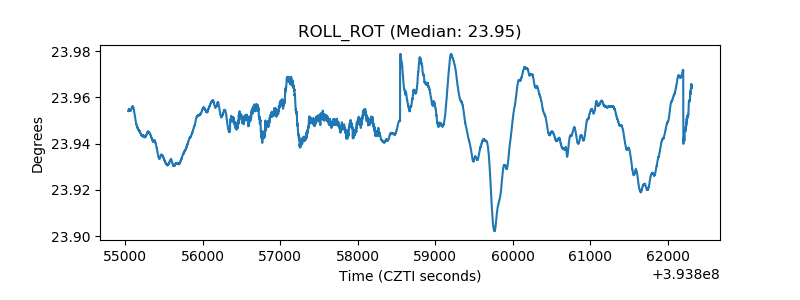 |
| _Roll_DEC | 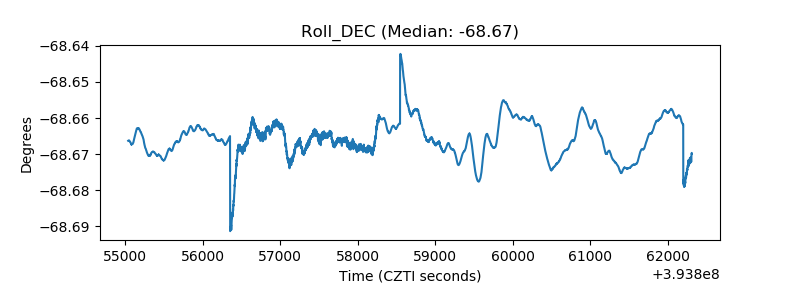 |
| _Roll_RA | 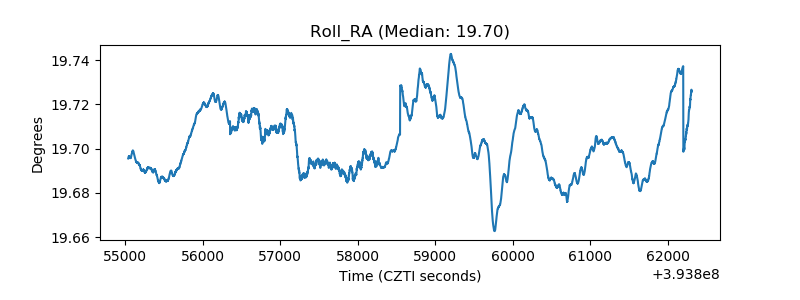 |
| Veto Counter | 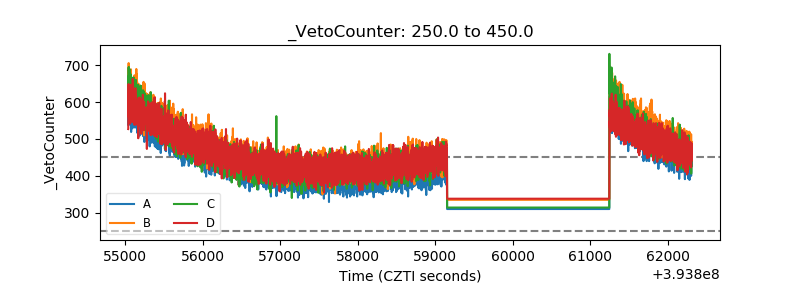 |