| Param | Original file | Final file |
|---|---|---|
| Filename | modeM0/AS1C07_009T01_9000005200_36440cztM0_level2.evt | modeM0/AS1C07_009T01_9000005200_36440cztM0_level2_quad_clean.evt |
| Size (bytes) | 484,456,320 | 96,598,080 |
| Size | 462.0 MB | 92.1 MB |
| Events in quadrant A | 2,939,481 | 639,785 |
| Events in quadrant B | 4,602,515 | 630,236 |
| Events in quadrant C | 3,527,853 | 618,873 |
| Events in quadrant D | 3,182,543 | 605,369 |
| Mode M0 | |||
|---|---|---|---|
| Quadrant | BADHDUFLAG | Total packets | Discarded packets |
| A | 0 | 12747 | 3 |
| B | 0 | 17841 | 2 |
| C | 0 | 14218 | 2 |
| D | 0 | 13776 | 2 |
| Mode SS | |||
|---|---|---|---|
| Quadrant | BADHDUFLAG | Total packets | Discarded packets |
| A | 0 | 128 | 0 |
| B | 0 | 128 | 0 |
| C | 0 | 128 | 0 |
| D | 0 | 128 | 0 |
| Mode M9 | |||
|---|---|---|---|
| Quadrant | BADHDUFLAG | Total packets | Discarded packets |
| A | 0 | 27 | 0 |
| B | 0 | 27 | 0 |
| C | 0 | 27 | 0 |
| D | 0 | 27 | 0 |
| Quadrant | Total seconds | Saturated seconds | Saturation percentage |
|---|---|---|---|
| A | 6173 | 15 | 0.242994% |
| B | 6173 | 507 | 8.213186% |
| C | 6173 | 141 | 2.284141% |
| D | 6173 | 77 | 1.247368% |
Noise dominated data is calculated using 1-second bins in cleaned event files. If a bin has >2000 counts, and if more than 50% of those come from <1% of pixels, then it is considered to be noise-dominated and hence unusable.
| Quadrant | # 1 sec bins | Bins with >0 counts | Bins with >2000 counts | High rate bins dominated by noise | Noise dominated (total time) | Noise dominated (detector-on time) | Marked lightcurve |
|---|---|---|---|---|---|---|---|
| A | 8889 | 6175 | 1 | 1 | 0.01% | 0.02% | 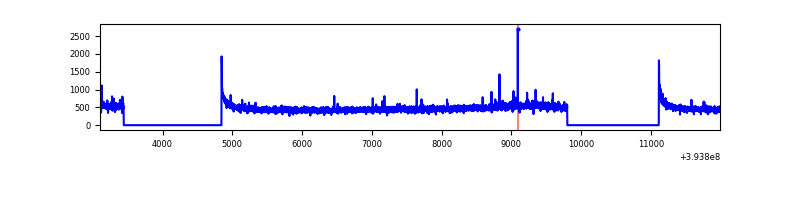 |
| B | 8889 | 6175 | 285 | 285 | 3.21% | 4.62% | 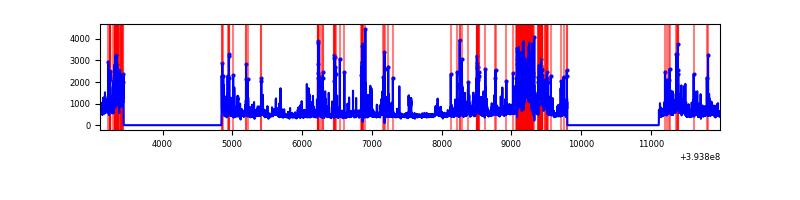 |
| C | 8889 | 6175 | 94 | 94 | 1.06% | 1.52% | 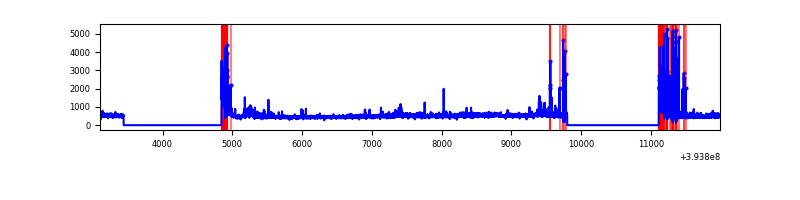 |
| D | 8889 | 6175 | 59 | 59 | 0.66% | 0.96% | 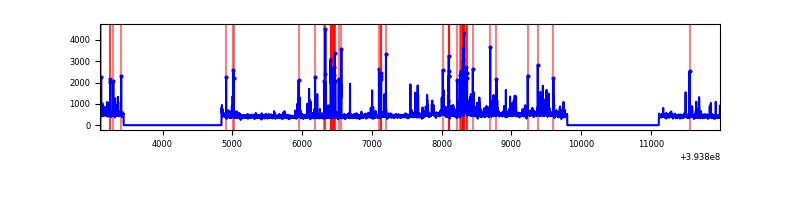 |
Top three noisy pixels from each quadrant. If the there are fewer than three noisy pixels in the level2.evt file, extra rows are filled as -1
| Pixel properties | Quadrant properties | ||||||
|---|---|---|---|---|---|---|---|
| Quadrant | DetID | PixID | Counts | Sigma | Mean | Median | Sigma |
| A | 10 | 83 | 205008 | 1444.15 | 699 | 684 | 141.5 |
| A | 10 | 255 | 17956 | 122.07 | 699 | 684 | 141.5 |
| A | 13 | 254 | 11803 | 78.59 | 699 | 684 | 141.5 |
| B | 5 | 172 | 1114092 | 8678.69 | 667 | 648 | 128.3 |
| B | 5 | 255 | 401381 | 3123.5 | 667 | 648 | 128.3 |
| B | 0 | 189 | 157787 | 1224.81 | 667 | 648 | 128.3 |
| C | 0 | 10 | 312170 | 2008.05 | 672 | 675 | 155.1 |
| C | 0 | 207 | 310211 | 1995.42 | 672 | 675 | 155.1 |
| C | 15 | 214 | 262143 | 1685.55 | 672 | 675 | 155.1 |
| D | 13 | 171 | 114276 | 687.38 | 680 | 660 | 165.3 |
| D | 10 | 118 | 107214 | 644.65 | 680 | 660 | 165.3 |
| D | 2 | 250 | 104999 | 631.25 | 680 | 660 | 165.3 |
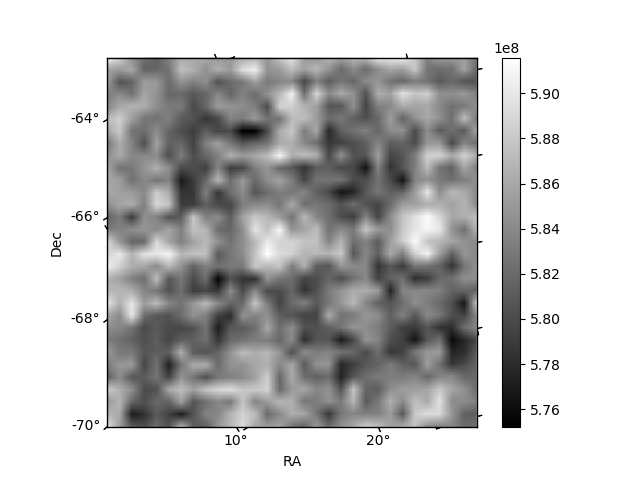
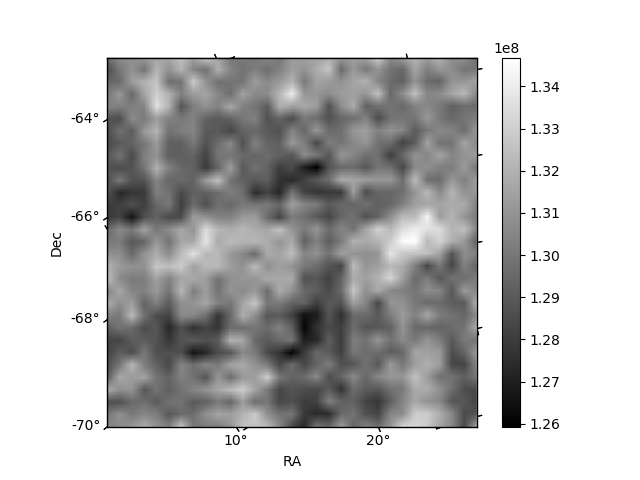
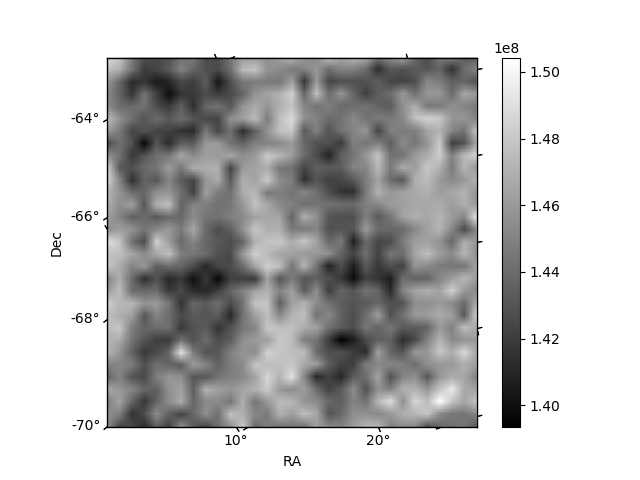
Histogram calculated using DETX and DETY for each event in the final _common_clean file
| Quadrant A | 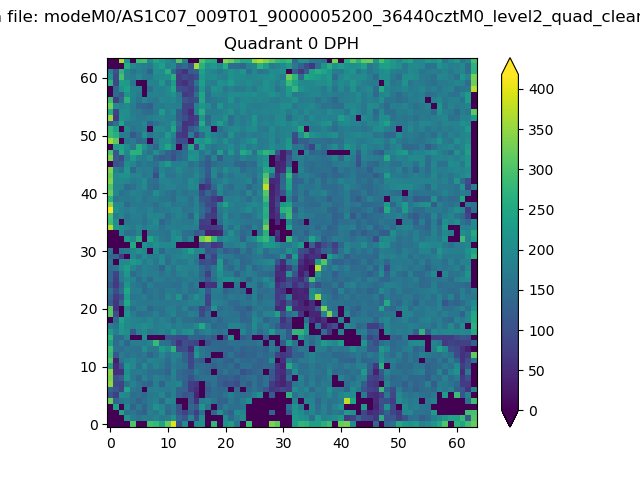 |
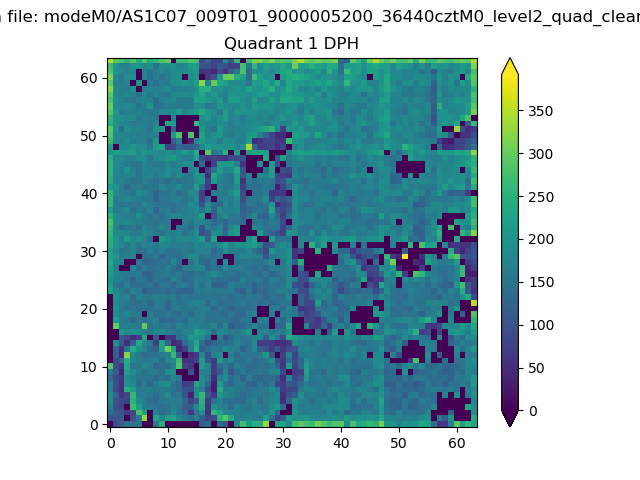 |
Quadrant B |
|---|---|---|---|
| Quadrant D | 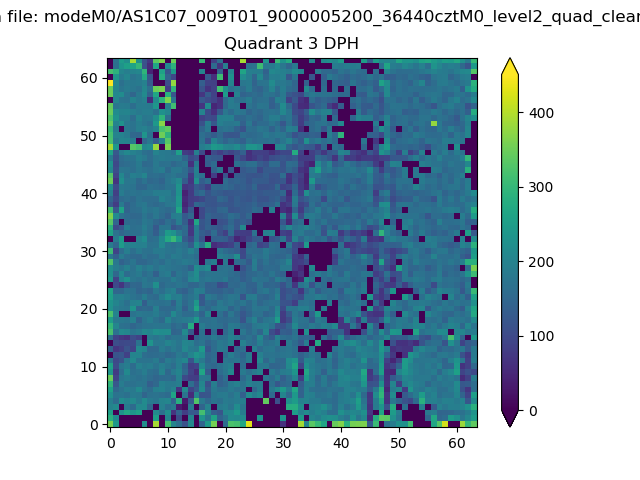 |
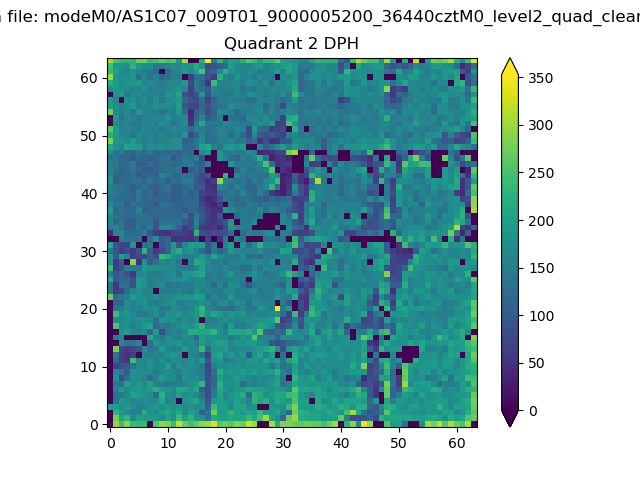 |
Quadrant C |
| Plot type | Count rate plots | Images |
|---|---|---|
| Comparison with Poisson distribution Blue bars denote a histogram of data divided into 1 sec bins. Red curve is a Poisson curve with rate = median count rate of data. |
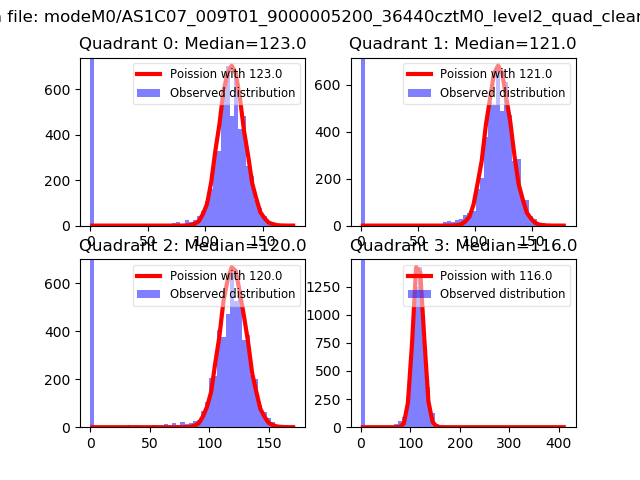 |
 |
| Quadrant-wise count rates Data is divided into 100 sec bins |
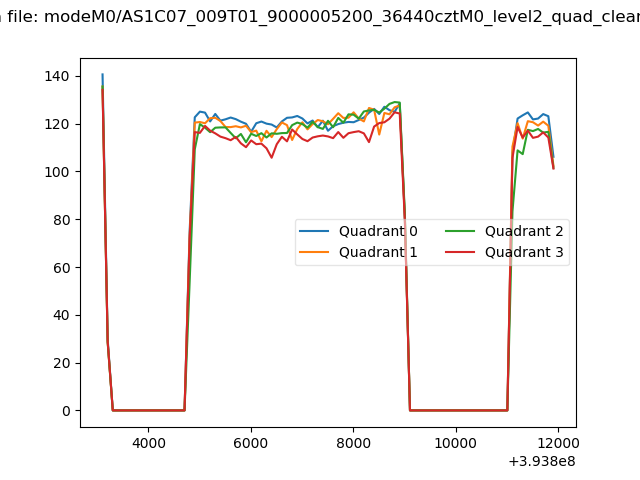 |
|
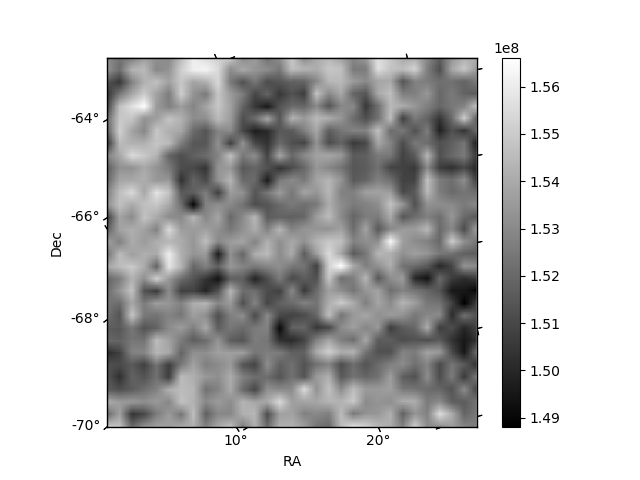
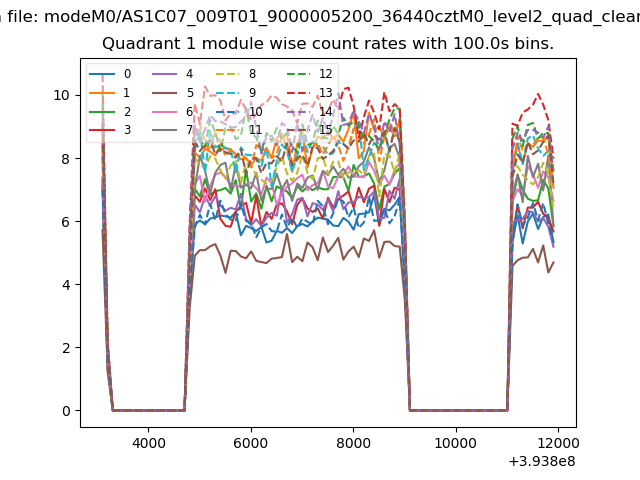
| Module-wise count rates for Quadrant A Data is divided into 100 sec bins |
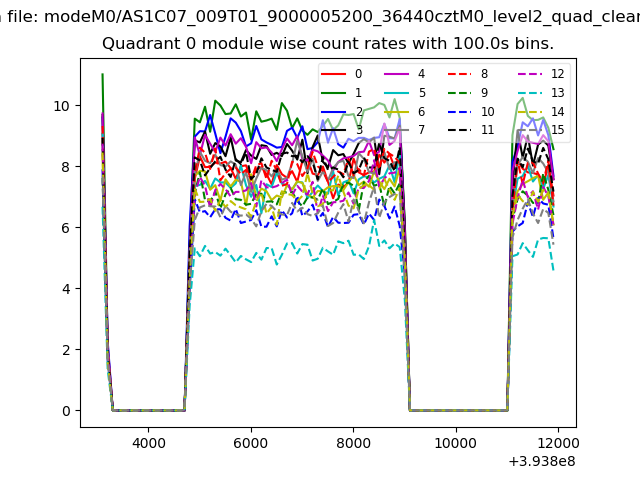 |
 |
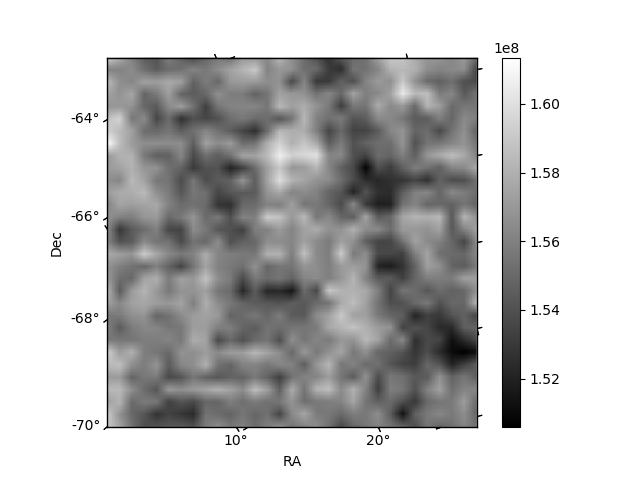
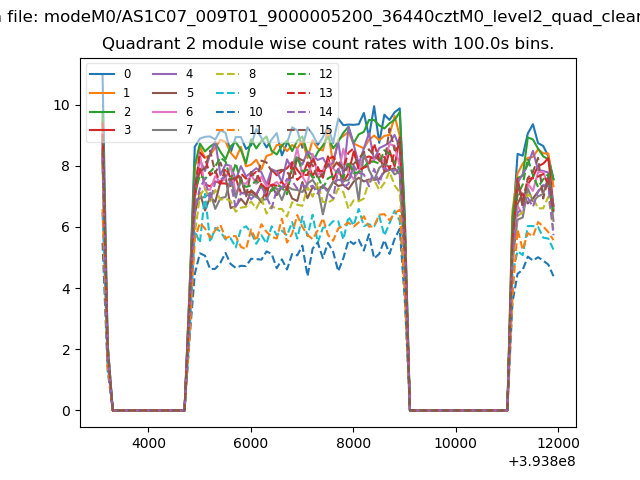
| Module-wise count rates for Quadrant B Data is divided into 100 sec bins |
 |
 |
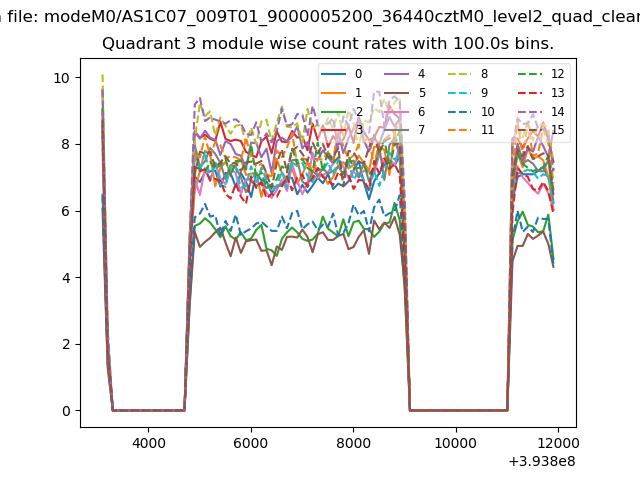
| Module-wise count rates for Quadrant C Data is divided into 100 sec bins |
 |
 |
| Module-wise count rates for Quadrant D Data is divided into 100 sec bins |
 |
 |
| Parameter | Plot |
|---|---|
| CZT HV Monitor | 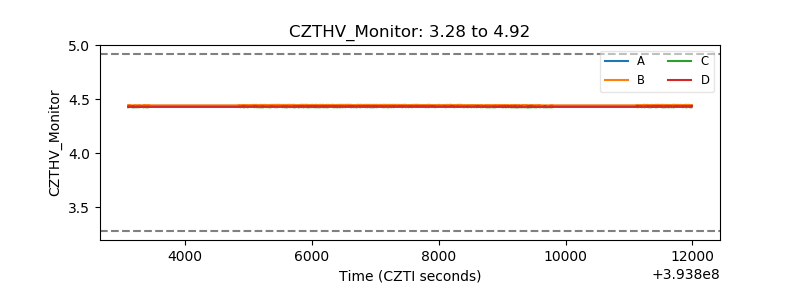 |
| D_VDD | 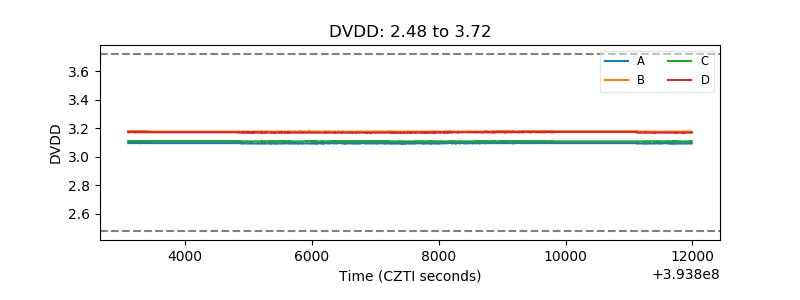 |
| Temperature 1 | 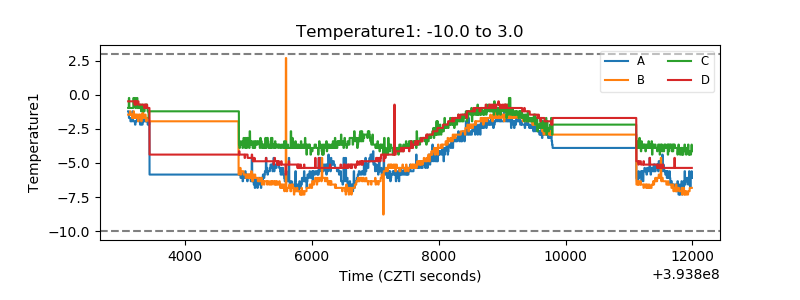 |
| Veto HV Monitor | 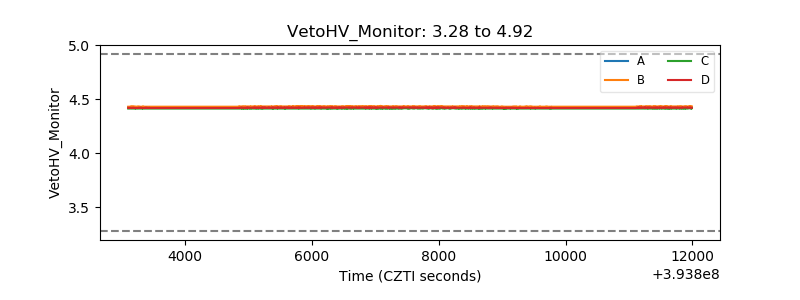 |
| Veto LLD | 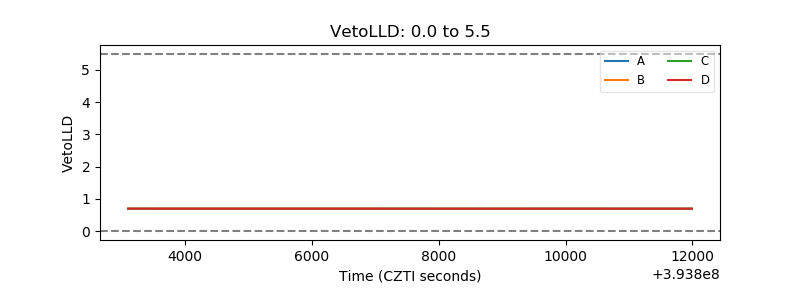 |
| Alpha Counter | 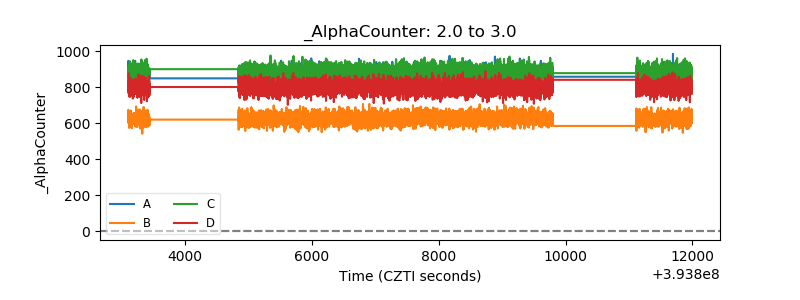 |
| _CPM_Rate | 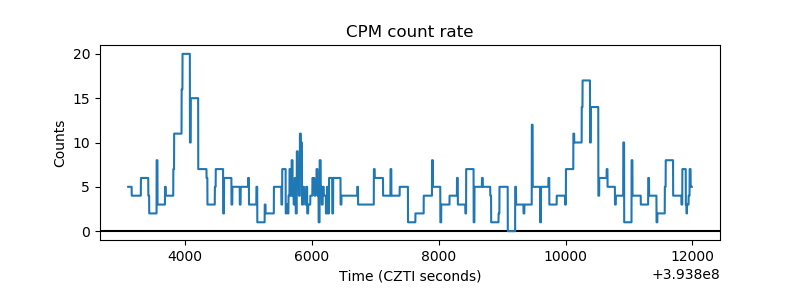 |
| CZT Counter | 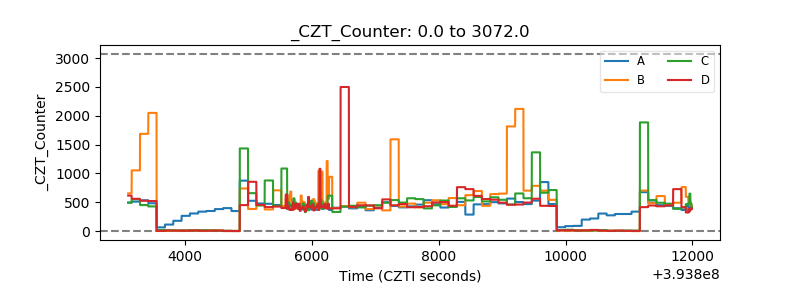 |
| +2.5 Volts monitor | 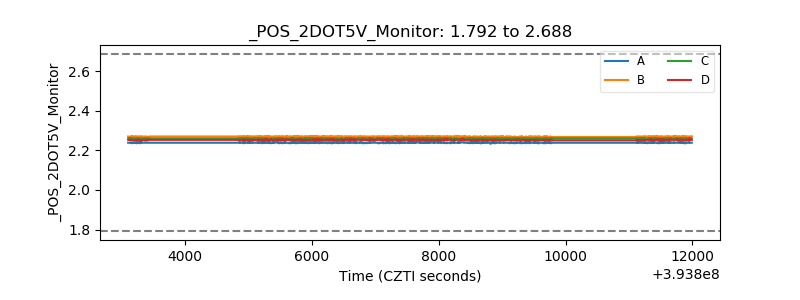 |
| +5 Volts monitor | 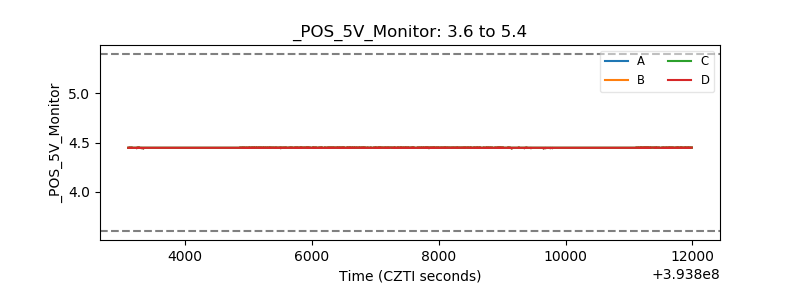 |
| _ROLL_ROT | 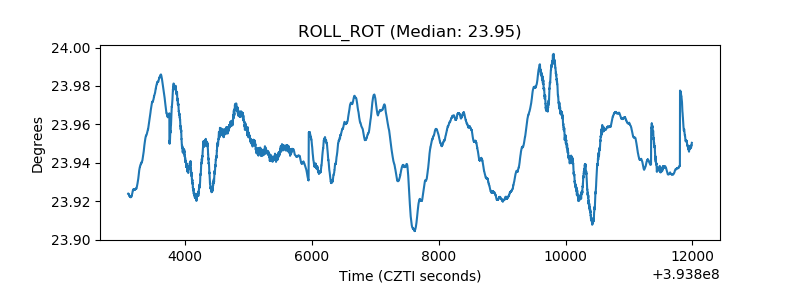 |
| _Roll_DEC | 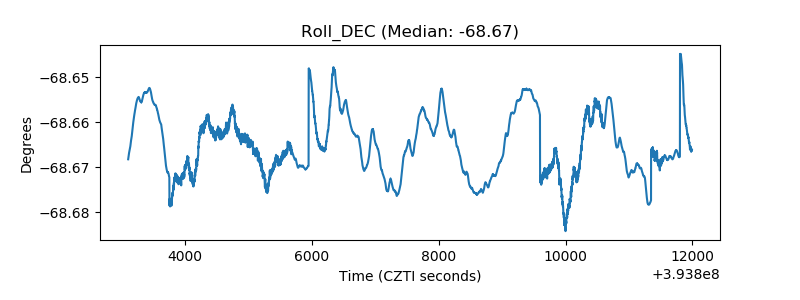 |
| _Roll_RA | 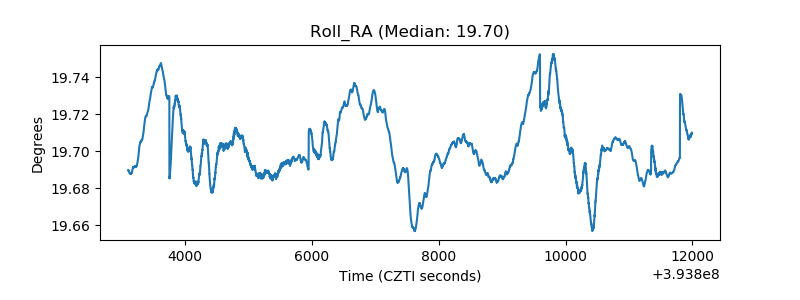 |
| Veto Counter | 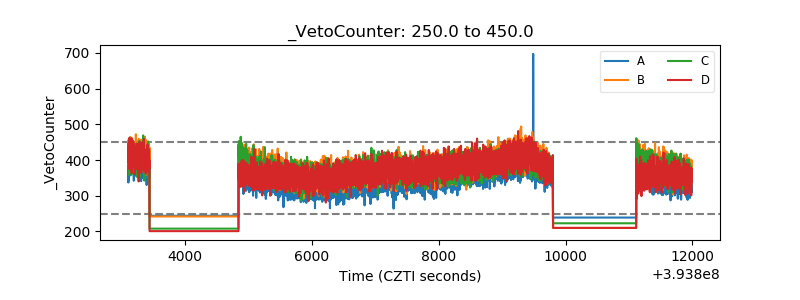 |