| Param | Original file | Final file |
|---|---|---|
| Filename | modeM0/AS1C07_009T01_9000005200_36438cztM0_level2.evt | modeM0/AS1C07_009T01_9000005200_36438cztM0_level2_quad_clean.evt |
| Size (bytes) | 413,360,640 | 86,610,240 |
| Size | 394.2 MB | 82.6 MB |
| Events in quadrant A | 2,545,365 | 576,185 |
| Events in quadrant B | 3,724,019 | 566,325 |
| Events in quadrant C | 2,938,843 | 560,290 |
| Events in quadrant D | 2,944,696 | 543,575 |
| Mode M0 | |||
|---|---|---|---|
| Quadrant | BADHDUFLAG | Total packets | Discarded packets |
| A | 0 | 11136 | 3 |
| B | 0 | 14640 | 2 |
| C | 0 | 11994 | 2 |
| D | 0 | 12555 | 2 |
| Mode SS | |||
|---|---|---|---|
| Quadrant | BADHDUFLAG | Total packets | Discarded packets |
| A | 0 | 110 | 0 |
| B | 0 | 110 | 0 |
| C | 0 | 110 | 0 |
| D | 0 | 110 | 0 |
| Mode M9 | |||
|---|---|---|---|
| Quadrant | BADHDUFLAG | Total packets | Discarded packets |
| A | 0 | 19 | 0 |
| B | 0 | 19 | 0 |
| C | 0 | 19 | 0 |
| D | 0 | 20 | 0 |
| Quadrant | Total seconds | Saturated seconds | Saturation percentage |
|---|---|---|---|
| A | 5375 | 7 | 0.130233% |
| B | 5375 | 320 | 5.953488% |
| C | 5375 | 98 | 1.823256% |
| D | 5375 | 87 | 1.618605% |
Noise dominated data is calculated using 1-second bins in cleaned event files. If a bin has >2000 counts, and if more than 50% of those come from <1% of pixels, then it is considered to be noise-dominated and hence unusable.
| Quadrant | # 1 sec bins | Bins with >0 counts | Bins with >2000 counts | High rate bins dominated by noise | Noise dominated (total time) | Noise dominated (detector-on time) | Marked lightcurve |
|---|---|---|---|---|---|---|---|
| A | 7079 | 5376 | 2 | 2 | 0.03% | 0.04% | 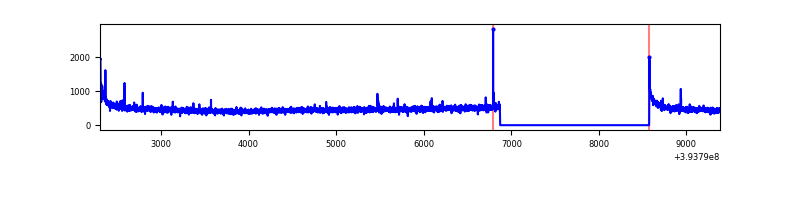 |
| B | 7079 | 5376 | 197 | 197 | 2.78% | 3.66% | 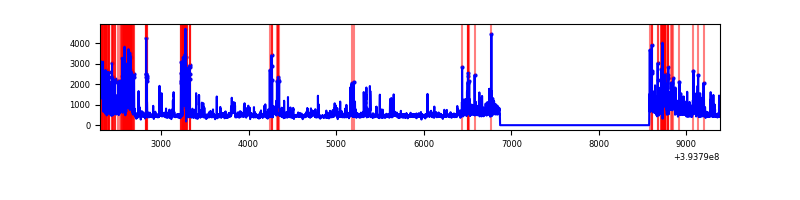 |
| C | 7079 | 5376 | 66 | 66 | 0.93% | 1.23% | 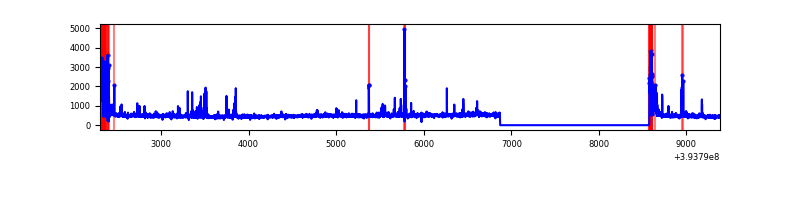 |
| D | 7079 | 5376 | 78 | 78 | 1.10% | 1.45% | 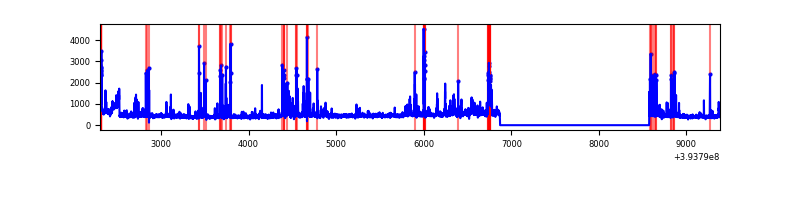 |
Top three noisy pixels from each quadrant. If the there are fewer than three noisy pixels in the level2.evt file, extra rows are filled as -1
| Pixel properties | Quadrant properties | ||||||
|---|---|---|---|---|---|---|---|
| Quadrant | DetID | PixID | Counts | Sigma | Mean | Median | Sigma |
| A | 10 | 83 | 190074 | 1557.17 | 601 | 590 | 121.7 |
| A | 7 | 3 | 16981 | 134.7 | 601 | 590 | 121.7 |
| A | 13 | 254 | 9266 | 71.3 | 601 | 590 | 121.7 |
| B | 5 | 172 | 629430 | 5644.45 | 584 | 568 | 111.4 |
| B | 0 | 190 | 181932 | 1627.86 | 584 | 568 | 111.4 |
| B | 0 | 189 | 158366 | 1416.34 | 584 | 568 | 111.4 |
| C | 0 | 10 | 266320 | 1986.39 | 579 | 582 | 133.8 |
| C | 15 | 214 | 229393 | 1710.36 | 579 | 582 | 133.8 |
| C | 0 | 207 | 72924 | 540.76 | 579 | 582 | 133.8 |
| D | 13 | 249 | 226078 | 1603.76 | 582 | 564 | 140.6 |
| D | 2 | 250 | 102485 | 724.82 | 582 | 564 | 140.6 |
| D | 13 | 171 | 80703 | 569.91 | 582 | 564 | 140.6 |
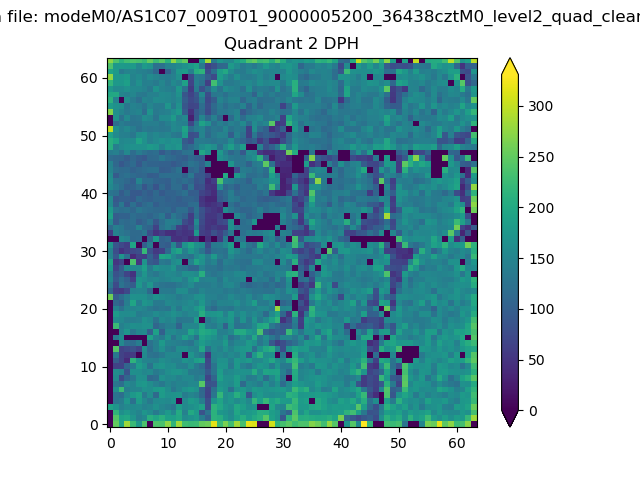
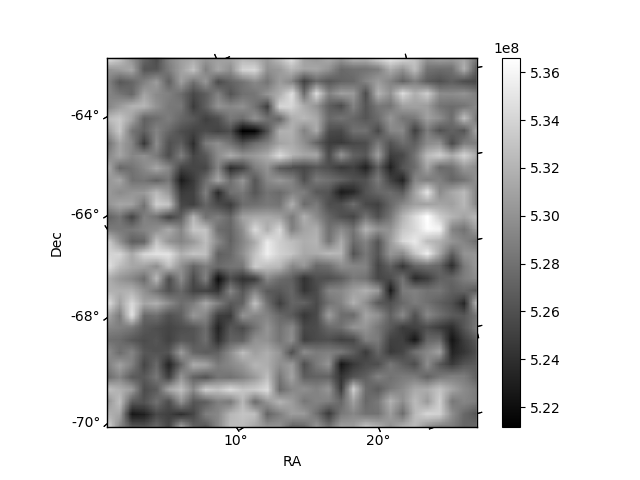
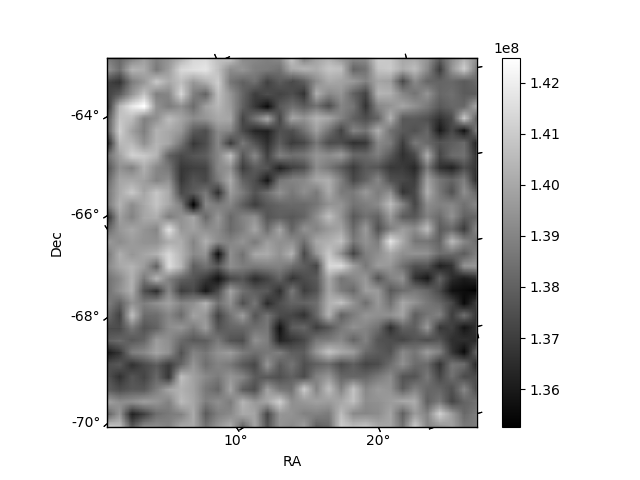
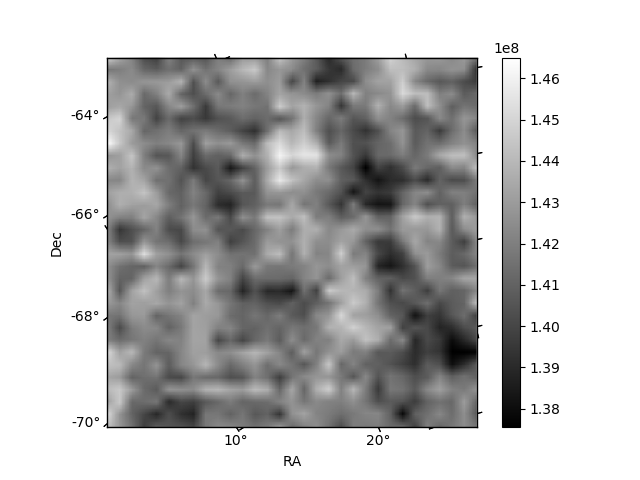
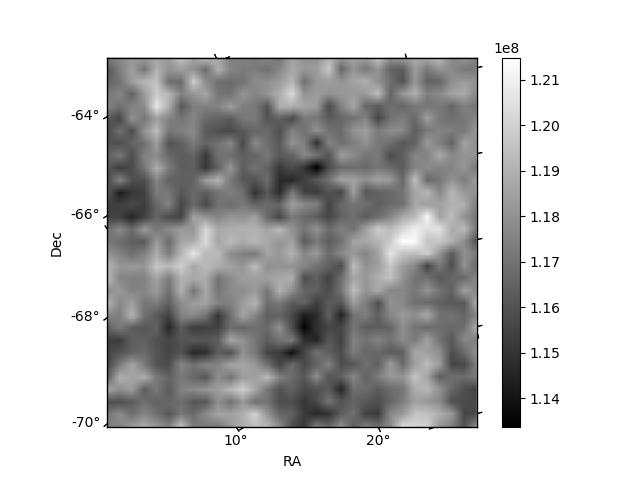
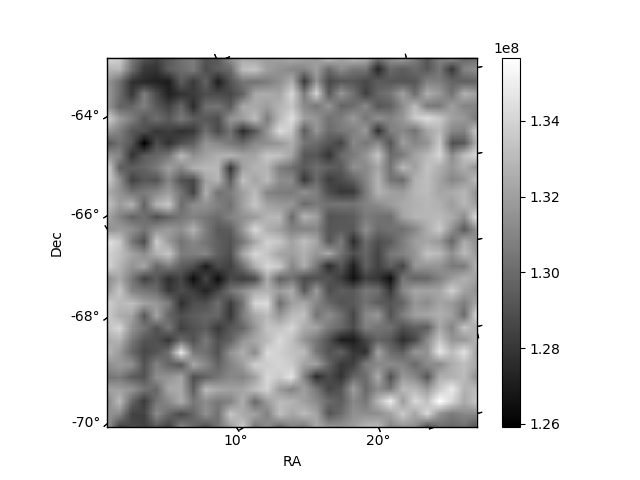
Histogram calculated using DETX and DETY for each event in the final _common_clean file
| Quadrant A | 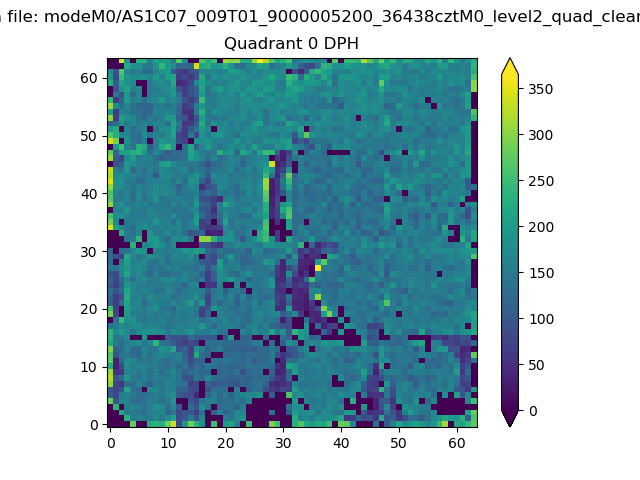 |
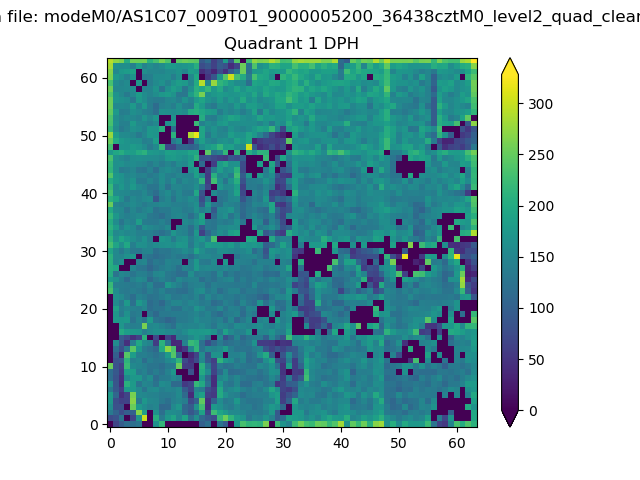 |
Quadrant B |
|---|---|---|---|
| Quadrant D | 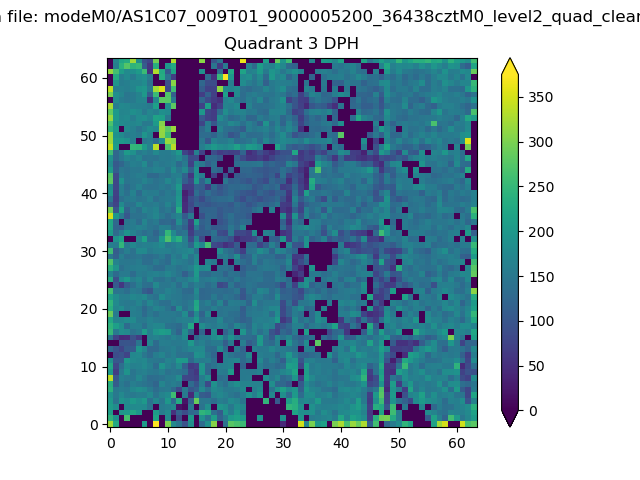 |
 |
Quadrant C |
| Plot type | Count rate plots | Images |
|---|---|---|
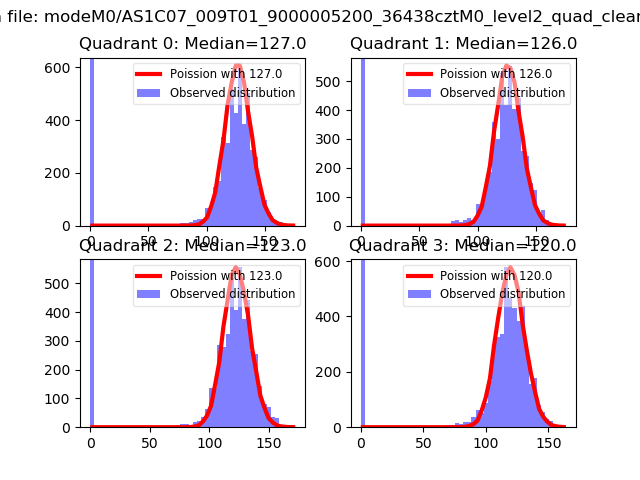
| Comparison with Poisson distribution Blue bars denote a histogram of data divided into 1 sec bins. Red curve is a Poisson curve with rate = median count rate of data. |
 |
 |
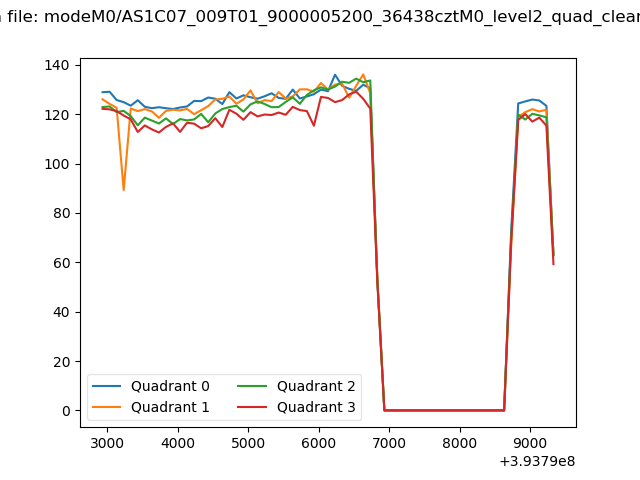
| Quadrant-wise count rates Data is divided into 100 sec bins |
 |
|
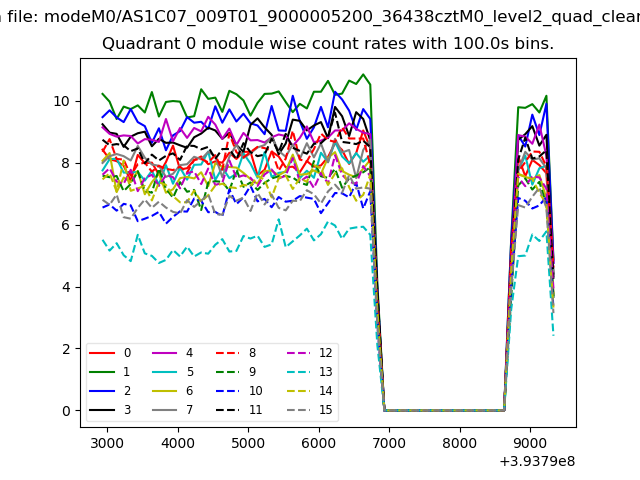
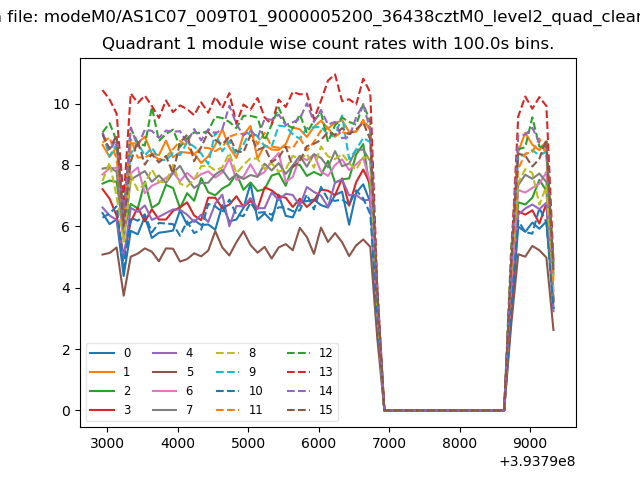
| Module-wise count rates for Quadrant A Data is divided into 100 sec bins |
 |
 |
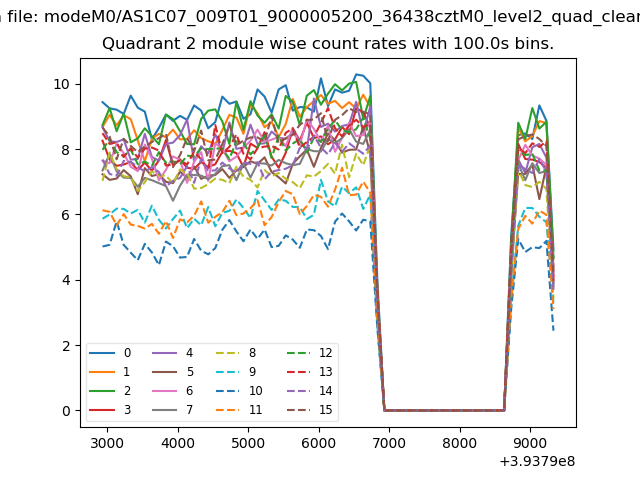
| Module-wise count rates for Quadrant B Data is divided into 100 sec bins |
 |
 |
| Module-wise count rates for Quadrant C Data is divided into 100 sec bins |
 |
 |
| Module-wise count rates for Quadrant D Data is divided into 100 sec bins |
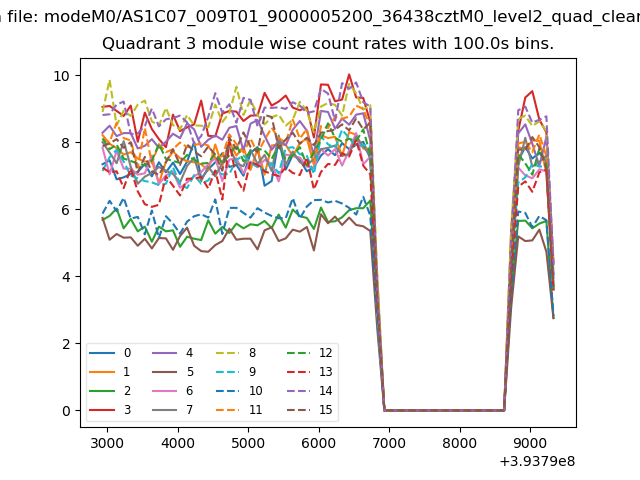 |
 |
| Parameter | Plot |
|---|---|
| CZT HV Monitor | 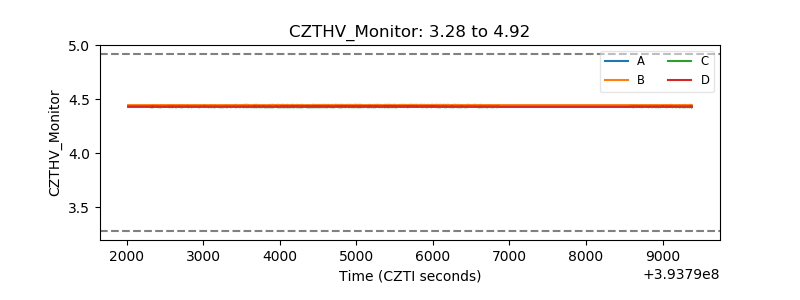 |
| D_VDD | 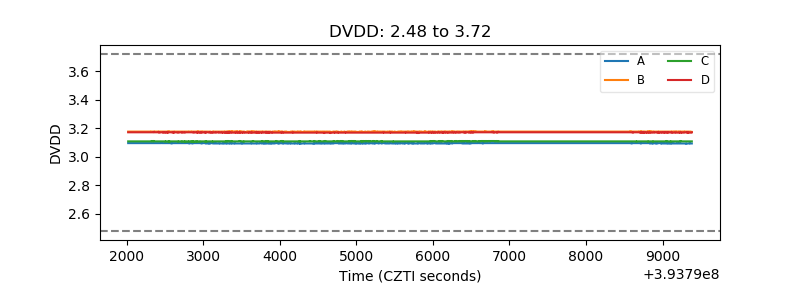 |
| Temperature 1 | 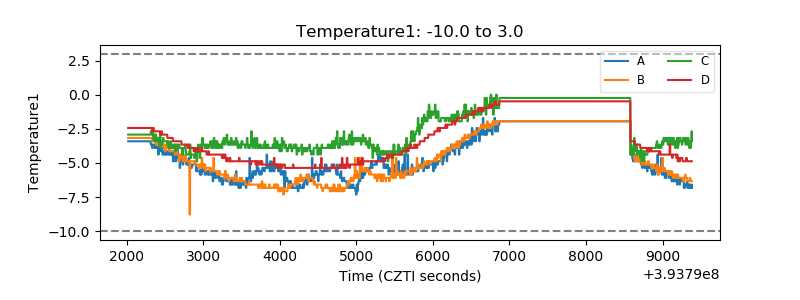 |
| Veto HV Monitor |  |
| Veto LLD | 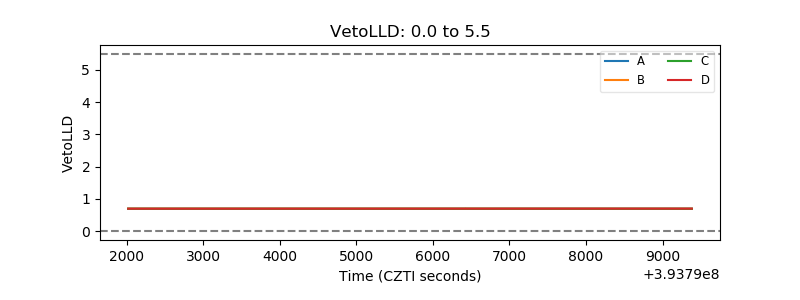 |
| Alpha Counter | 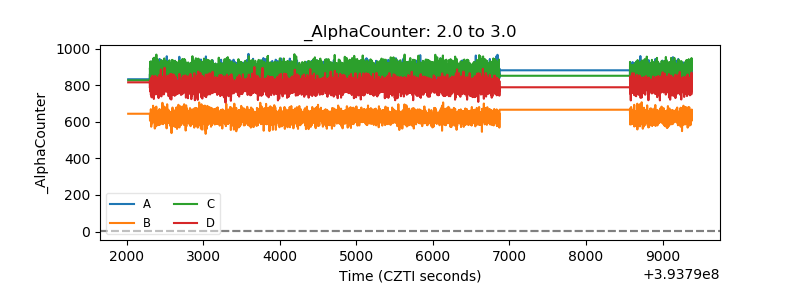 |
| _CPM_Rate | 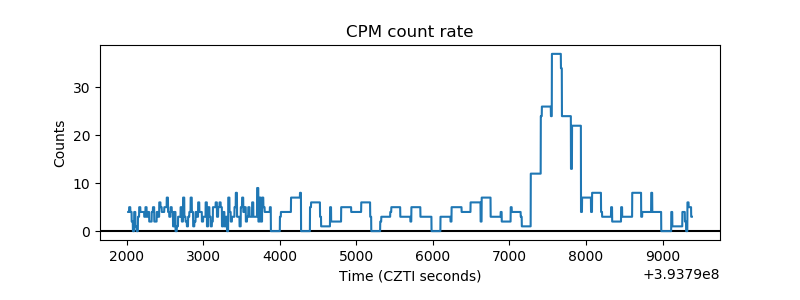 |
| CZT Counter | 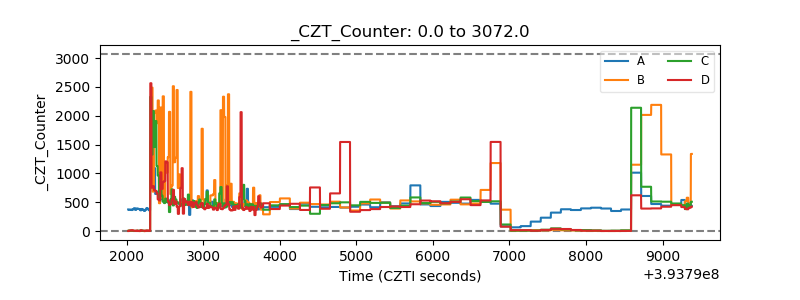 |
| +2.5 Volts monitor | 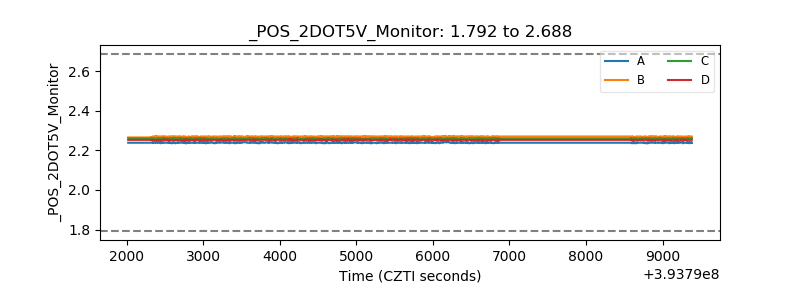 |
| +5 Volts monitor | 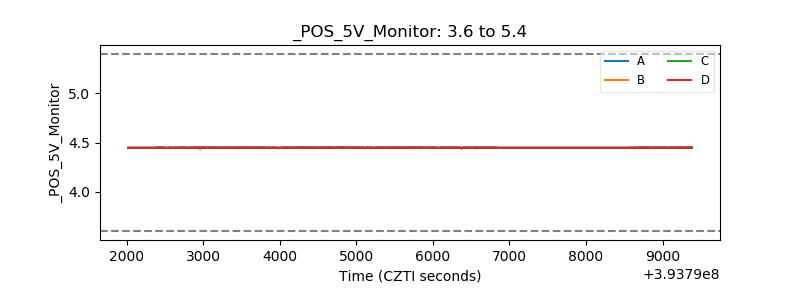 |
| _ROLL_ROT | 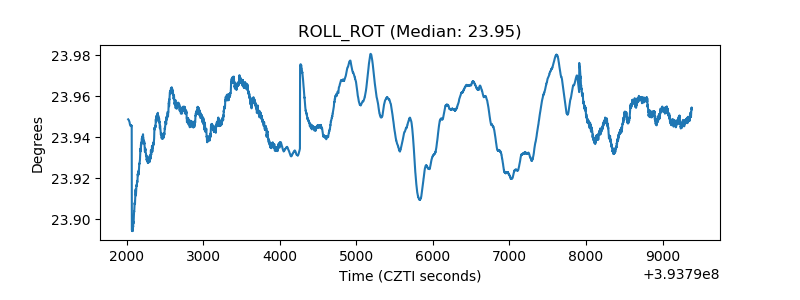 |
| _Roll_DEC | 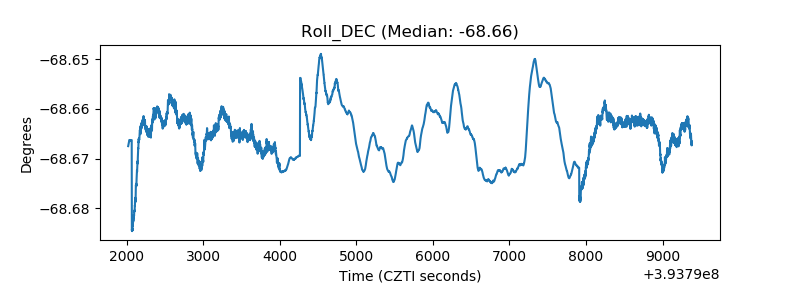 |
| _Roll_RA | 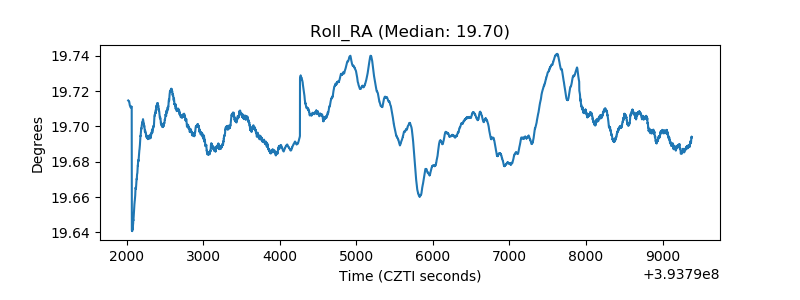 |
| Veto Counter | 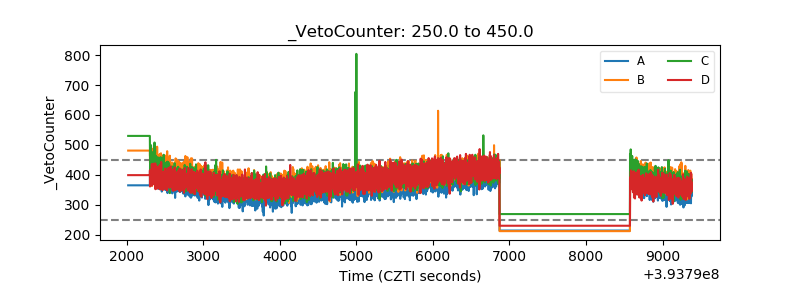 |