| Param | Original file | Final file |
|---|---|---|
| Filename | modeM0/AS1C07_009T01_9000005200_36437cztM0_level2.evt | modeM0/AS1C07_009T01_9000005200_36437cztM0_level2_quad_clean.evt |
| Size (bytes) | 398,888,640 | 69,232,320 |
| Size | 380.4 MB | 66.0 MB |
| Events in quadrant A | 2,512,904 | 447,018 |
| Events in quadrant B | 3,792,670 | 444,218 |
| Events in quadrant C | 2,797,320 | 431,473 |
| Events in quadrant D | 2,632,689 | 418,339 |
| Mode M0 | |||
|---|---|---|---|
| Quadrant | BADHDUFLAG | Total packets | Discarded packets |
| A | 0 | 10746 | 3 |
| B | 0 | 14629 | 2 |
| C | 0 | 11382 | 2 |
| D | 0 | 11336 | 2 |
| Mode SS | |||
|---|---|---|---|
| Quadrant | BADHDUFLAG | Total packets | Discarded packets |
| A | 0 | 102 | 0 |
| B | 0 | 102 | 0 |
| C | 0 | 102 | 0 |
| D | 0 | 102 | 0 |
| Mode M9 | |||
|---|---|---|---|
| Quadrant | BADHDUFLAG | Total packets | Discarded packets |
| A | 0 | 22 | 0 |
| B | 0 | 22 | 0 |
| C | 0 | 22 | 0 |
| D | 0 | 23 | 0 |
| Quadrant | Total seconds | Saturated seconds | Saturation percentage |
|---|---|---|---|
| A | 5073 | 12 | 0.236546% |
| B | 5073 | 390 | 7.687759% |
| C | 5073 | 103 | 2.030357% |
| D | 5073 | 58 | 1.143308% |
Noise dominated data is calculated using 1-second bins in cleaned event files. If a bin has >2000 counts, and if more than 50% of those come from <1% of pixels, then it is considered to be noise-dominated and hence unusable.
| Quadrant | # 1 sec bins | Bins with >0 counts | Bins with >2000 counts | High rate bins dominated by noise | Noise dominated (total time) | Noise dominated (detector-on time) | Marked lightcurve |
|---|---|---|---|---|---|---|---|
| A | 7075 | 5074 | 3 | 3 | 0.04% | 0.06% | 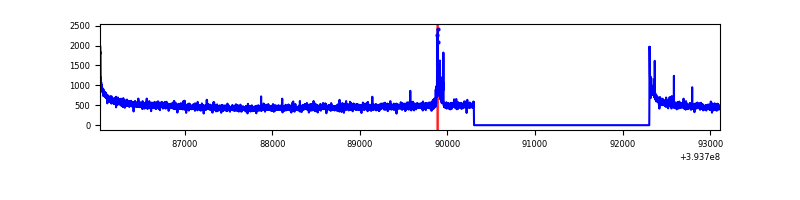 |
| B | 7075 | 5074 | 258 | 258 | 3.65% | 5.08% | 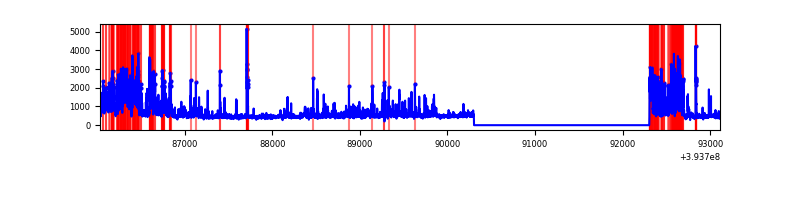 |
| C | 7075 | 5074 | 60 | 60 | 0.85% | 1.18% | 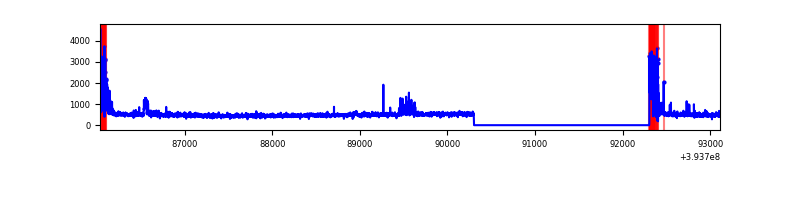 |
| D | 7075 | 5074 | 44 | 44 | 0.62% | 0.87% | 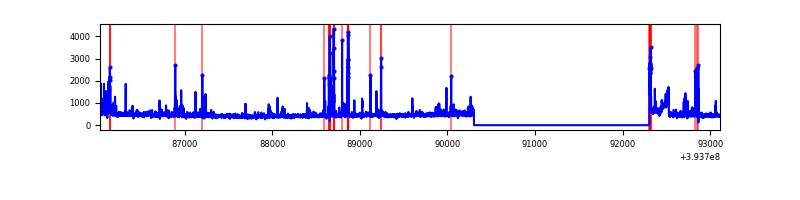 |
Top three noisy pixels from each quadrant. If the there are fewer than three noisy pixels in the level2.evt file, extra rows are filled as -1
| Pixel properties | Quadrant properties | ||||||
|---|---|---|---|---|---|---|---|
| Quadrant | DetID | PixID | Counts | Sigma | Mean | Median | Sigma |
| A | 10 | 83 | 187907 | 1598.38 | 583 | 572 | 117.2 |
| A | 9 | 143 | 56585 | 477.91 | 583 | 572 | 117.2 |
| A | 13 | 254 | 9272 | 74.23 | 583 | 572 | 117.2 |
| B | 5 | 172 | 1167931 | 10956.57 | 563 | 549 | 106.5 |
| B | 5 | 255 | 168328 | 1574.7 | 563 | 549 | 106.5 |
| B | 0 | 189 | 89904 | 838.65 | 563 | 549 | 106.5 |
| C | 0 | 10 | 282458 | 2202.83 | 556 | 560 | 128.0 |
| C | 15 | 214 | 219142 | 1708.06 | 556 | 560 | 128.0 |
| C | 3 | 233 | 98279 | 763.61 | 556 | 560 | 128.0 |
| D | 13 | 249 | 111146 | 819.32 | 558 | 543 | 135.0 |
| D | 12 | 233 | 80190 | 590.01 | 558 | 543 | 135.0 |
| D | 10 | 118 | 59511 | 436.82 | 558 | 543 | 135.0 |
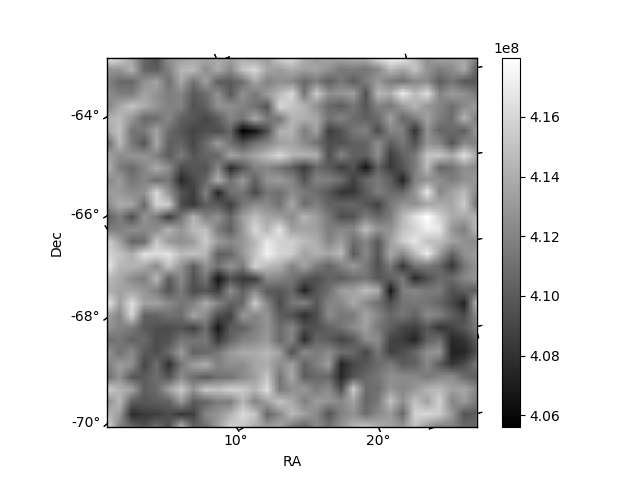
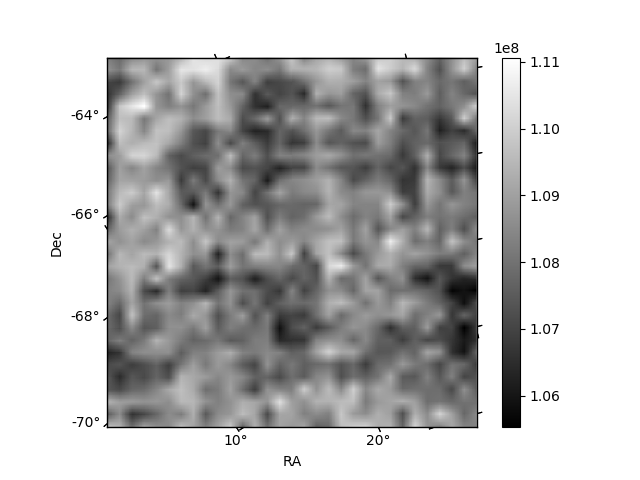
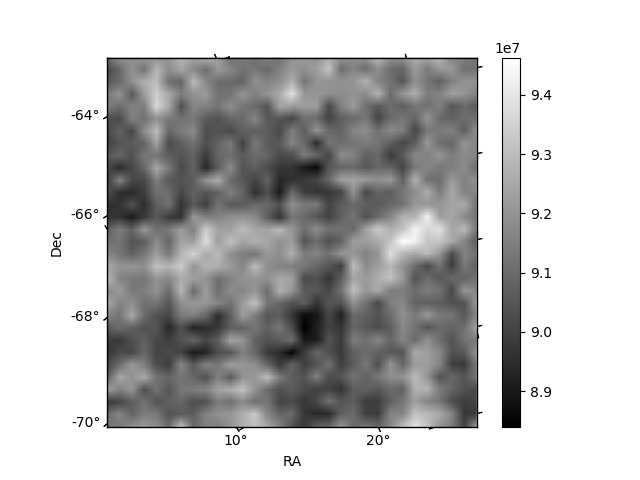
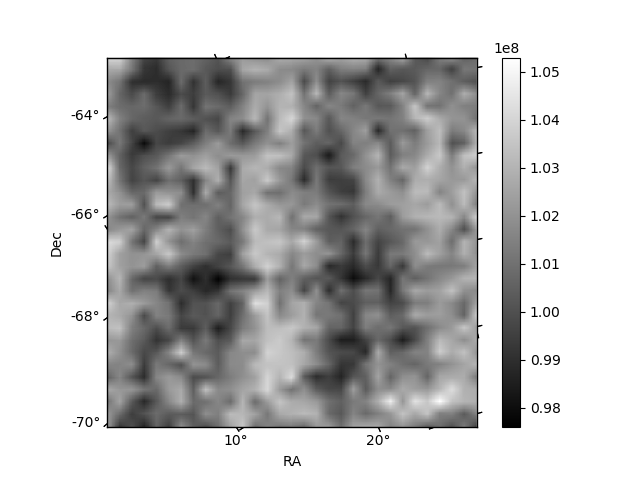
Histogram calculated using DETX and DETY for each event in the final _common_clean file
| Quadrant A | 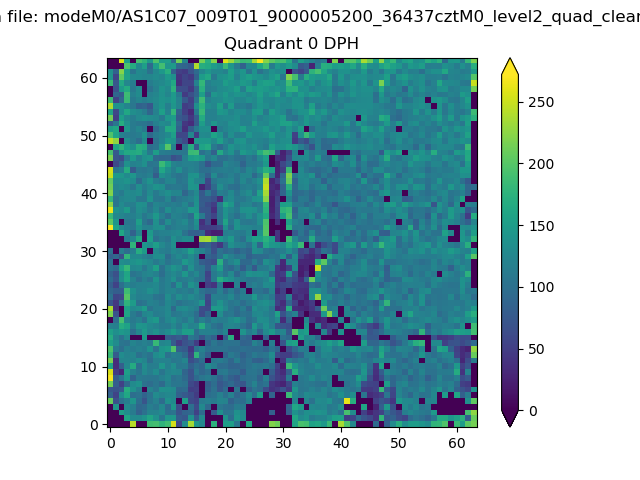 |
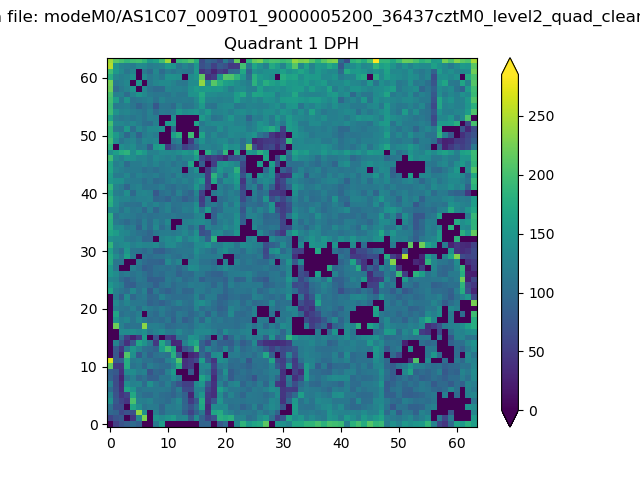 |
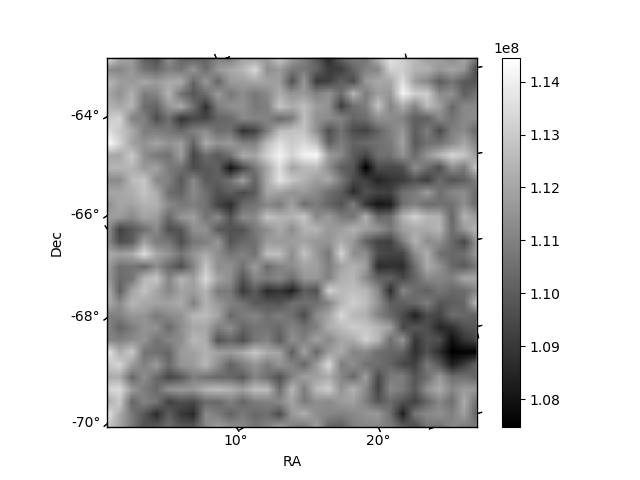
Quadrant B |
|---|---|---|---|
| Quadrant D | 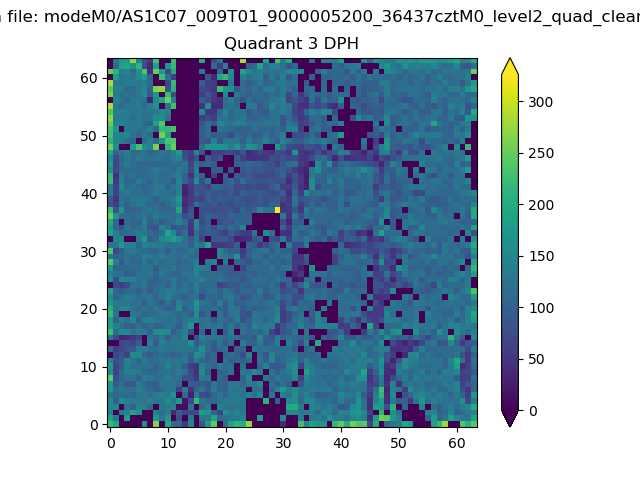 |
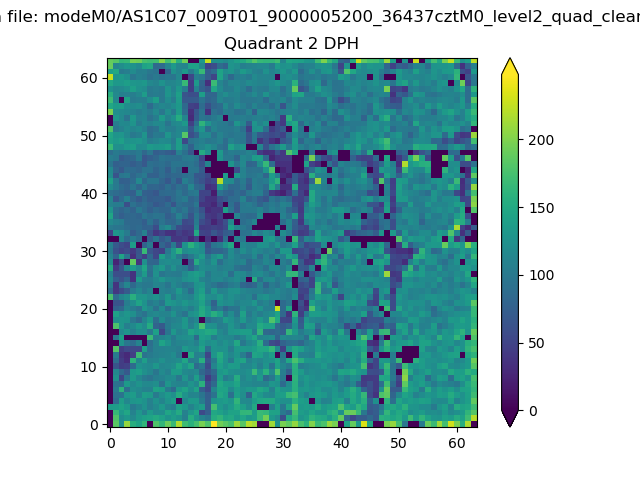 |
Quadrant C |
| Plot type | Count rate plots | Images |
|---|---|---|
| Comparison with Poisson distribution Blue bars denote a histogram of data divided into 1 sec bins. Red curve is a Poisson curve with rate = median count rate of data. |
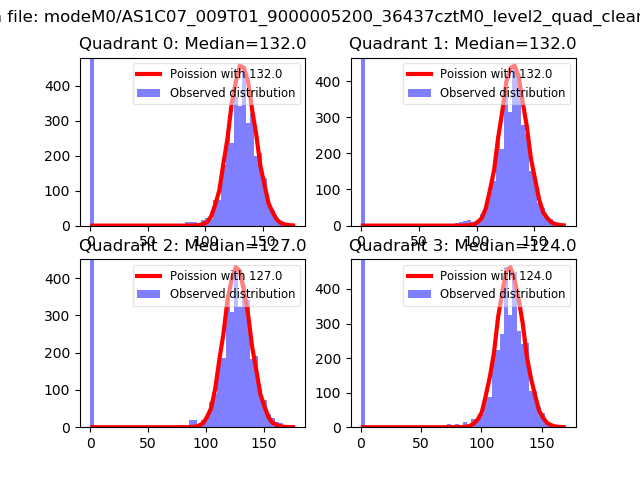 |
 |
| Quadrant-wise count rates Data is divided into 100 sec bins |
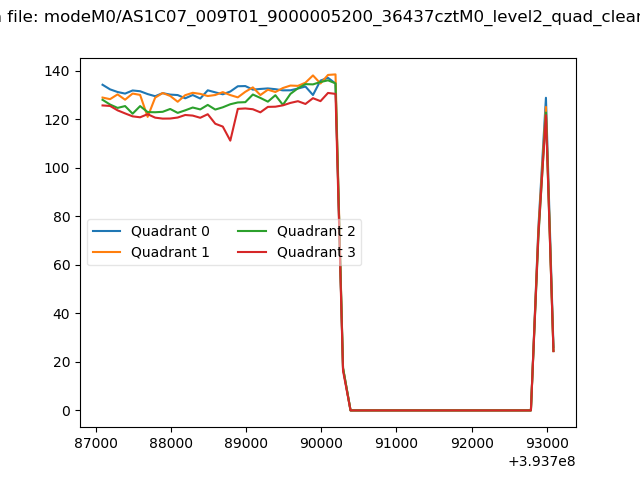 |
|
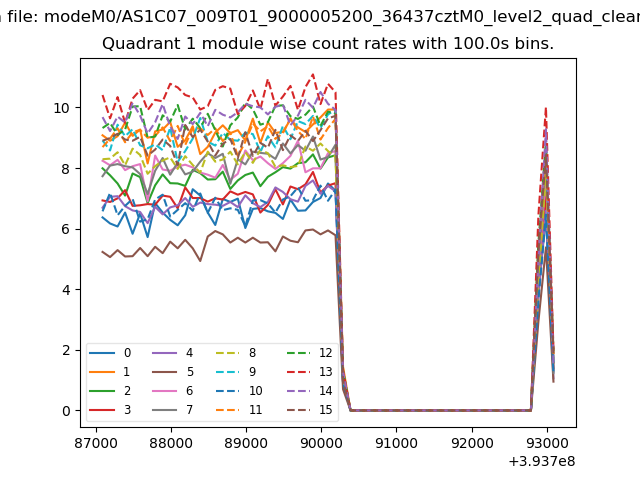
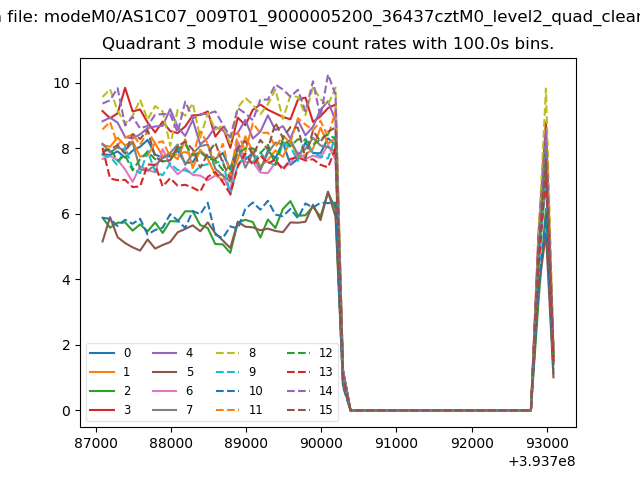
| Module-wise count rates for Quadrant A Data is divided into 100 sec bins |
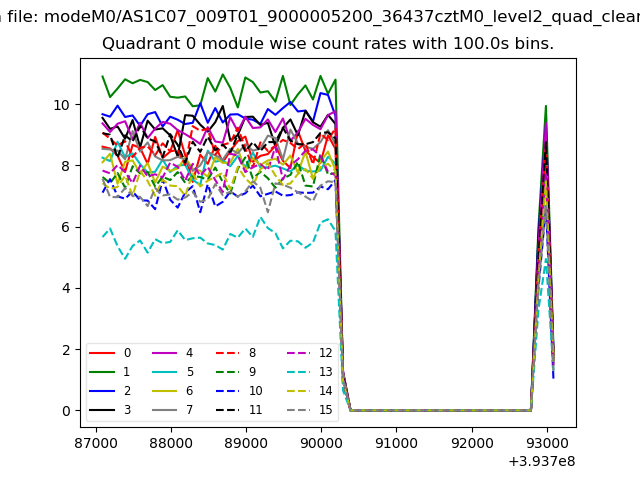 |
 |
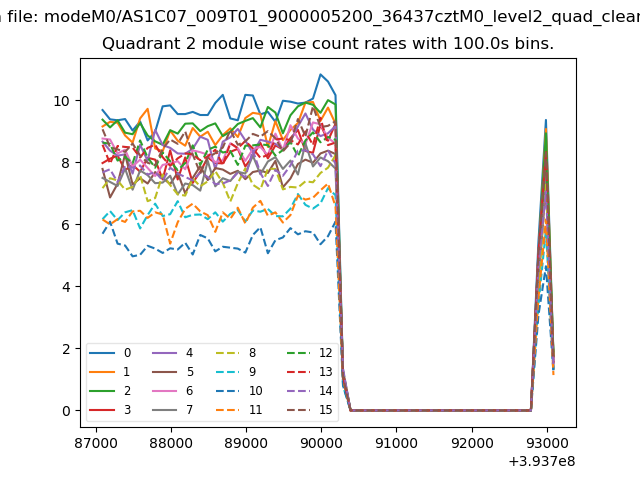
| Module-wise count rates for Quadrant B Data is divided into 100 sec bins |
 |
 |
| Module-wise count rates for Quadrant C Data is divided into 100 sec bins |
 |
 |
| Module-wise count rates for Quadrant D Data is divided into 100 sec bins |
 |
 |
| Parameter | Plot |
|---|---|
| CZT HV Monitor | 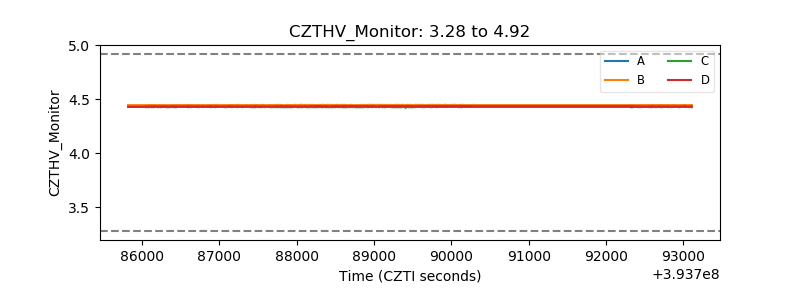 |
| D_VDD | 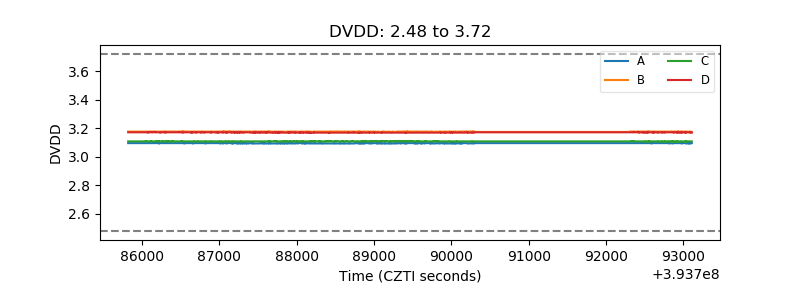 |
| Temperature 1 | 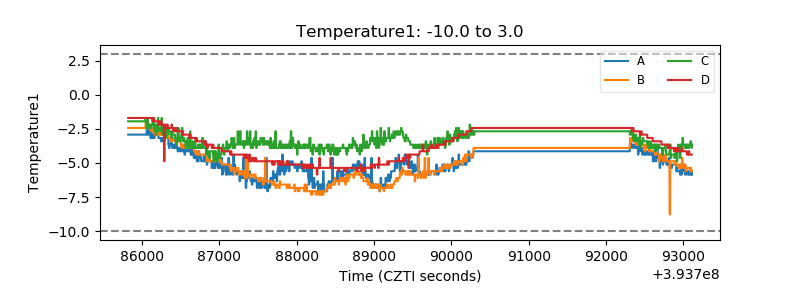 |
| Veto HV Monitor | 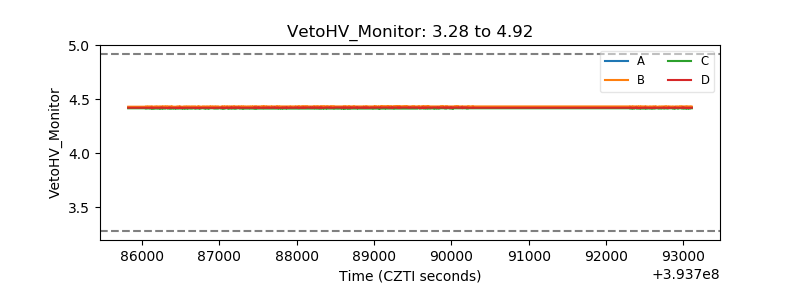 |
| Veto LLD | 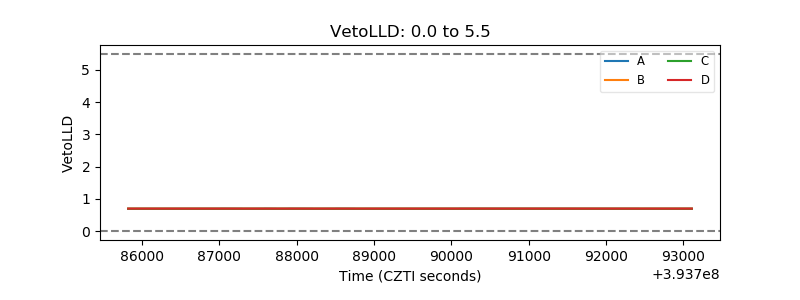 |
| Alpha Counter | 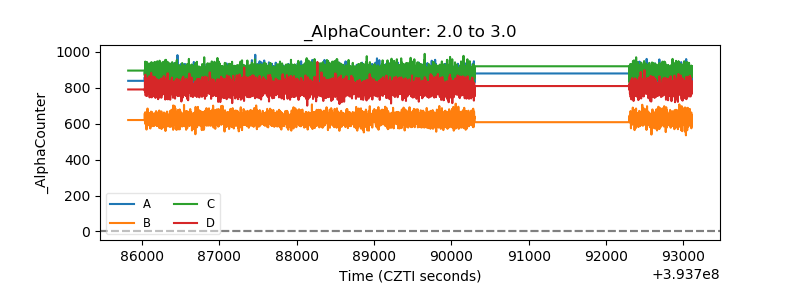 |
| _CPM_Rate | 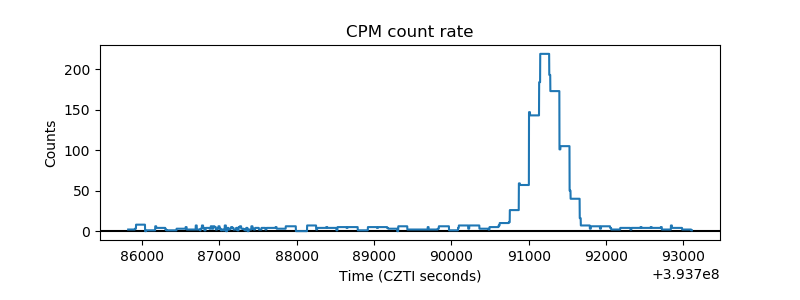 |
| CZT Counter | 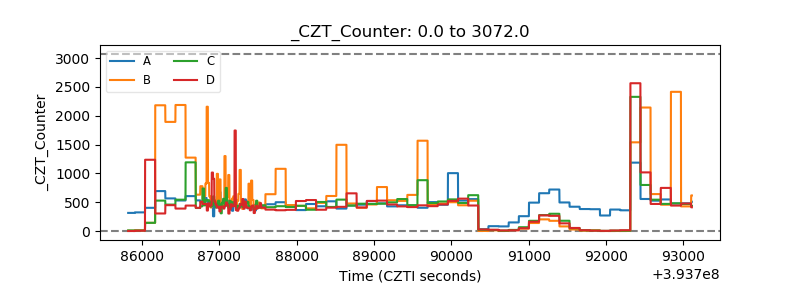 |
| +2.5 Volts monitor | 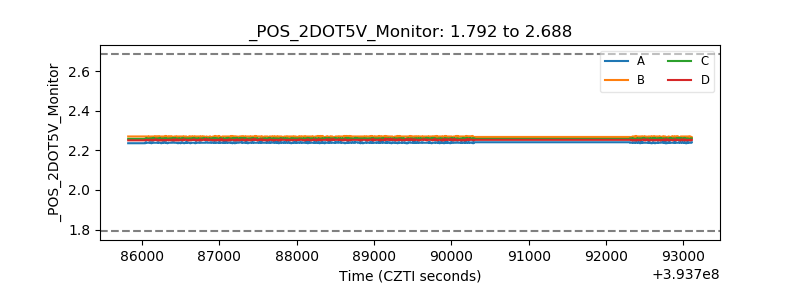 |
| +5 Volts monitor | 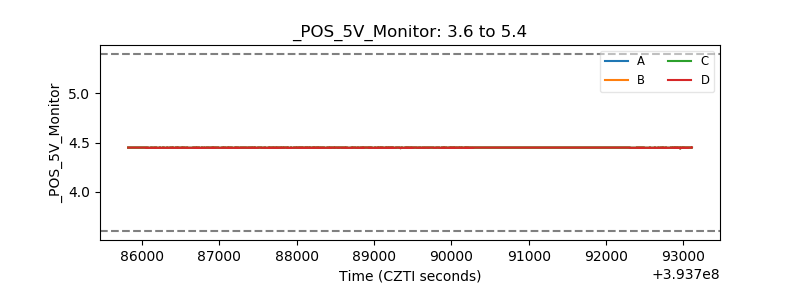 |
| _ROLL_ROT | 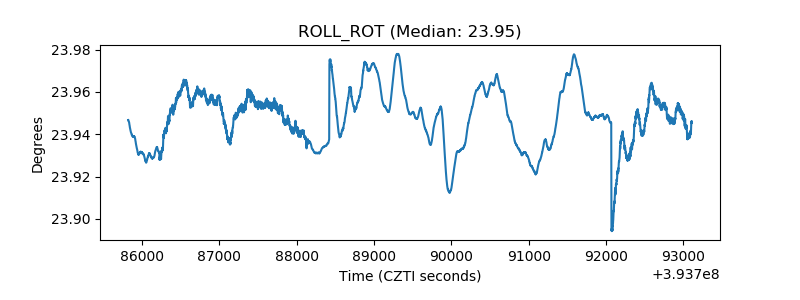 |
| _Roll_DEC | 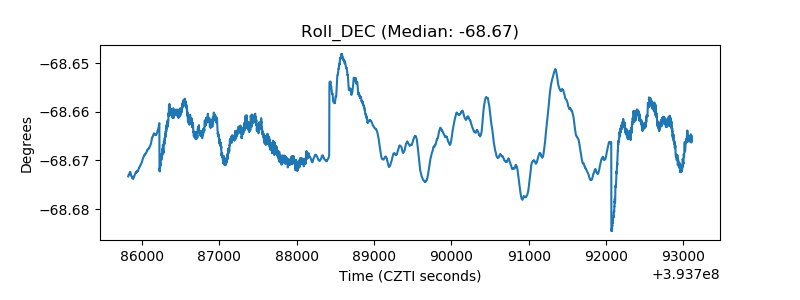 |
| _Roll_RA | 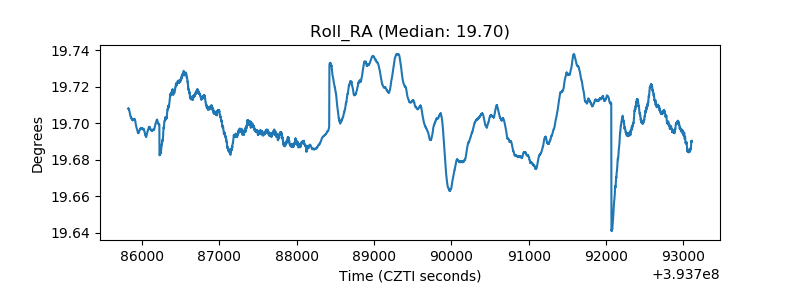 |
| Veto Counter | 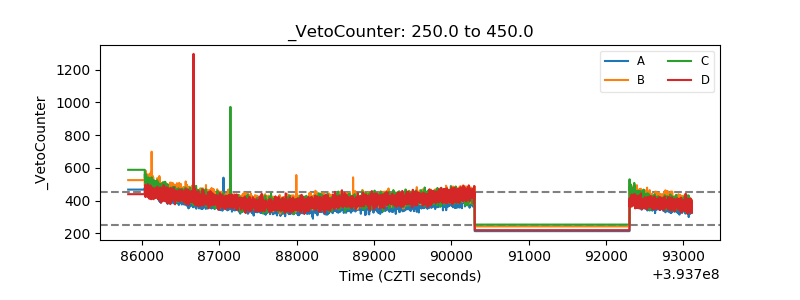 |