| Param | Original file | Final file |
|---|---|---|
| Filename | modeM0/AS1C07_009T01_9000005200_36435cztM0_level2.evt | modeM0/AS1C07_009T01_9000005200_36435cztM0_level2_quad_clean.evt |
| Size (bytes) | 440,268,480 | 65,041,920 |
| Size | 419.9 MB | 62.0 MB |
| Events in quadrant A | 2,633,204 | 419,539 |
| Events in quadrant B | 4,005,589 | 413,881 |
| Events in quadrant C | 3,224,357 | 392,308 |
| Events in quadrant D | 3,128,977 | 390,931 |
| Mode M0 | |||
|---|---|---|---|
| Quadrant | BADHDUFLAG | Total packets | Discarded packets |
| A | 0 | 10844 | 3 |
| B | 0 | 15228 | 2 |
| C | 0 | 12557 | 2 |
| D | 0 | 12556 | 2 |
| Mode SS | |||
|---|---|---|---|
| Quadrant | BADHDUFLAG | Total packets | Discarded packets |
| A | 0 | 104 | 0 |
| B | 0 | 104 | 0 |
| C | 0 | 104 | 0 |
| D | 0 | 104 | 0 |
| Mode M9 | |||
|---|---|---|---|
| Quadrant | BADHDUFLAG | Total packets | Discarded packets |
| A | 0 | 21 | 0 |
| B | 0 | 21 | 0 |
| C | 0 | 21 | 0 |
| D | 0 | 22 | 0 |
| Quadrant | Total seconds | Saturated seconds | Saturation percentage |
|---|---|---|---|
| A | 5025 | 10 | 0.199005% |
| B | 5025 | 370 | 7.363184% |
| C | 5025 | 176 | 3.502488% |
| D | 5025 | 78 | 1.552239% |
Noise dominated data is calculated using 1-second bins in cleaned event files. If a bin has >2000 counts, and if more than 50% of those come from <1% of pixels, then it is considered to be noise-dominated and hence unusable.
| Quadrant | # 1 sec bins | Bins with >0 counts | Bins with >2000 counts | High rate bins dominated by noise | Noise dominated (total time) | Noise dominated (detector-on time) | Marked lightcurve |
|---|---|---|---|---|---|---|---|
| A | 7148 | 5026 | 1 | 1 | 0.01% | 0.02% | 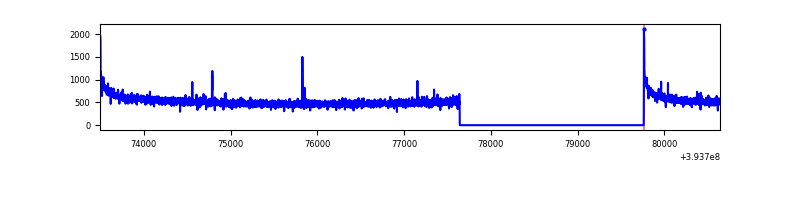 |
| B | 7148 | 5026 | 275 | 275 | 3.85% | 5.47% | 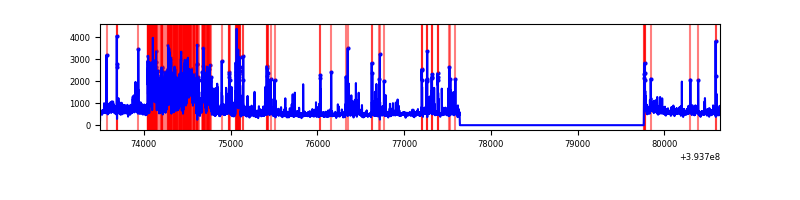 |
| C | 7148 | 5026 | 125 | 125 | 1.75% | 2.49% | 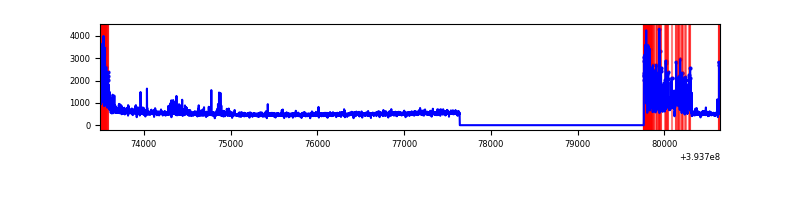 |
| D | 7148 | 5026 | 73 | 73 | 1.02% | 1.45% | 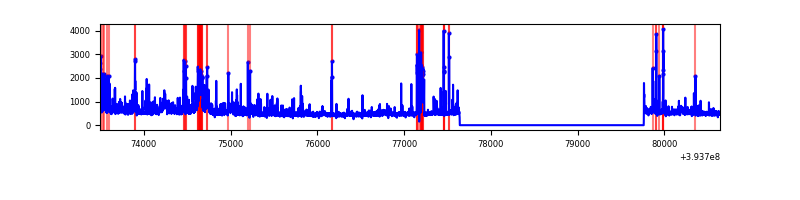 |
Top three noisy pixels from each quadrant. If the there are fewer than three noisy pixels in the level2.evt file, extra rows are filled as -1
| Pixel properties | Quadrant properties | ||||||
|---|---|---|---|---|---|---|---|
| Quadrant | DetID | PixID | Counts | Sigma | Mean | Median | Sigma |
| A | 10 | 83 | 192755 | 1531.21 | 628 | 617 | 125.5 |
| A | 13 | 254 | 9107 | 67.66 | 628 | 617 | 125.5 |
| A | 9 | 143 | 8539 | 63.13 | 628 | 617 | 125.5 |
| B | 5 | 172 | 1134303 | 10149.08 | 603 | 589 | 111.7 |
| B | 0 | 189 | 242644 | 2166.89 | 603 | 589 | 111.7 |
| B | 5 | 255 | 124633 | 1110.45 | 603 | 589 | 111.7 |
| C | 3 | 233 | 351283 | 2639.74 | 586 | 592 | 132.9 |
| C | 0 | 10 | 333330 | 2504.6 | 586 | 592 | 132.9 |
| C | 15 | 214 | 215978 | 1621.27 | 586 | 592 | 132.9 |
| D | 12 | 235 | 263288 | 1847.91 | 599 | 584 | 142.2 |
| D | 12 | 16 | 119969 | 839.78 | 599 | 584 | 142.2 |
| D | 12 | 233 | 86424 | 603.82 | 599 | 584 | 142.2 |
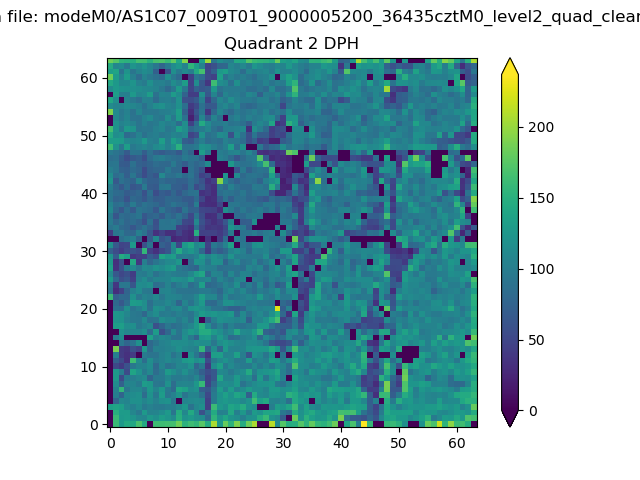
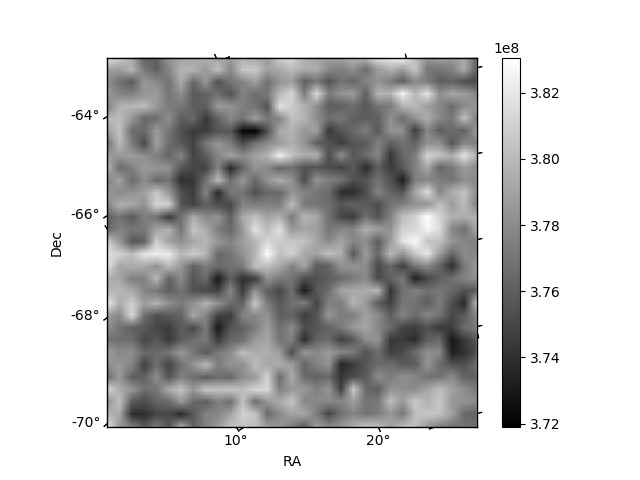
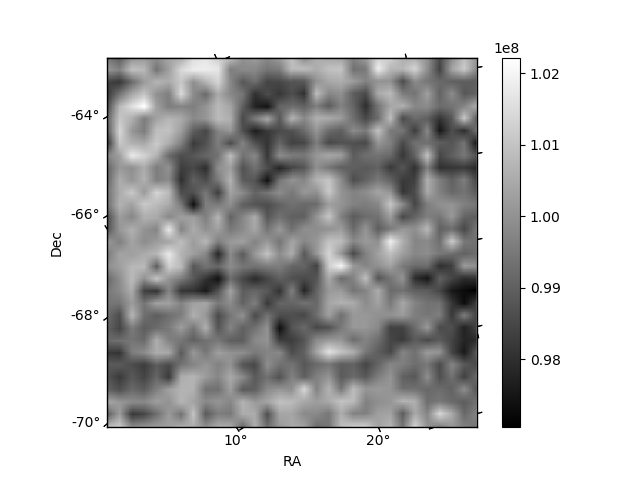
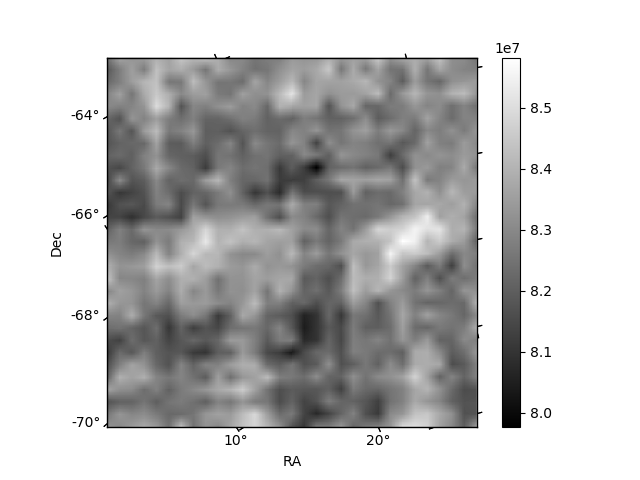
Histogram calculated using DETX and DETY for each event in the final _common_clean file
| Quadrant A | 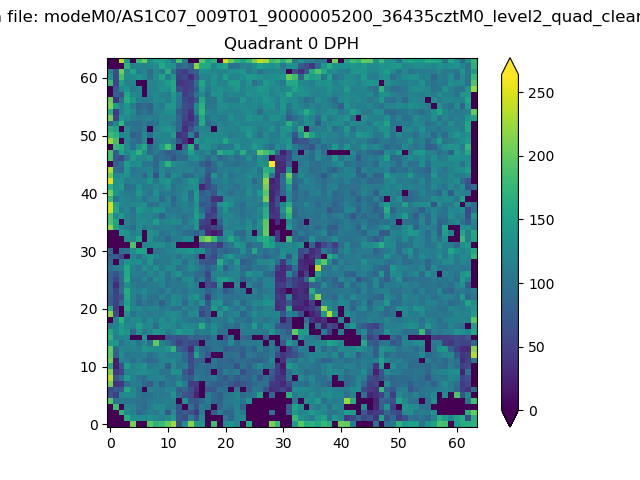 |
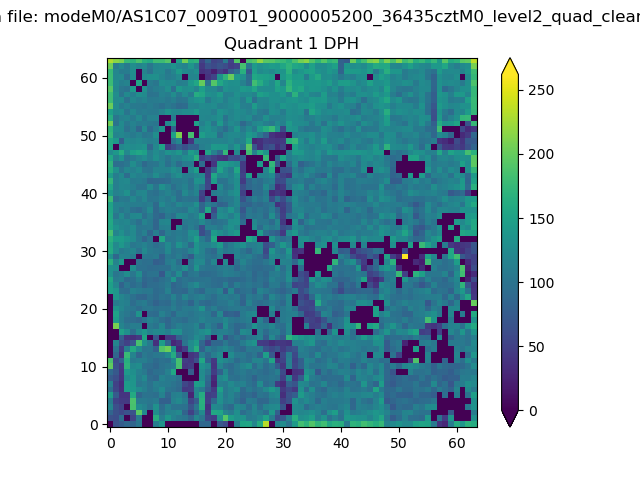 |
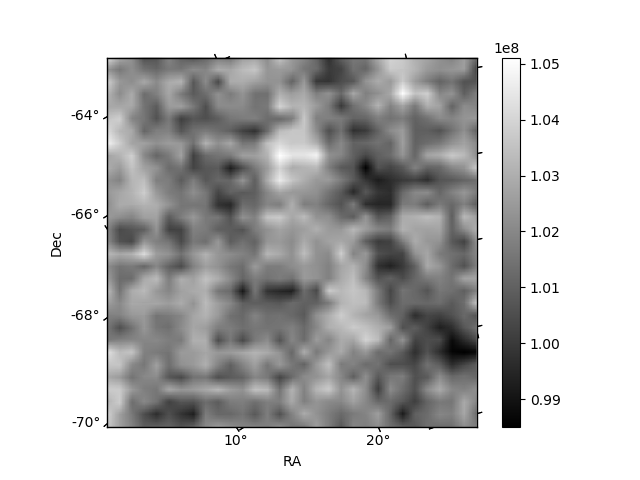
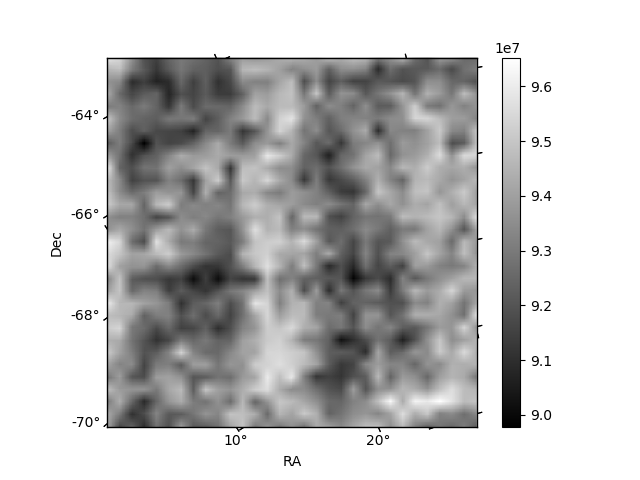
Quadrant B |
|---|---|---|---|
| Quadrant D | 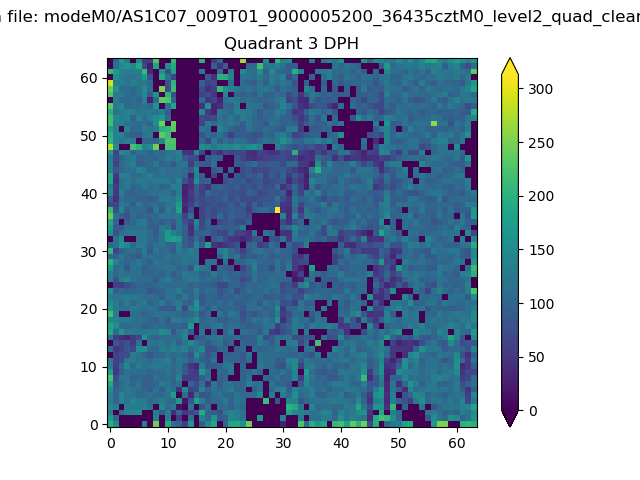 |
 |
Quadrant C |
| Plot type | Count rate plots | Images |
|---|---|---|
| Comparison with Poisson distribution Blue bars denote a histogram of data divided into 1 sec bins. Red curve is a Poisson curve with rate = median count rate of data. |
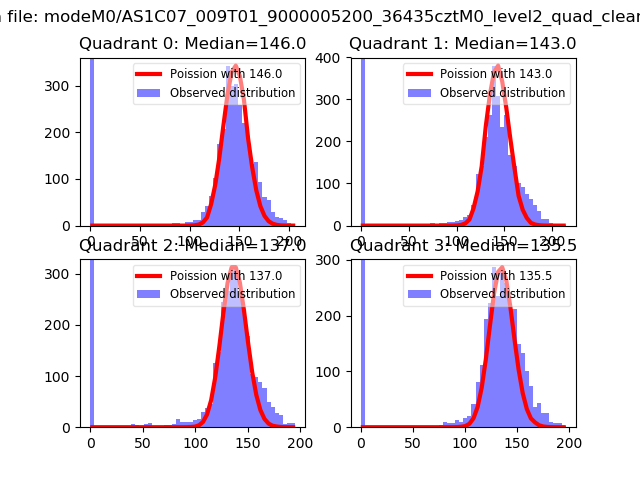 |
 |
| Quadrant-wise count rates Data is divided into 100 sec bins |
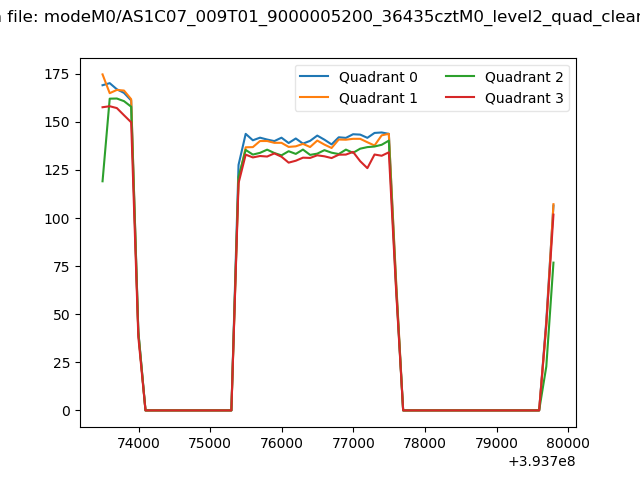 |
|
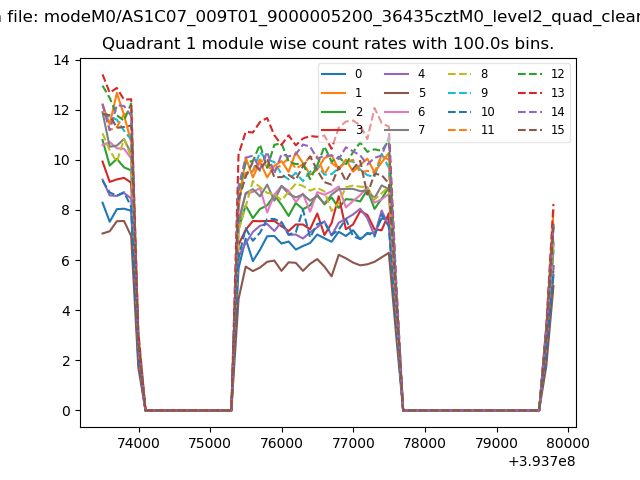
| Module-wise count rates for Quadrant A Data is divided into 100 sec bins |
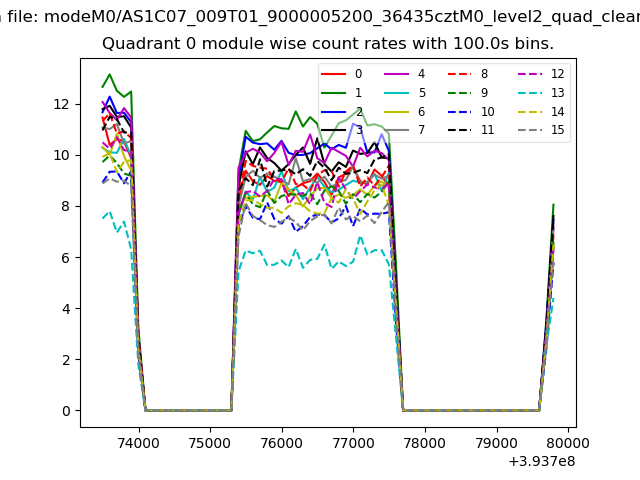 |
 |
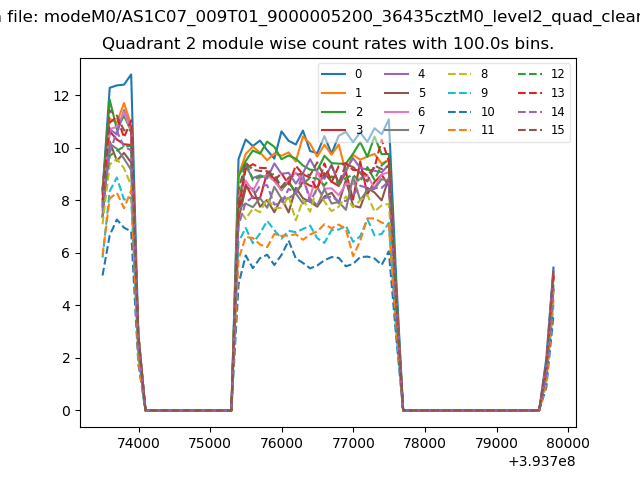
| Module-wise count rates for Quadrant B Data is divided into 100 sec bins |
 |
 |
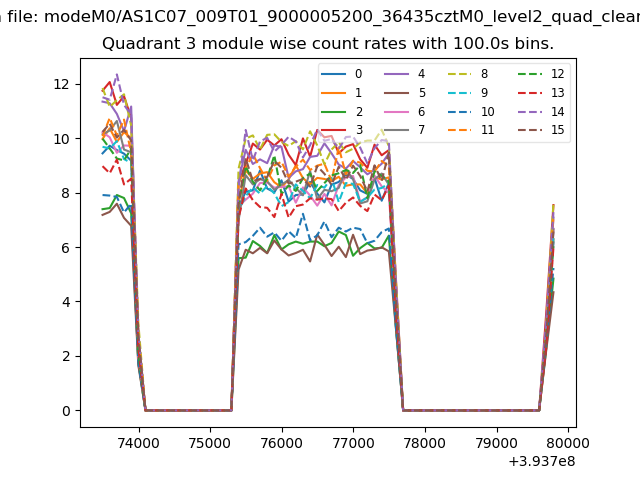
| Module-wise count rates for Quadrant C Data is divided into 100 sec bins |
 |
 |
| Module-wise count rates for Quadrant D Data is divided into 100 sec bins |
 |
 |
| Parameter | Plot |
|---|---|
| CZT HV Monitor | 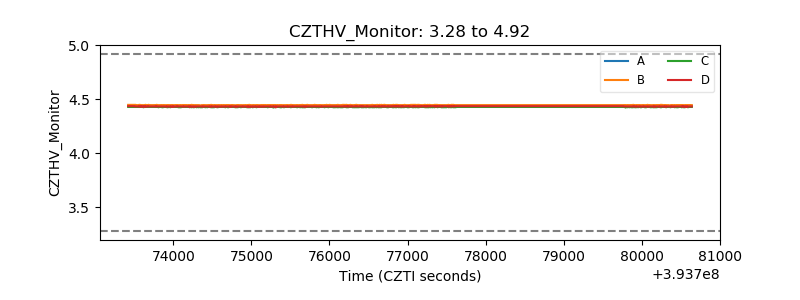 |
| D_VDD | 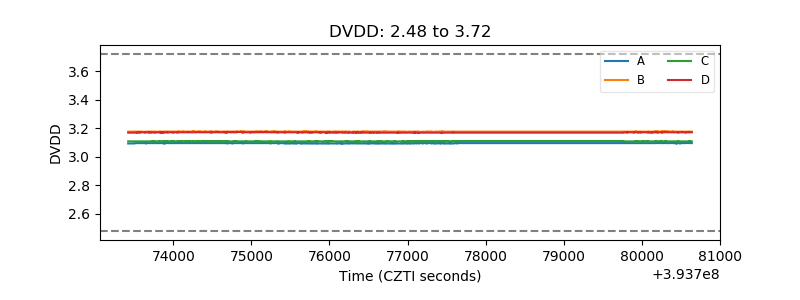 |
| Temperature 1 | 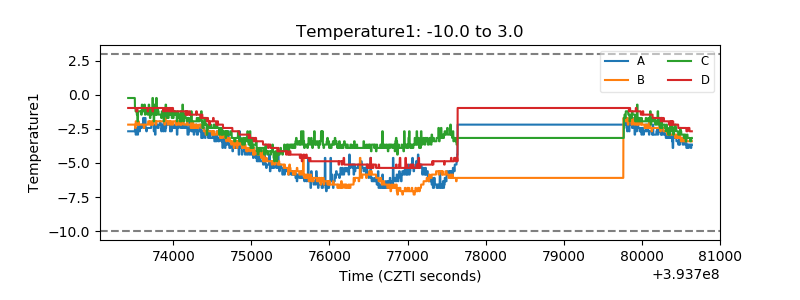 |
| Veto HV Monitor | 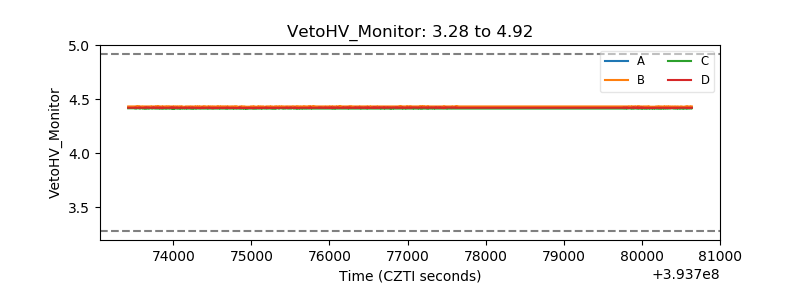 |
| Veto LLD | 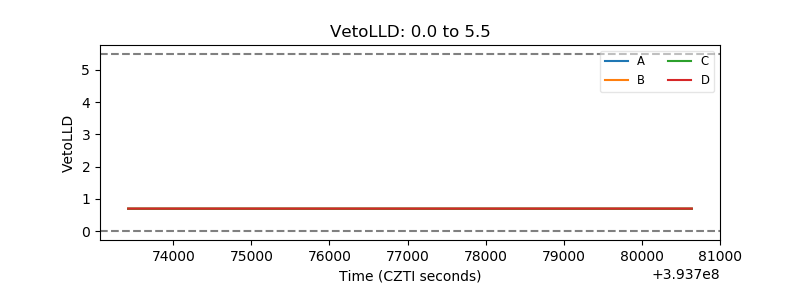 |
| Alpha Counter | 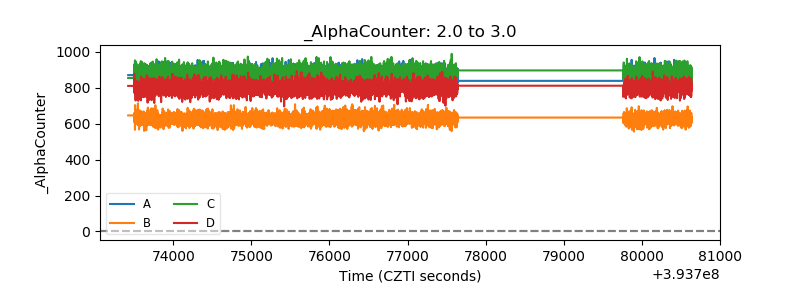 |
| _CPM_Rate | 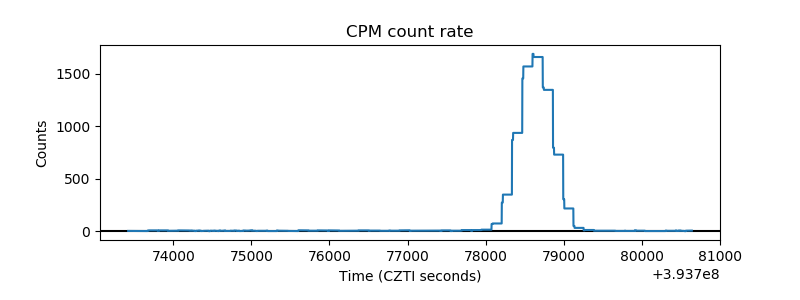 |
| CZT Counter | 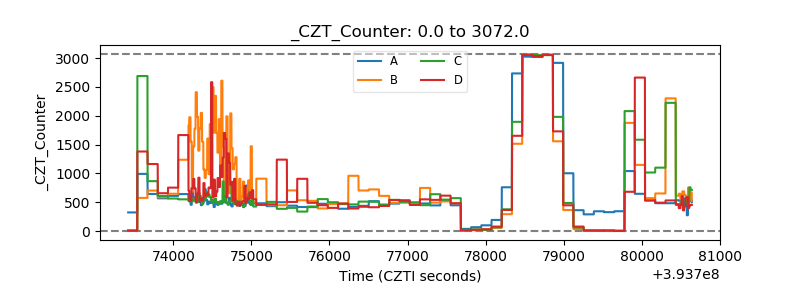 |
| +2.5 Volts monitor | 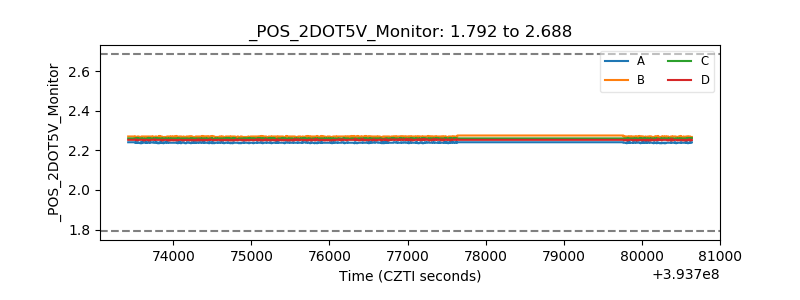 |
| +5 Volts monitor | 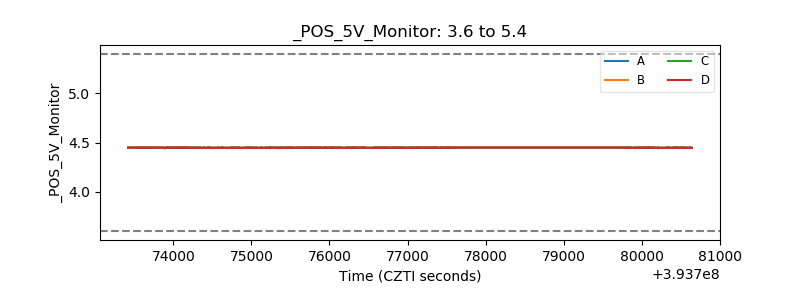 |
| _ROLL_ROT | 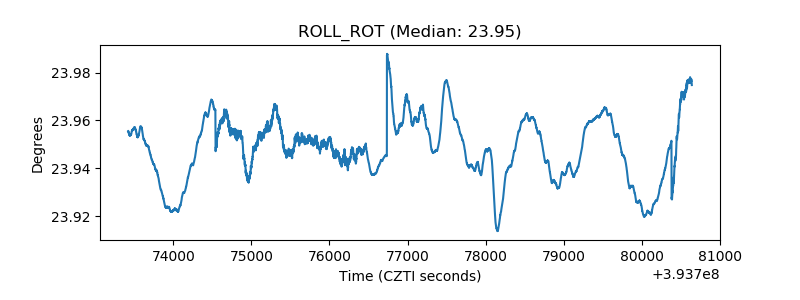 |
| _Roll_DEC | 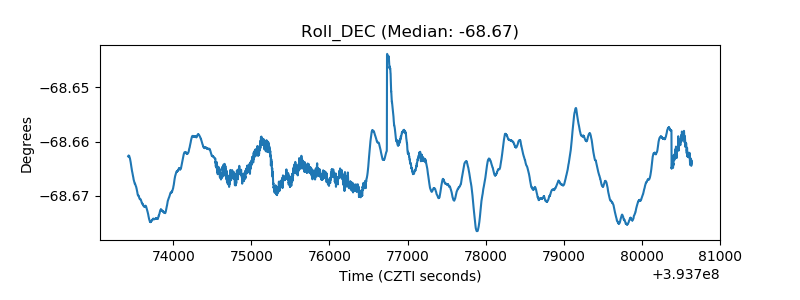 |
| _Roll_RA | 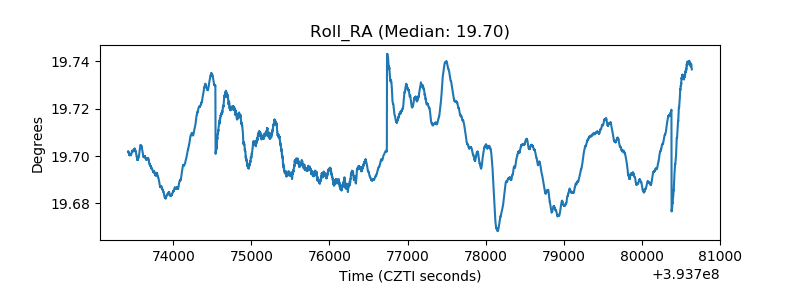 |
| Veto Counter | 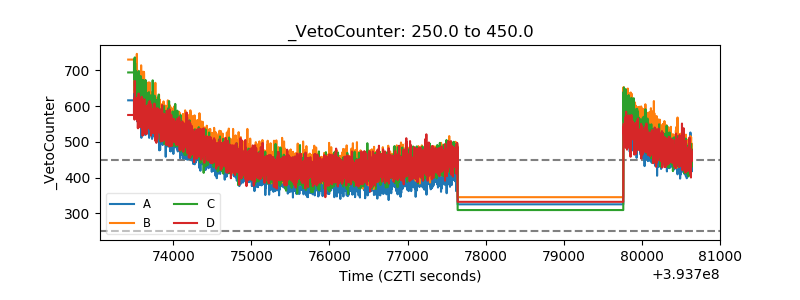 |