| Param | Original file | Final file |
|---|---|---|
| Filename | modeM0/AS1C07_009T01_9000005200_36434cztM0_level2.evt | modeM0/AS1C07_009T01_9000005200_36434cztM0_level2_quad_clean.evt |
| Size (bytes) | 428,927,040 | 76,959,360 |
| Size | 409.1 MB | 73.4 MB |
| Events in quadrant A | 2,765,103 | 507,384 |
| Events in quadrant B | 3,554,978 | 502,649 |
| Events in quadrant C | 2,980,162 | 482,171 |
| Events in quadrant D | 3,333,451 | 470,737 |
| Mode M0 | |||
|---|---|---|---|
| Quadrant | BADHDUFLAG | Total packets | Discarded packets |
| A | 0 | 11362 | 3 |
| B | 0 | 13963 | 2 |
| C | 0 | 11912 | 2 |
| D | 0 | 13303 | 2 |
| Mode SS | |||
|---|---|---|---|
| Quadrant | BADHDUFLAG | Total packets | Discarded packets |
| A | 0 | 106 | 0 |
| B | 0 | 106 | 0 |
| C | 0 | 106 | 0 |
| D | 0 | 106 | 0 |
| Mode M9 | |||
|---|---|---|---|
| Quadrant | BADHDUFLAG | Total packets | Discarded packets |
| A | 0 | 20 | 0 |
| B | 0 | 20 | 0 |
| C | 0 | 20 | 0 |
| D | 0 | 21 | 0 |
| Quadrant | Total seconds | Saturated seconds | Saturation percentage |
|---|---|---|---|
| A | 5251 | 11 | 0.209484% |
| B | 5251 | 234 | 4.456294% |
| C | 5251 | 111 | 2.113883% |
| D | 5251 | 106 | 2.018663% |
Noise dominated data is calculated using 1-second bins in cleaned event files. If a bin has >2000 counts, and if more than 50% of those come from <1% of pixels, then it is considered to be noise-dominated and hence unusable.
| Quadrant | # 1 sec bins | Bins with >0 counts | Bins with >2000 counts | High rate bins dominated by noise | Noise dominated (total time) | Noise dominated (detector-on time) | Marked lightcurve |
|---|---|---|---|---|---|---|---|
| A | 7284 | 5252 | 0 | 0 | 0.00% | 0.00% | 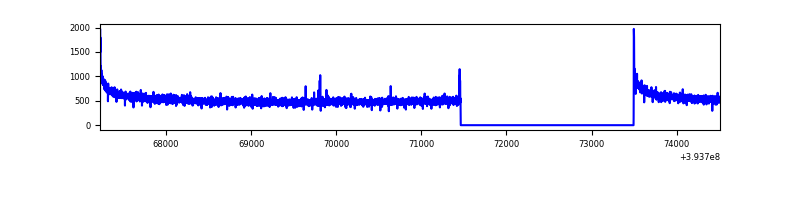 |
| B | 7284 | 5252 | 164 | 164 | 2.25% | 3.12% | 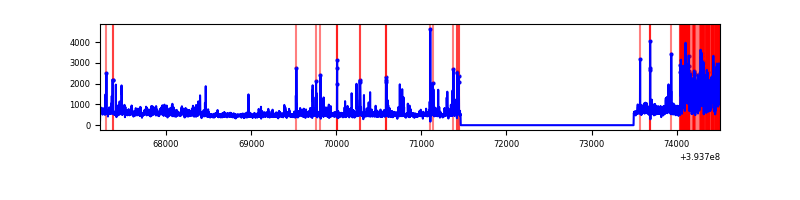 |
| C | 7284 | 5252 | 62 | 62 | 0.85% | 1.18% | 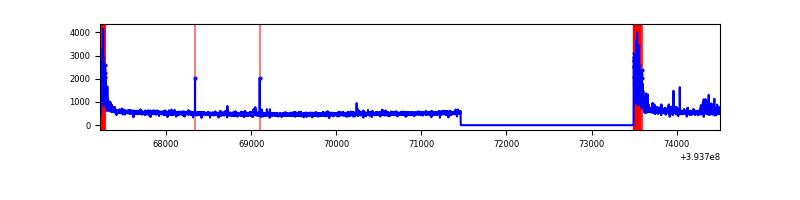 |
| D | 7284 | 5252 | 86 | 86 | 1.18% | 1.64% | 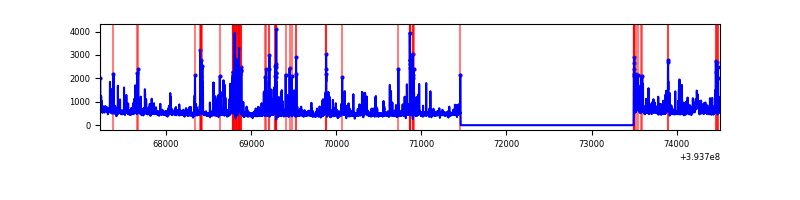 |
Top three noisy pixels from each quadrant. If the there are fewer than three noisy pixels in the level2.evt file, extra rows are filled as -1
| Pixel properties | Quadrant properties | ||||||
|---|---|---|---|---|---|---|---|
| Quadrant | DetID | PixID | Counts | Sigma | Mean | Median | Sigma |
| A | 10 | 83 | 194896 | 1483.86 | 662 | 652 | 130.9 |
| A | 13 | 254 | 10050 | 71.79 | 662 | 652 | 130.9 |
| A | 7 | 3 | 7299 | 50.78 | 662 | 652 | 130.9 |
| B | 5 | 172 | 580621 | 4908.32 | 638 | 624 | 118.2 |
| B | 0 | 189 | 217074 | 1831.74 | 638 | 624 | 118.2 |
| B | 5 | 255 | 165029 | 1391.3 | 638 | 624 | 118.2 |
| C | 0 | 10 | 327006 | 2311.22 | 619 | 624 | 141.2 |
| C | 15 | 214 | 225227 | 1590.49 | 619 | 624 | 141.2 |
| C | 15 | 159 | 7811 | 50.89 | 619 | 624 | 141.2 |
| D | 13 | 171 | 312285 | 2072.37 | 631 | 615 | 150.4 |
| D | 12 | 16 | 111527 | 737.48 | 631 | 615 | 150.4 |
| D | 10 | 199 | 85462 | 564.17 | 631 | 615 | 150.4 |
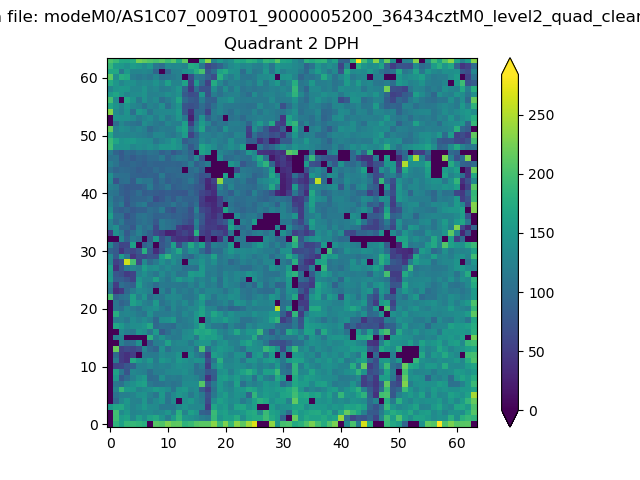
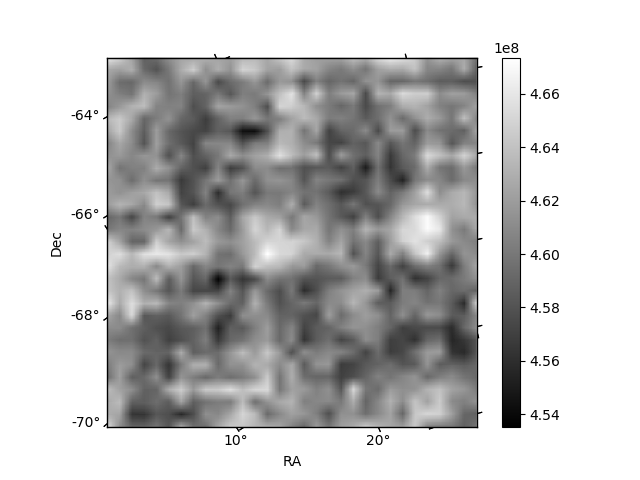
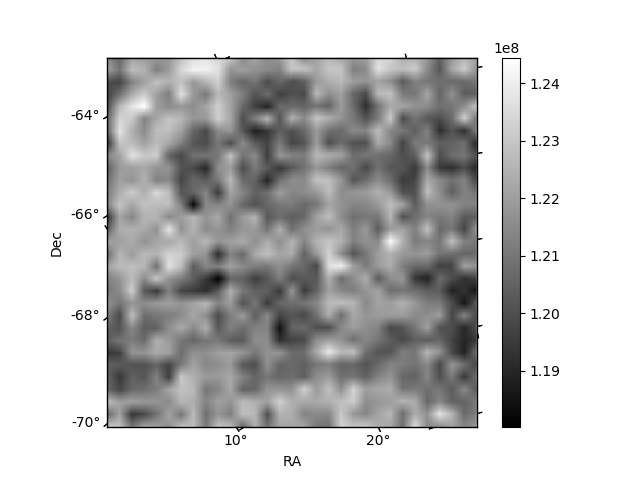
Histogram calculated using DETX and DETY for each event in the final _common_clean file
| Quadrant A | 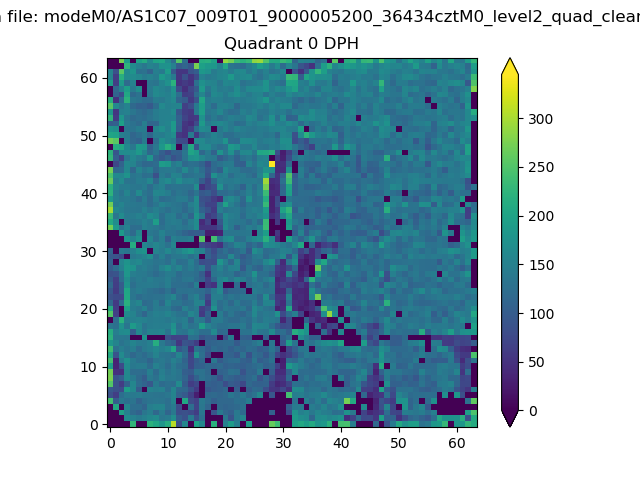 |
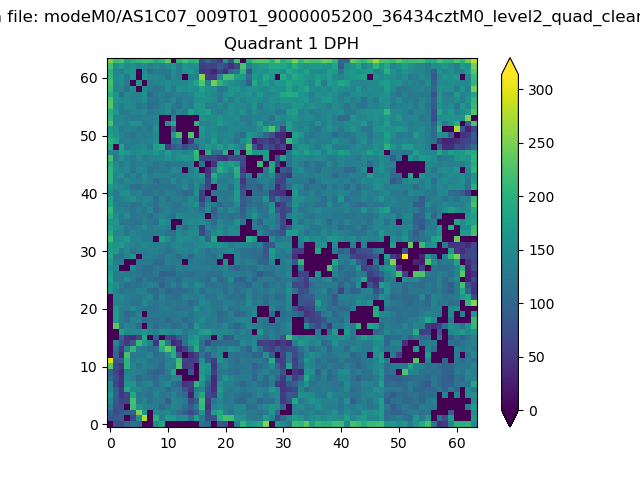 |
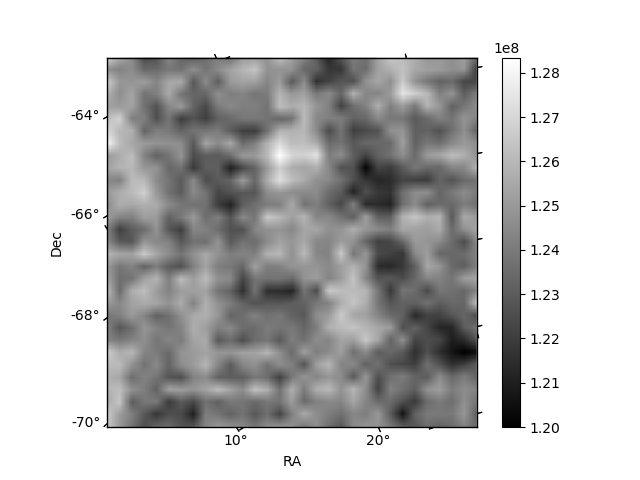
Quadrant B |
|---|---|---|---|
| Quadrant D | 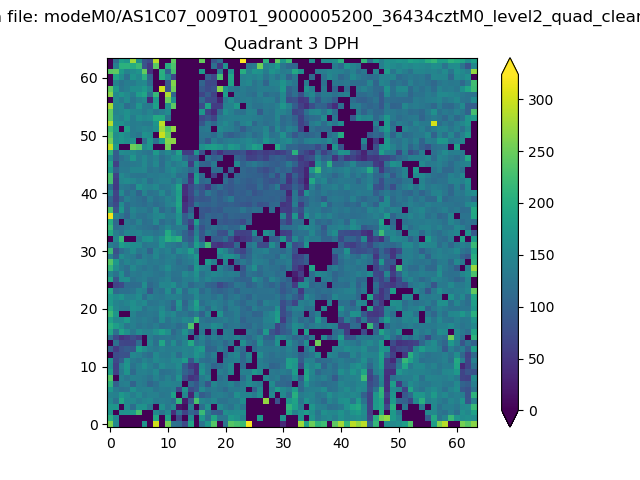 |
 |
Quadrant C |
| Plot type | Count rate plots | Images |
|---|---|---|
| Comparison with Poisson distribution Blue bars denote a histogram of data divided into 1 sec bins. Red curve is a Poisson curve with rate = median count rate of data. |
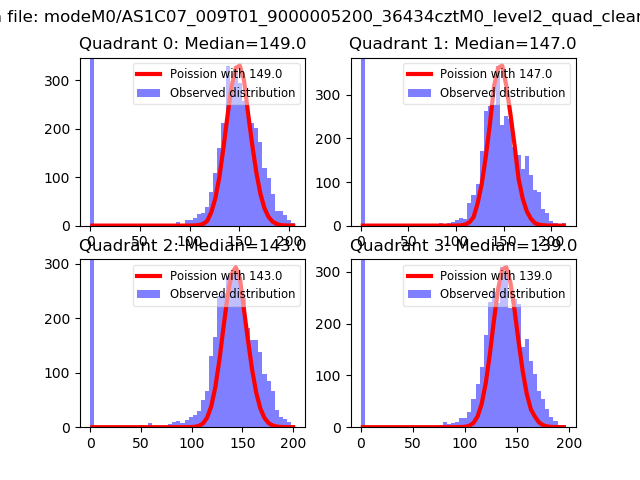 |
 |
| Quadrant-wise count rates Data is divided into 100 sec bins |
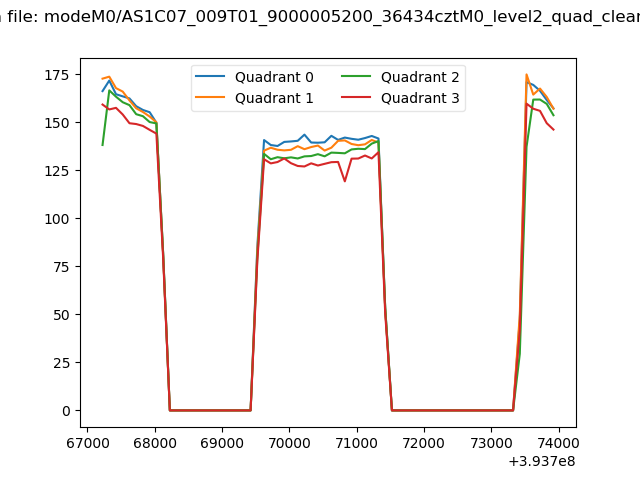 |
|
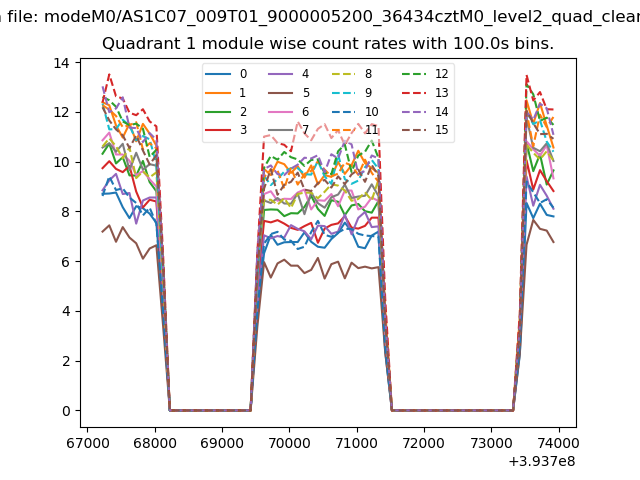
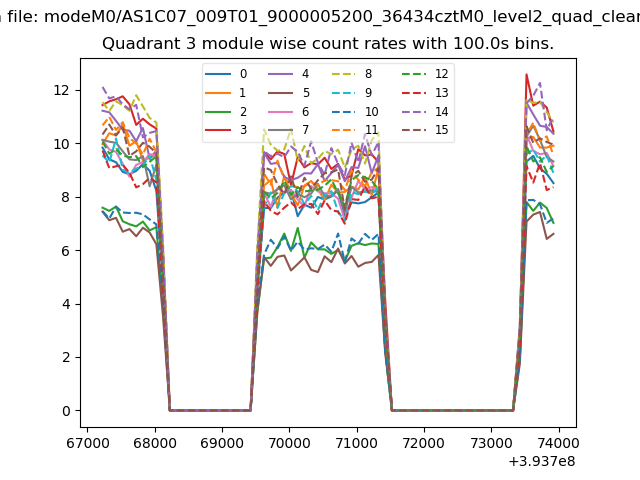
| Module-wise count rates for Quadrant A Data is divided into 100 sec bins |
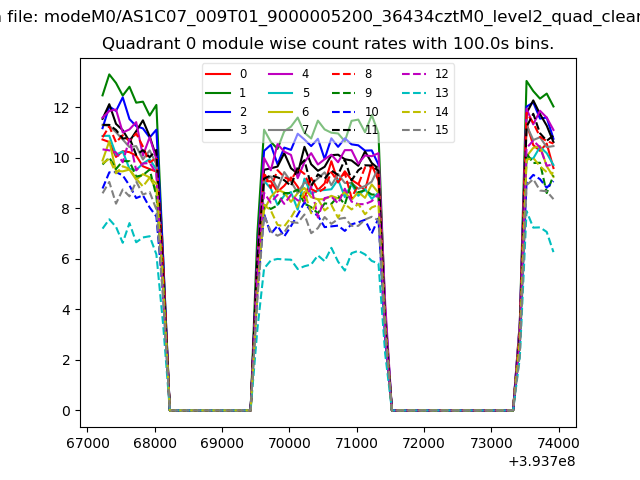 |
 |
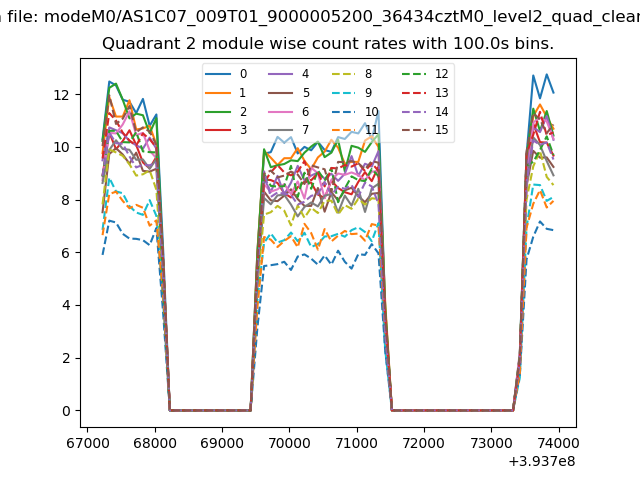
| Module-wise count rates for Quadrant B Data is divided into 100 sec bins |
 |
 |
| Module-wise count rates for Quadrant C Data is divided into 100 sec bins |
 |
 |
| Module-wise count rates for Quadrant D Data is divided into 100 sec bins |
 |
 |
| Parameter | Plot |
|---|---|
| CZT HV Monitor | 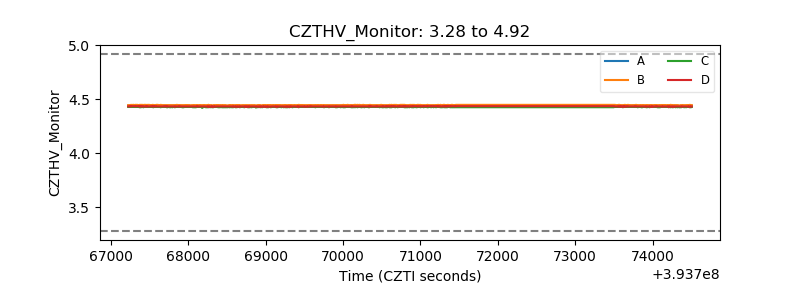 |
| D_VDD | 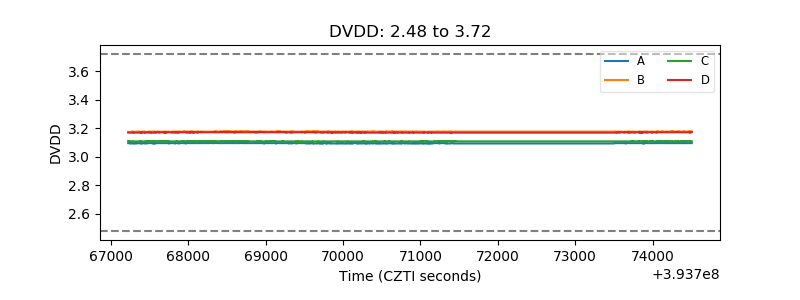 |
| Temperature 1 | 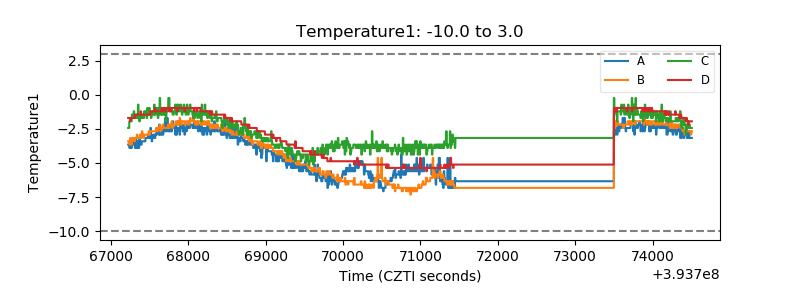 |
| Veto HV Monitor |  |
| Veto LLD | 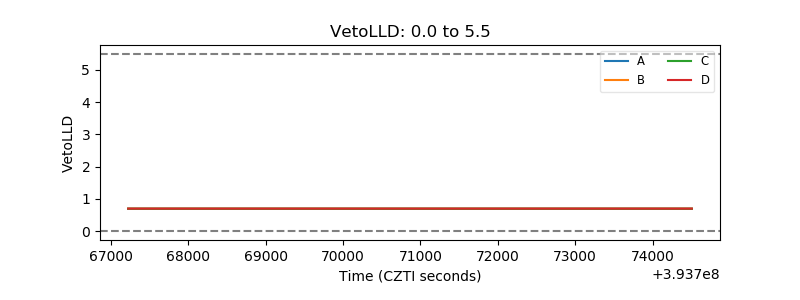 |
| Alpha Counter | 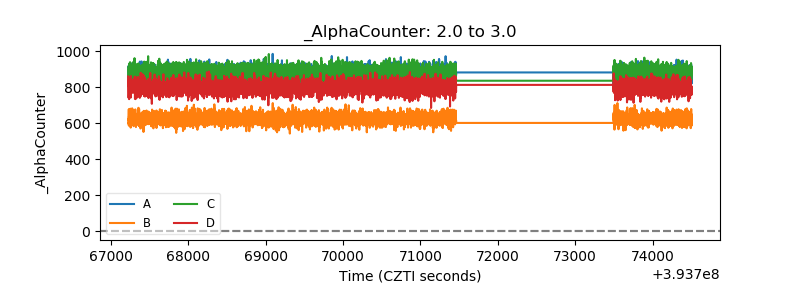 |
| _CPM_Rate | 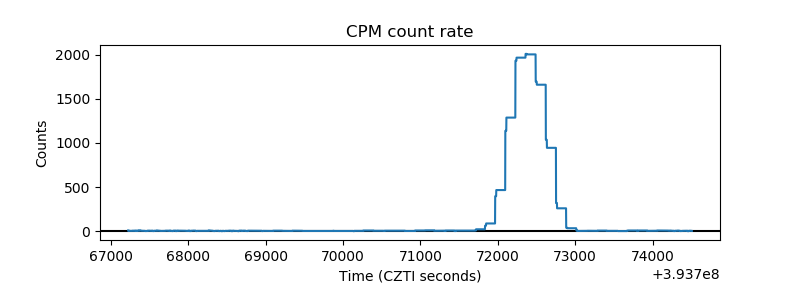 |
| CZT Counter | 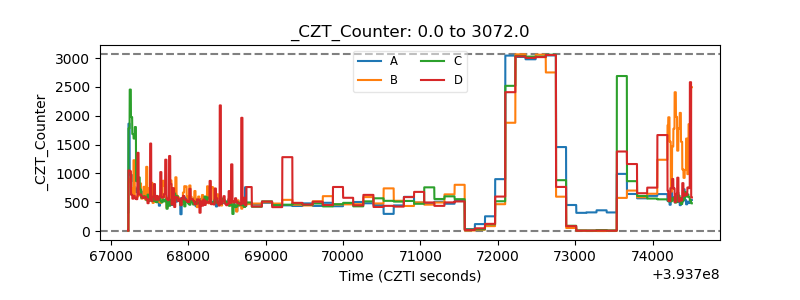 |
| +2.5 Volts monitor | 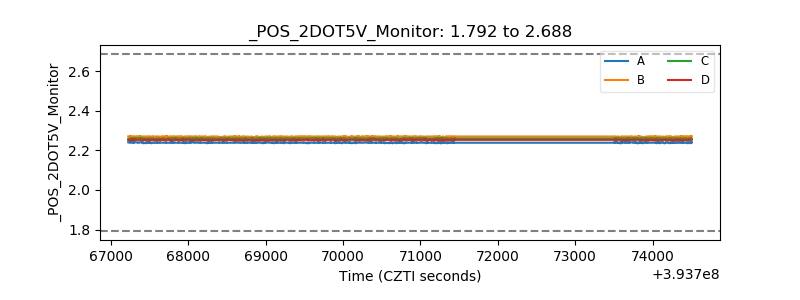 |
| +5 Volts monitor | 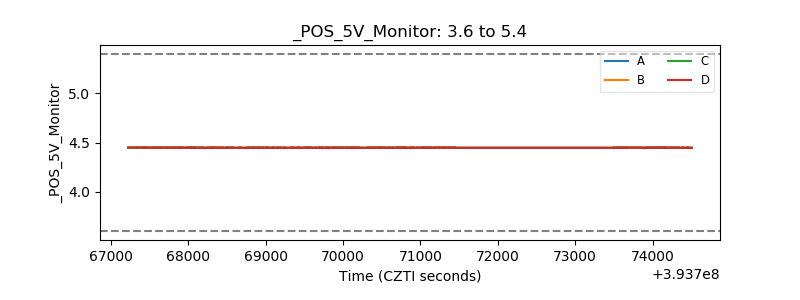 |
| _ROLL_ROT | 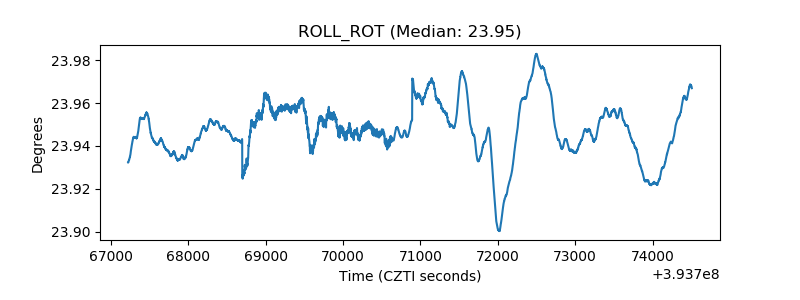 |
| _Roll_DEC | 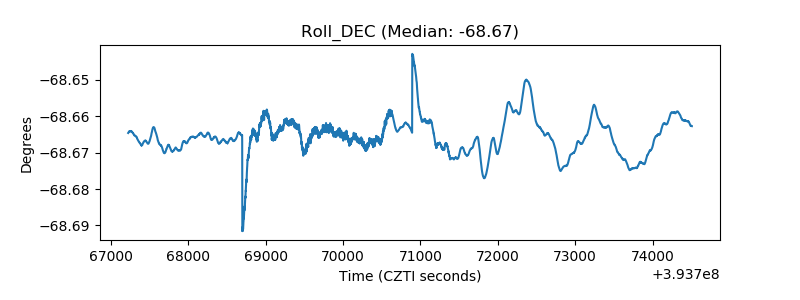 |
| _Roll_RA | 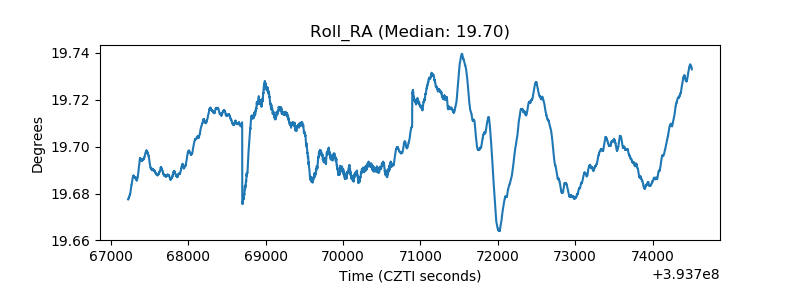 |
| Veto Counter | 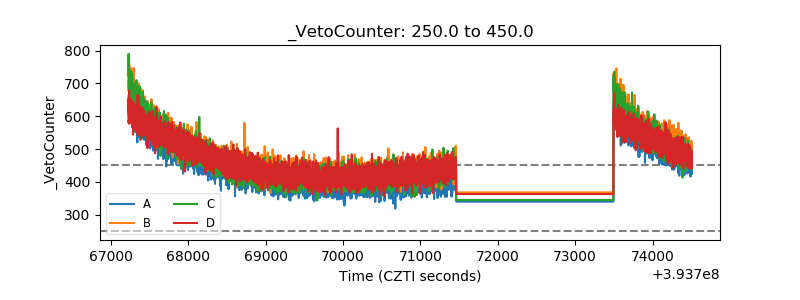 |