| Param | Original file | Final file |
|---|---|---|
| Filename | modeM0/AS1C07_009T01_9000005200_36432cztM0_level2.evt | modeM0/AS1C07_009T01_9000005200_36432cztM0_level2_quad_clean.evt |
| Size (bytes) | 478,598,400 | 94,605,120 |
| Size | 456.4 MB | 90.2 MB |
| Events in quadrant A | 2,953,651 | 621,515 |
| Events in quadrant B | 3,645,353 | 617,892 |
| Events in quadrant C | 3,236,256 | 614,683 |
| Events in quadrant D | 4,250,695 | 590,423 |
| Mode M0 | |||
|---|---|---|---|
| Quadrant | BADHDUFLAG | Total packets | Discarded packets |
| A | 0 | 12599 | 3 |
| B | 0 | 14639 | 2 |
| C | 0 | 13243 | 2 |
| D | 0 | 16652 | 2 |
| Mode SS | |||
|---|---|---|---|
| Quadrant | BADHDUFLAG | Total packets | Discarded packets |
| A | 0 | 126 | 0 |
| B | 0 | 126 | 0 |
| C | 0 | 126 | 0 |
| D | 0 | 126 | 0 |
| Mode M9 | |||
|---|---|---|---|
| Quadrant | BADHDUFLAG | Total packets | Discarded packets |
| A | 0 | 35 | 0 |
| B | 0 | 35 | 0 |
| C | 0 | 35 | 0 |
| D | 0 | 35 | 0 |
| Quadrant | Total seconds | Saturated seconds | Saturation percentage |
|---|---|---|---|
| A | 6015 | 10 | 0.166251% |
| B | 6015 | 100 | 1.662510% |
| C | 6015 | 82 | 1.363259% |
| D | 6015 | 208 | 3.458022% |
Noise dominated data is calculated using 1-second bins in cleaned event files. If a bin has >2000 counts, and if more than 50% of those come from <1% of pixels, then it is considered to be noise-dominated and hence unusable.
| Quadrant | # 1 sec bins | Bins with >0 counts | Bins with >2000 counts | High rate bins dominated by noise | Noise dominated (total time) | Noise dominated (detector-on time) | Marked lightcurve |
|---|---|---|---|---|---|---|---|
| A | 9511 | 6017 | 0 | 0 | 0.00% | 0.00% | 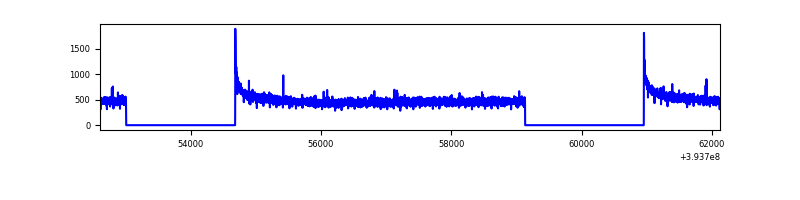 |
| B | 9511 | 6017 | 56 | 56 | 0.59% | 0.93% | 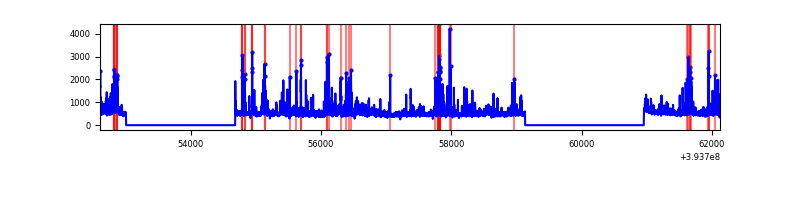 |
| C | 9511 | 6017 | 52 | 52 | 0.55% | 0.86% | 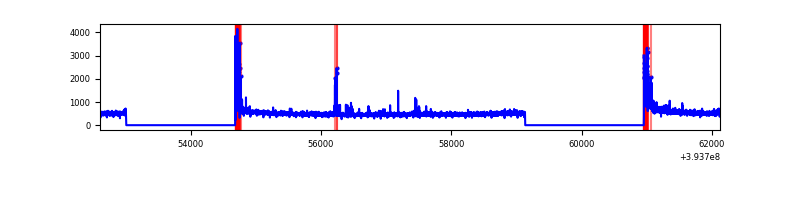 |
| D | 9511 | 6017 | 195 | 195 | 2.05% | 3.24% | 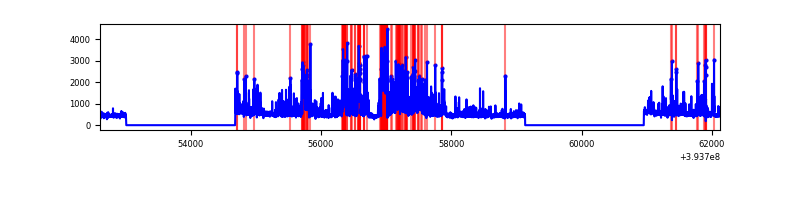 |
Top three noisy pixels from each quadrant. If the there are fewer than three noisy pixels in the level2.evt file, extra rows are filled as -1
| Pixel properties | Quadrant properties | ||||||
|---|---|---|---|---|---|---|---|
| Quadrant | DetID | PixID | Counts | Sigma | Mean | Median | Sigma |
| A | 10 | 83 | 202629 | 1421.72 | 709 | 694 | 142.0 |
| A | 13 | 254 | 10482 | 68.91 | 709 | 694 | 142.0 |
| A | 3 | 137 | 7220 | 45.95 | 709 | 694 | 142.0 |
| B | 5 | 255 | 254275 | 1963.81 | 692 | 677 | 129.1 |
| B | 0 | 189 | 164645 | 1269.73 | 692 | 677 | 129.1 |
| B | 5 | 172 | 146278 | 1127.5 | 692 | 677 | 129.1 |
| C | 0 | 10 | 274047 | 1739.21 | 682 | 685 | 157.2 |
| C | 15 | 214 | 258088 | 1637.67 | 682 | 685 | 157.2 |
| C | 12 | 249 | 32030 | 199.43 | 682 | 685 | 157.2 |
| D | 12 | 227 | 1037908 | 6302.79 | 687 | 668 | 164.6 |
| D | 12 | 16 | 107171 | 647.16 | 687 | 668 | 164.6 |
| D | 10 | 199 | 92726 | 559.39 | 687 | 668 | 164.6 |
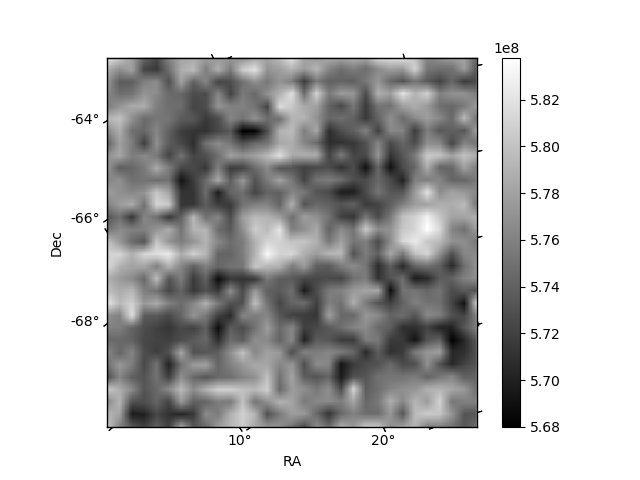
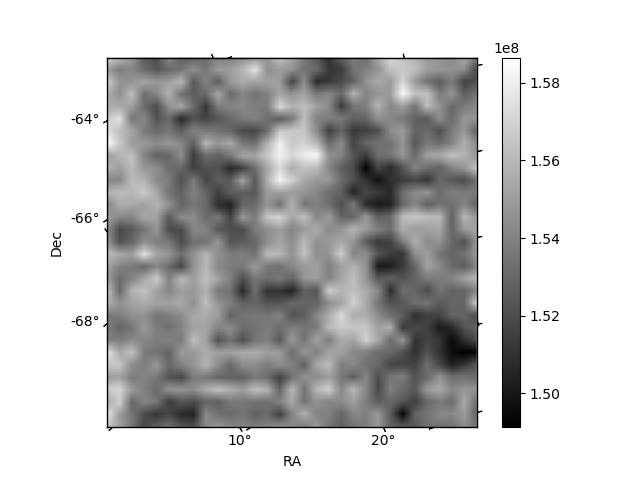
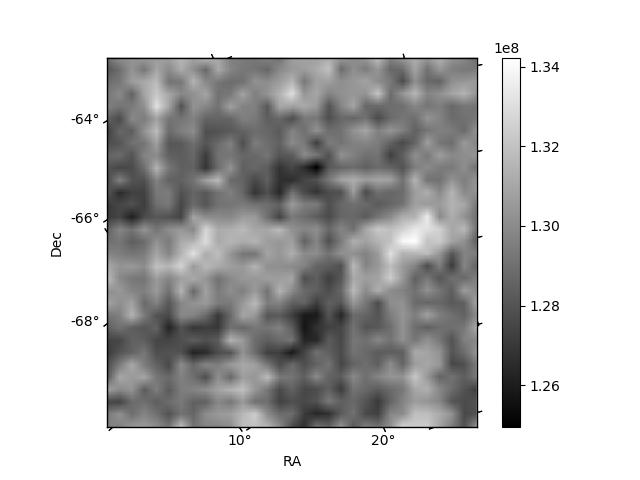
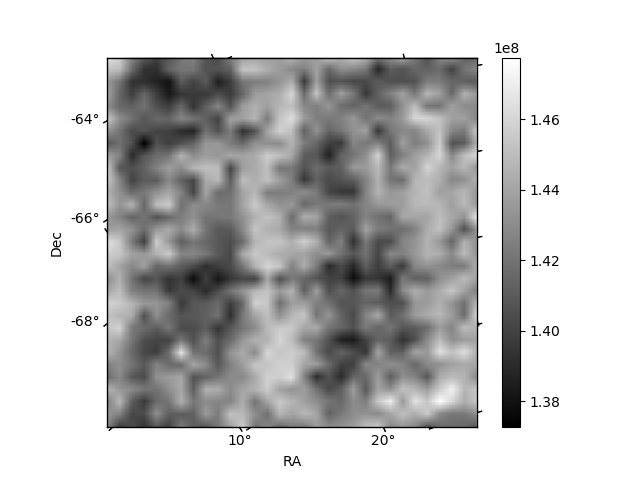
Histogram calculated using DETX and DETY for each event in the final _common_clean file
| Quadrant A | 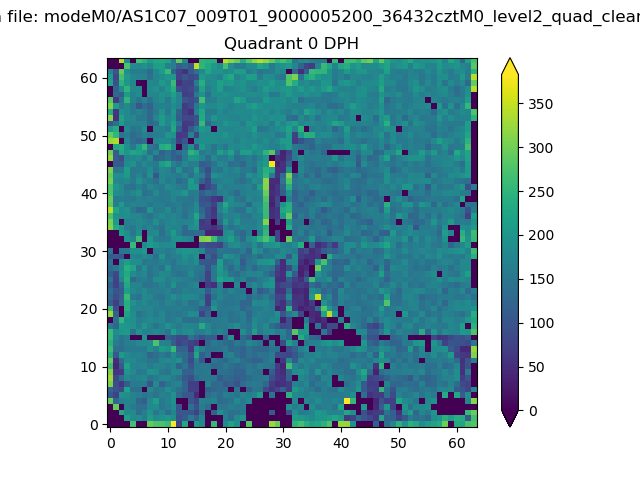 |
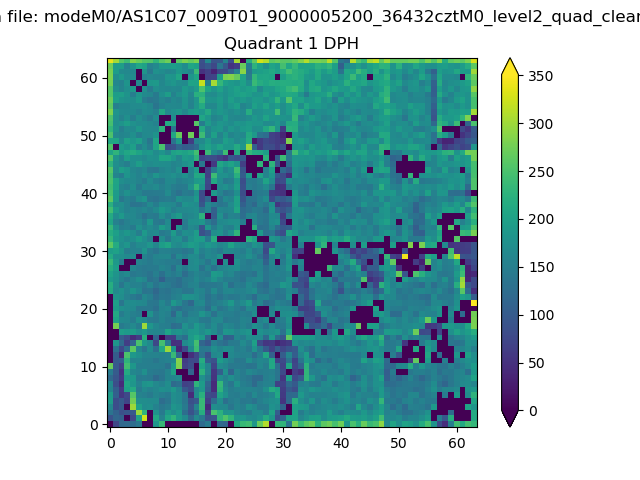 |
Quadrant B |
|---|---|---|---|
| Quadrant D | 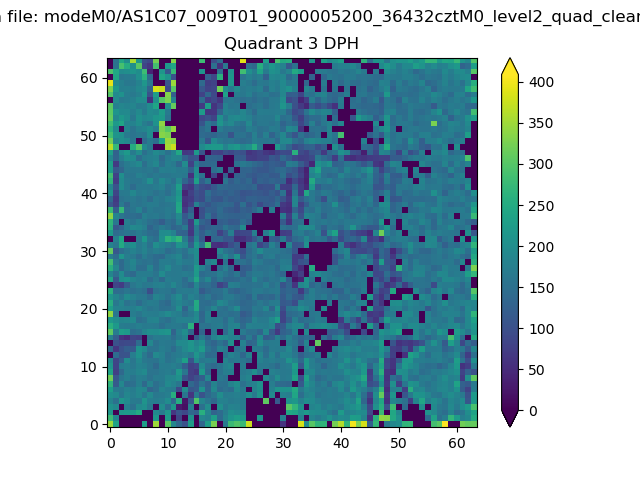 |
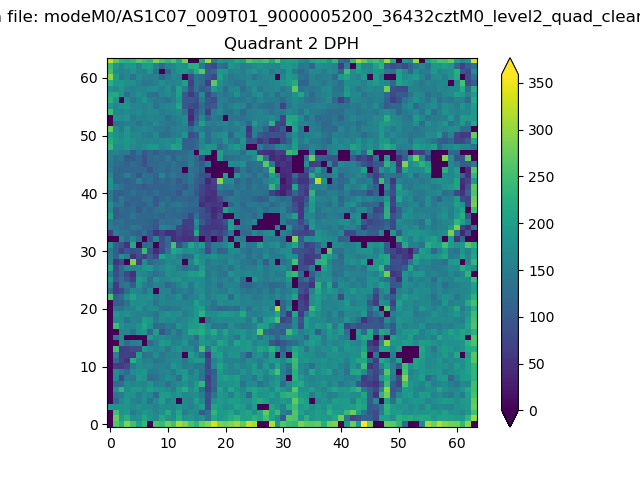 |
Quadrant C |
| Plot type | Count rate plots | Images |
|---|---|---|
| Comparison with Poisson distribution Blue bars denote a histogram of data divided into 1 sec bins. Red curve is a Poisson curve with rate = median count rate of data. |
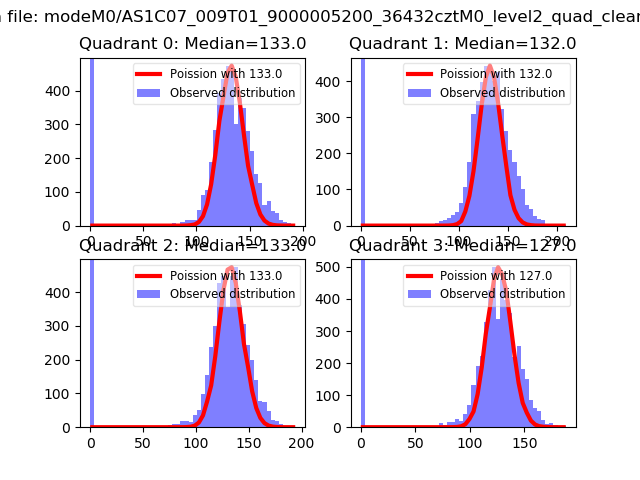 |
 |
| Quadrant-wise count rates Data is divided into 100 sec bins |
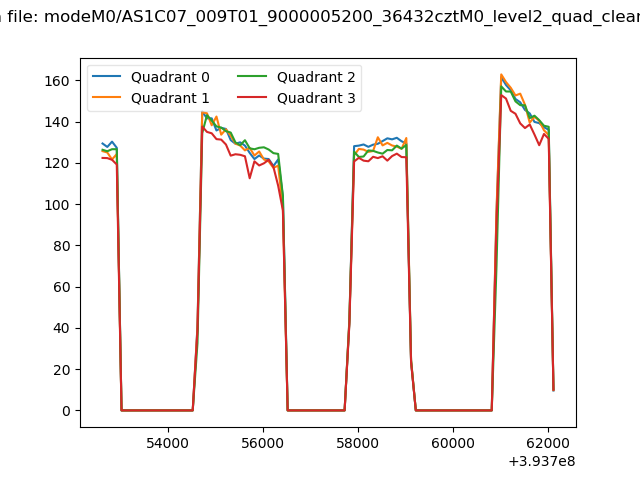 |
|
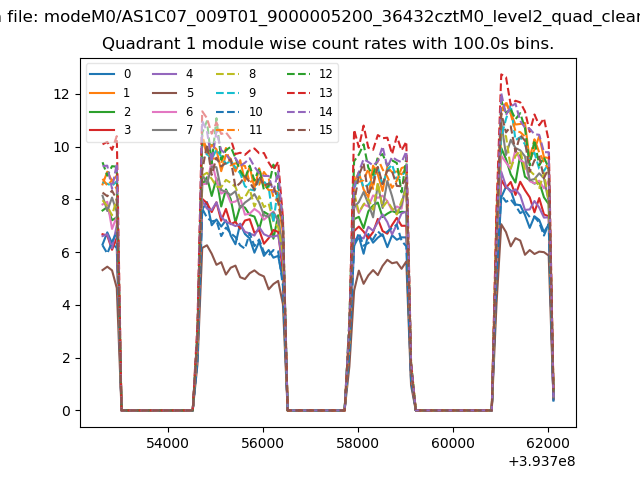
| Module-wise count rates for Quadrant A Data is divided into 100 sec bins |
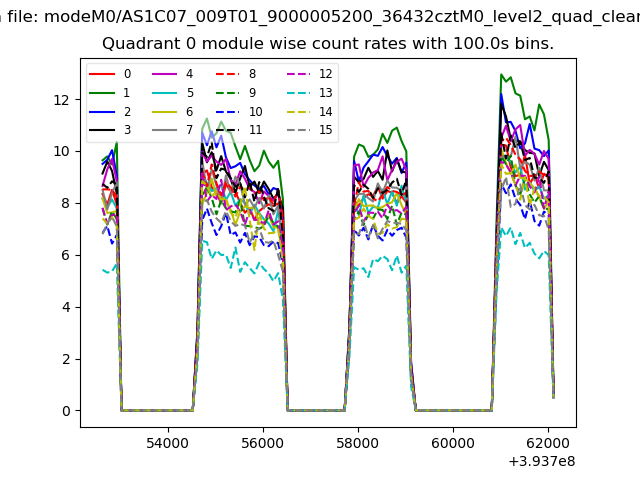 |
 |
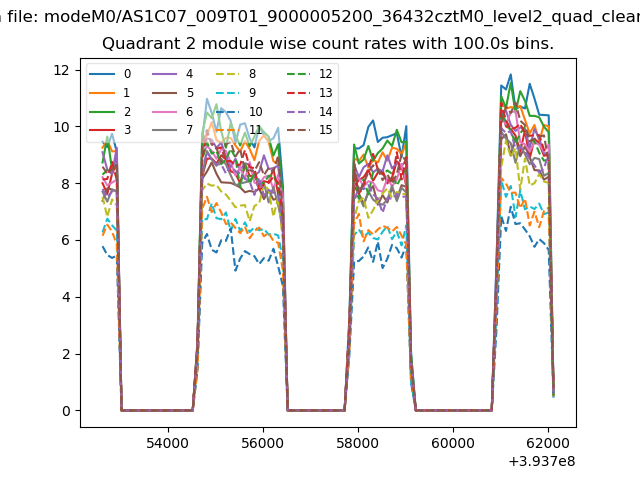
| Module-wise count rates for Quadrant B Data is divided into 100 sec bins |
 |
 |
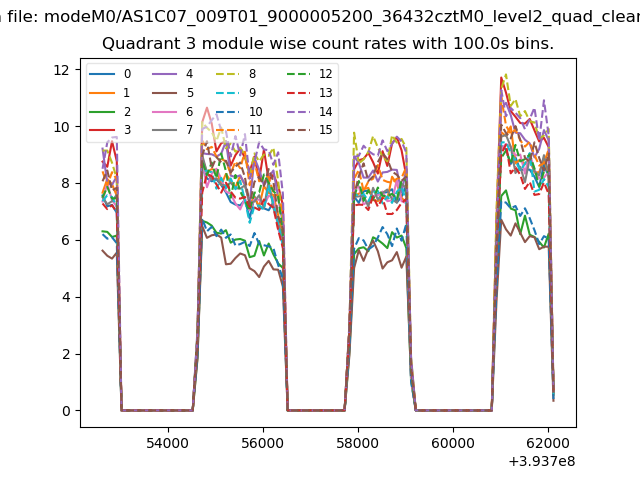
| Module-wise count rates for Quadrant C Data is divided into 100 sec bins |
 |
 |
| Module-wise count rates for Quadrant D Data is divided into 100 sec bins |
 |
 |
| Parameter | Plot |
|---|---|
| CZT HV Monitor | 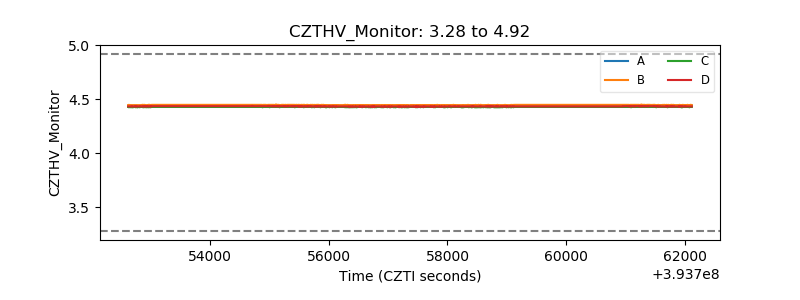 |
| D_VDD | 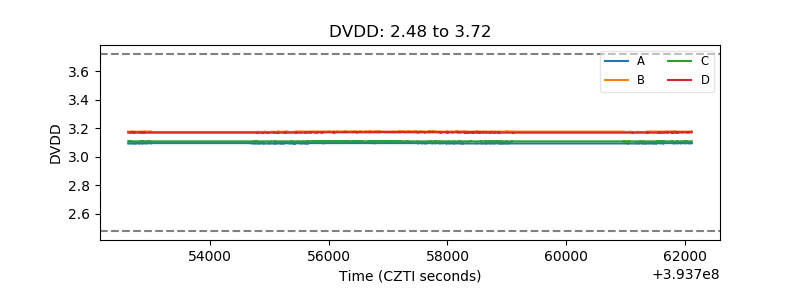 |
| Temperature 1 | 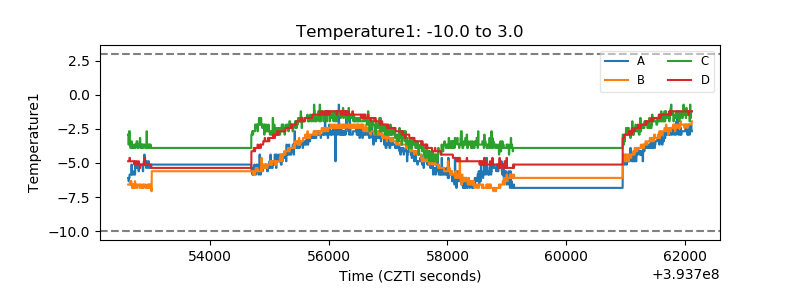 |
| Veto HV Monitor | 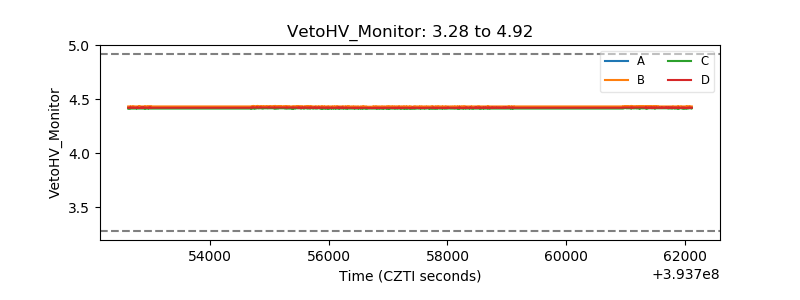 |
| Veto LLD | 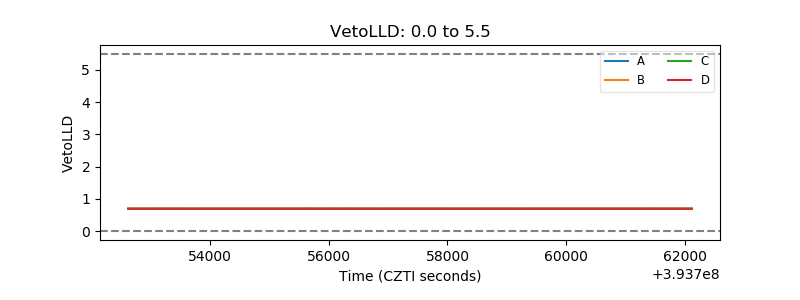 |
| Alpha Counter | 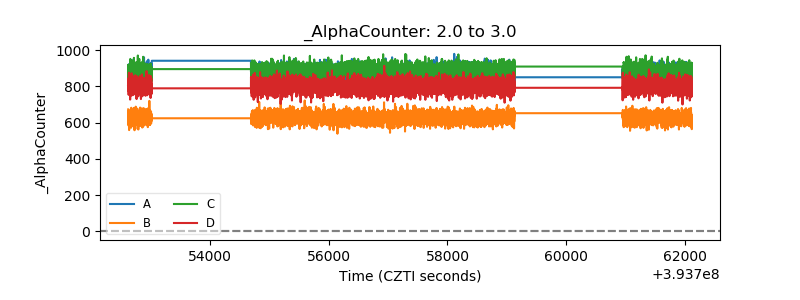 |
| _CPM_Rate | 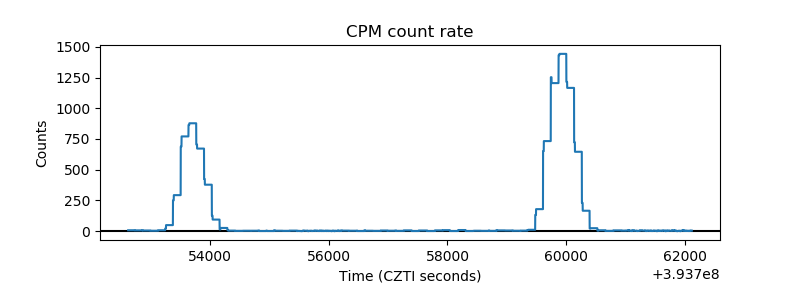 |
| CZT Counter | 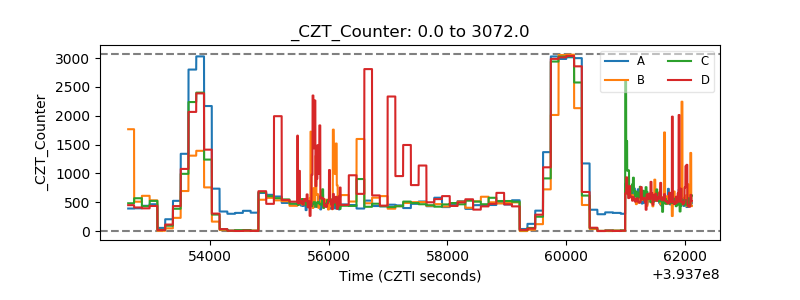 |
| +2.5 Volts monitor | 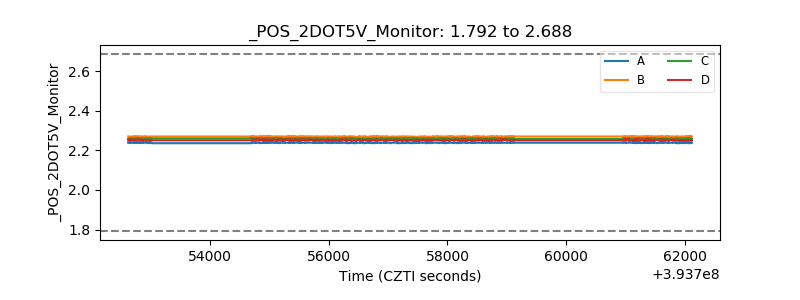 |
| +5 Volts monitor | 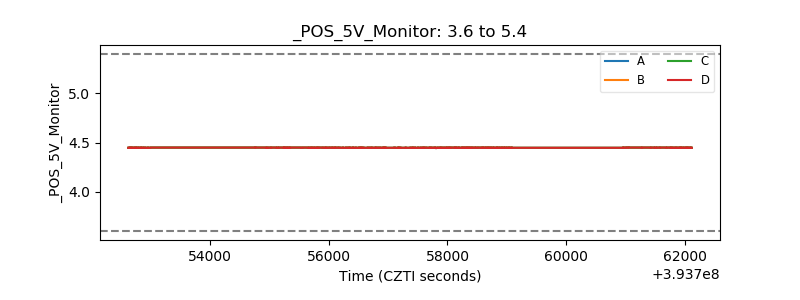 |
| _ROLL_ROT | 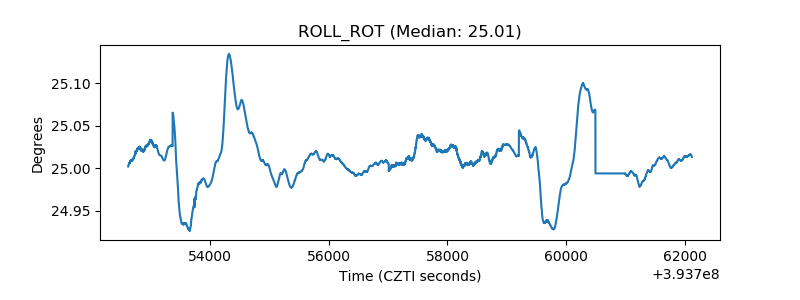 |
| _Roll_DEC | 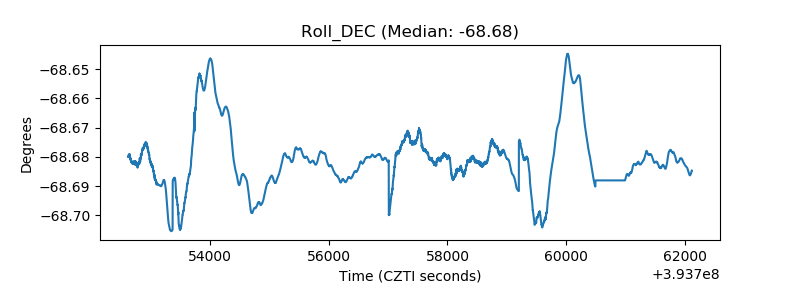 |
| _Roll_RA | 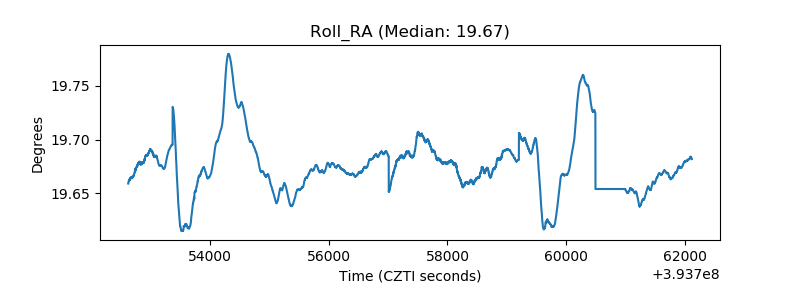 |
| Veto Counter | 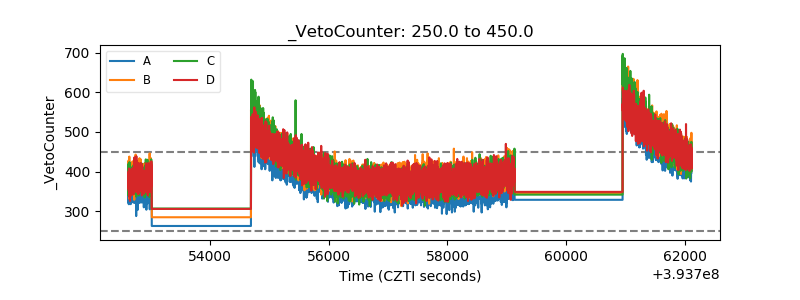 |