| Param | Original file | Final file |
|---|---|---|
| Filename | modeM0/AS1C07_009T01_9000005200_36430cztM0_level2.evt | modeM0/AS1C07_009T01_9000005200_36430cztM0_level2_quad_clean.evt |
| Size (bytes) | 1,454,785,920 | 254,160,000 |
| Size | 1.4 GB | 242.4 MB |
| Events in quadrant A | 8,937,442 | 1,618,317 |
| Events in quadrant B | 14,196,613 | 1,594,495 |
| Events in quadrant C | 9,339,766 | 1,627,191 |
| Events in quadrant D | 10,301,985 | 1,549,399 |
| Mode M0 | |||
|---|---|---|---|
| Quadrant | BADHDUFLAG | Total packets | Discarded packets |
| A | 0 | 38945 | 4 |
| B | 0 | 54853 | 4 |
| C | 0 | 39380 | 4 |
| D | 0 | 43492 | 4 |
| Mode SS | |||
|---|---|---|---|
| Quadrant | BADHDUFLAG | Total packets | Discarded packets |
| A | 0 | 388 | 0 |
| B | 0 | 388 | 0 |
| C | 0 | 388 | 0 |
| D | 0 | 388 | 0 |
| Mode M9 | |||
|---|---|---|---|
| Quadrant | BADHDUFLAG | Total packets | Discarded packets |
| A | 0 | 65 | 0 |
| B | 0 | 64 | 0 |
| C | 0 | 64 | 0 |
| D | 0 | 64 | 0 |
| Quadrant | Total seconds | Saturated seconds | Saturation percentage |
|---|---|---|---|
| A | 18991 | 19 | 0.100047% |
| B | 18991 | 1563 | 8.230214% |
| C | 18991 | 76 | 0.400190% |
| D | 18991 | 190 | 1.000474% |
Noise dominated data is calculated using 1-second bins in cleaned event files. If a bin has >2000 counts, and if more than 50% of those come from <1% of pixels, then it is considered to be noise-dominated and hence unusable.
| Quadrant | # 1 sec bins | Bins with >0 counts | Bins with >2000 counts | High rate bins dominated by noise | Noise dominated (total time) | Noise dominated (detector-on time) | Marked lightcurve |
|---|---|---|---|---|---|---|---|
| A | 23377 | 18994 | 7 | 7 | 0.03% | 0.04% | 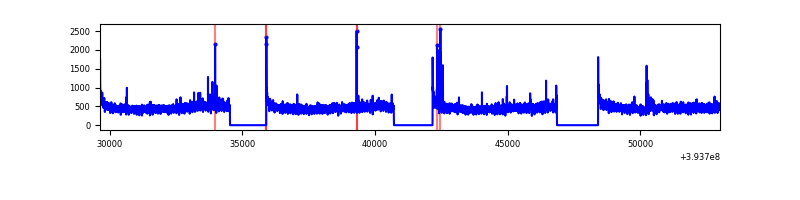 |
| B | 23377 | 18993 | 1127 | 1127 | 4.82% | 5.93% | 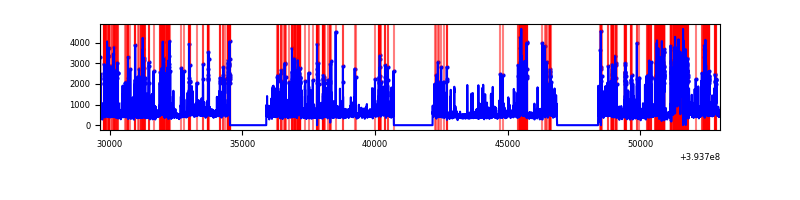 |
| C | 23377 | 18994 | 45 | 45 | 0.19% | 0.24% | 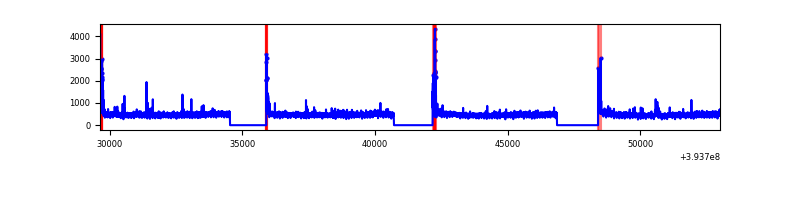 |
| D | 23377 | 18994 | 148 | 148 | 0.63% | 0.78% | 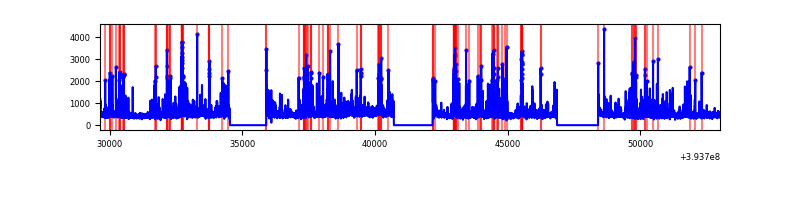 |
Top three noisy pixels from each quadrant. If the there are fewer than three noisy pixels in the level2.evt file, extra rows are filled as -1
| Pixel properties | Quadrant properties | ||||||
|---|---|---|---|---|---|---|---|
| Quadrant | DetID | PixID | Counts | Sigma | Mean | Median | Sigma |
| A | 10 | 83 | 520440 | 1209.49 | 2140 | 2099 | 428.6 |
| A | 9 | 143 | 71439 | 161.8 | 2140 | 2099 | 428.6 |
| A | 13 | 254 | 34791 | 76.28 | 2140 | 2099 | 428.6 |
| B | 5 | 172 | 3985522 | 10387.85 | 2029 | 1971 | 383.5 |
| B | 5 | 255 | 1284987 | 3345.7 | 2029 | 1971 | 383.5 |
| B | 0 | 189 | 403185 | 1046.24 | 2029 | 1971 | 383.5 |
| C | 15 | 214 | 804769 | 1681.13 | 2080 | 2092 | 477.5 |
| C | 0 | 10 | 347119 | 722.63 | 2080 | 2092 | 477.5 |
| C | 12 | 249 | 39731 | 78.83 | 2080 | 2092 | 477.5 |
| D | 2 | 249 | 379295 | 749.37 | 2092 | 2038 | 503.4 |
| D | 12 | 16 | 329682 | 650.82 | 2092 | 2038 | 503.4 |
| D | 10 | 199 | 289297 | 570.6 | 2092 | 2038 | 503.4 |
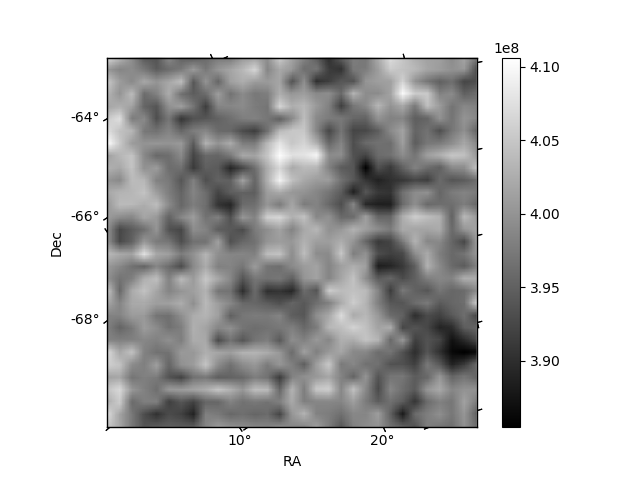
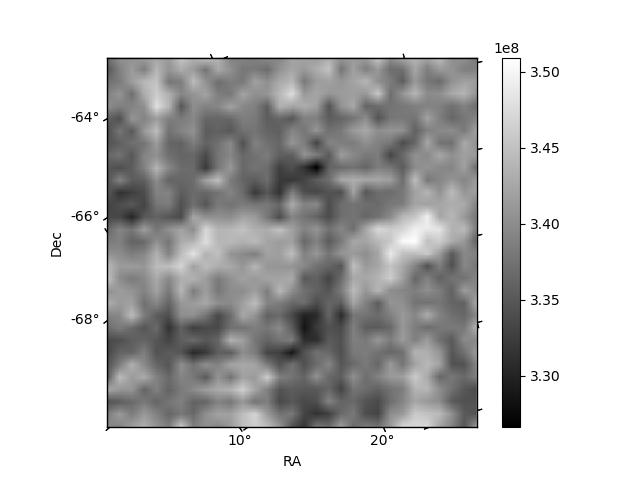
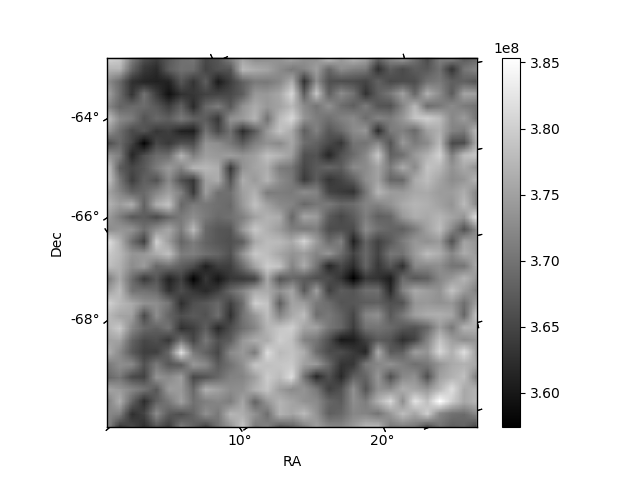
Histogram calculated using DETX and DETY for each event in the final _common_clean file
| Quadrant A | 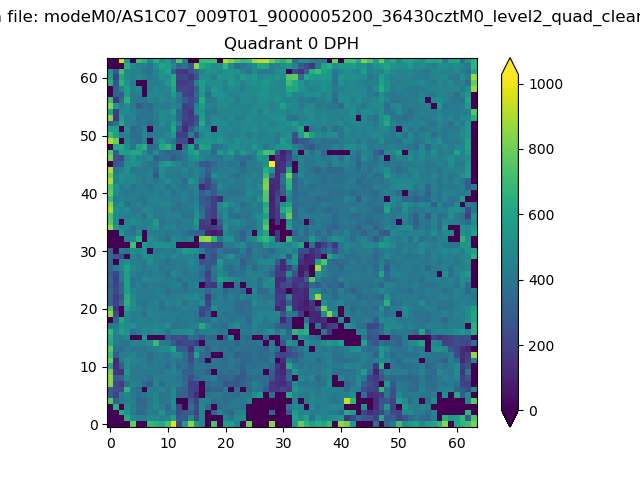 |
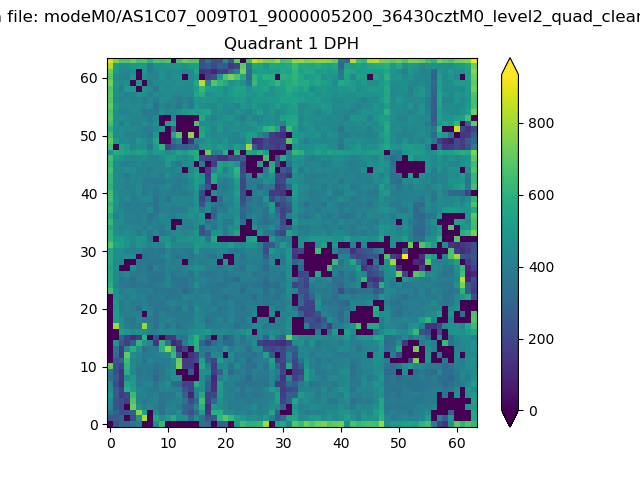 |
Quadrant B |
|---|---|---|---|
| Quadrant D | 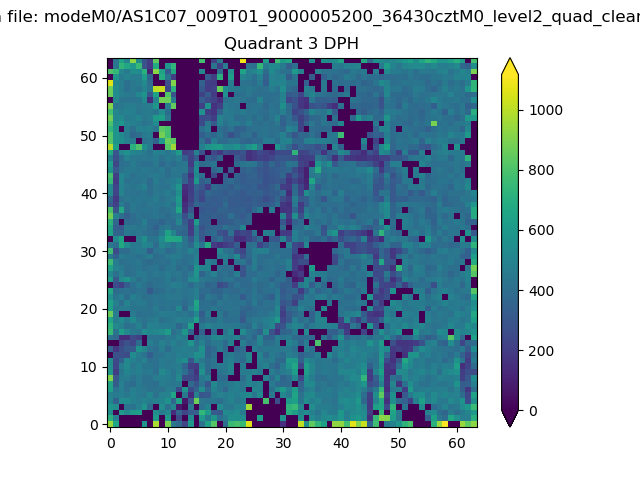 |
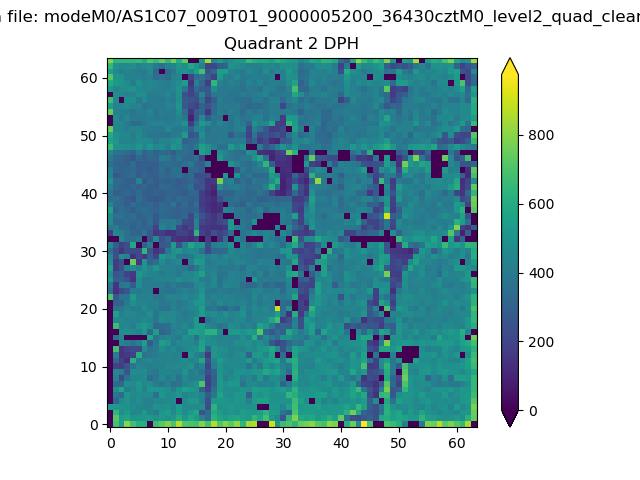 |
Quadrant C |
| Plot type | Count rate plots | Images |
|---|---|---|
| Comparison with Poisson distribution Blue bars denote a histogram of data divided into 1 sec bins. Red curve is a Poisson curve with rate = median count rate of data. |
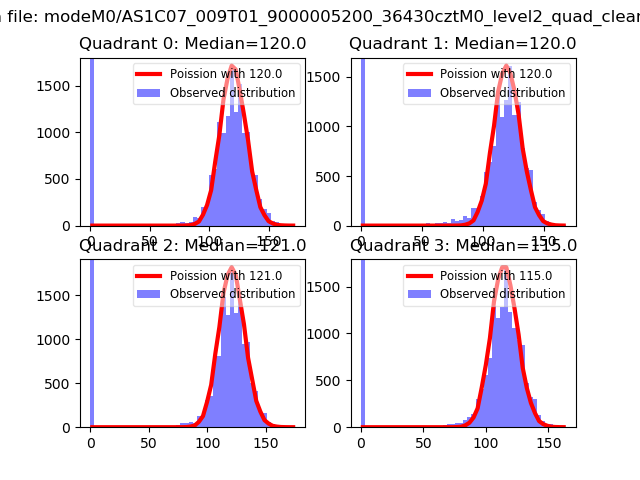 |
 |
| Quadrant-wise count rates Data is divided into 100 sec bins |
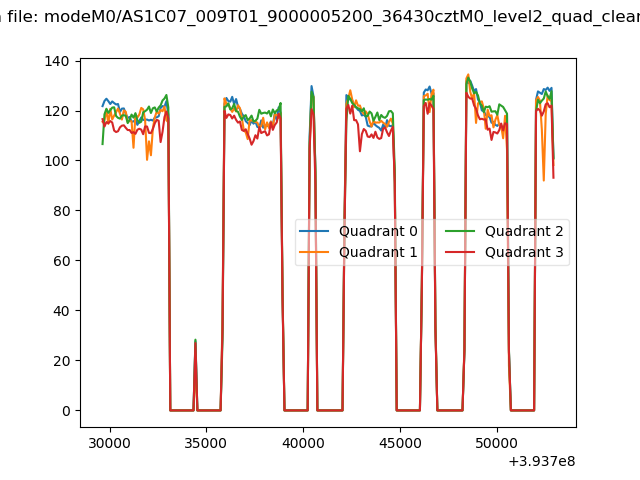 |
|
| Module-wise count rates for Quadrant A Data is divided into 100 sec bins |
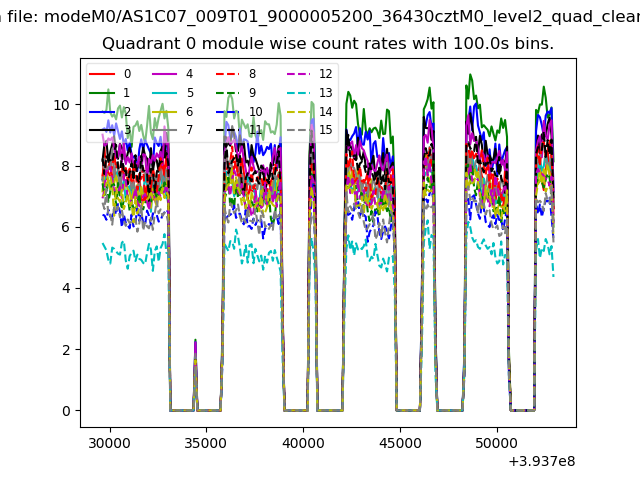 |
 |
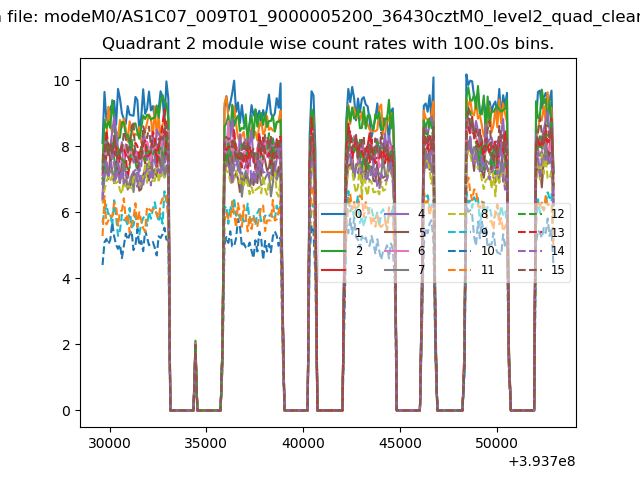
| Module-wise count rates for Quadrant B Data is divided into 100 sec bins |
 |
 |
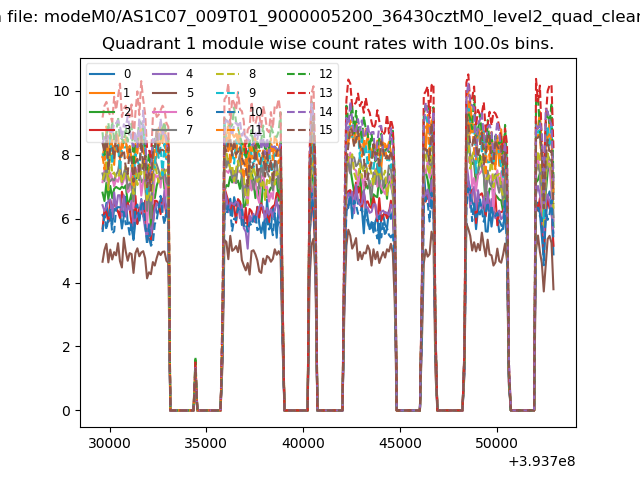
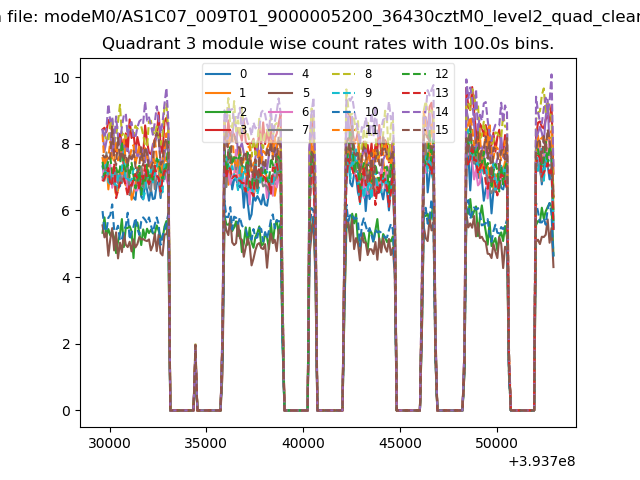
| Module-wise count rates for Quadrant C Data is divided into 100 sec bins |
 |
 |
| Module-wise count rates for Quadrant D Data is divided into 100 sec bins |
 |
 |
| Parameter | Plot |
|---|---|
| CZT HV Monitor | 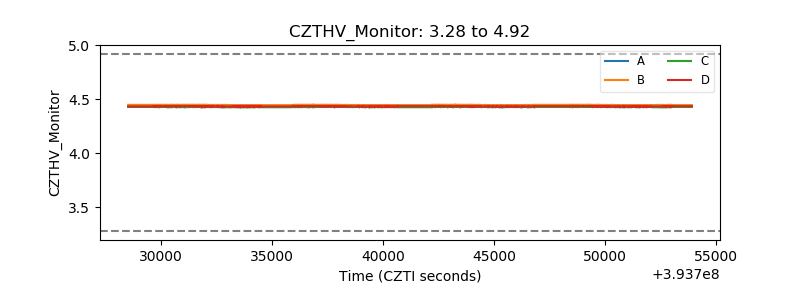 |
| D_VDD | 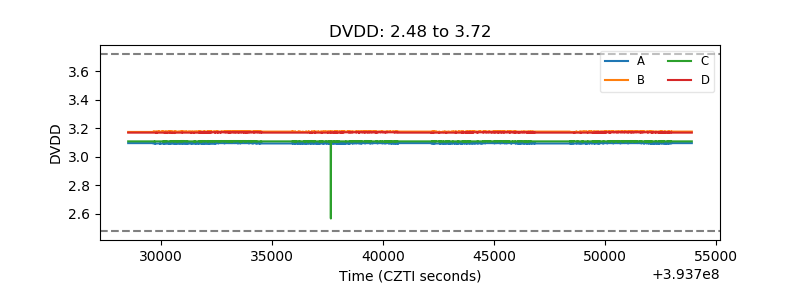 |
| Temperature 1 | 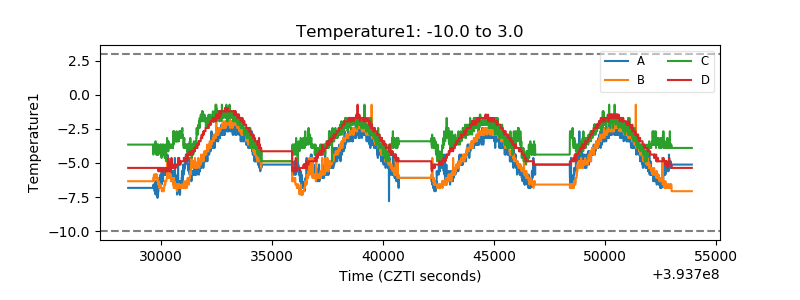 |
| Veto HV Monitor | 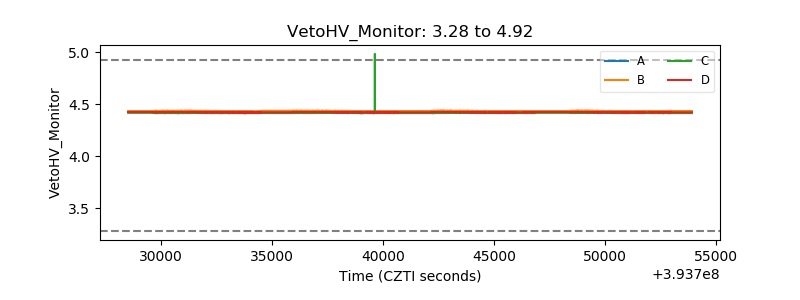 |
| Veto LLD | 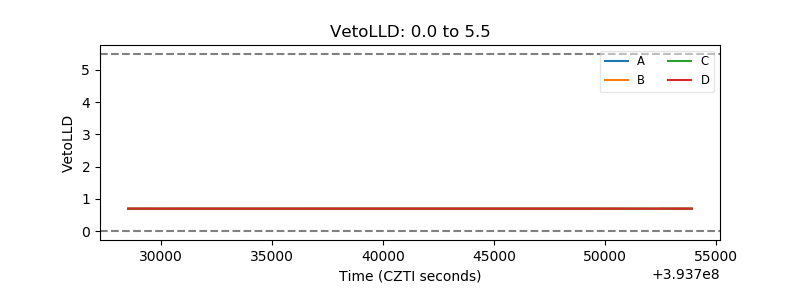 |
| Alpha Counter | 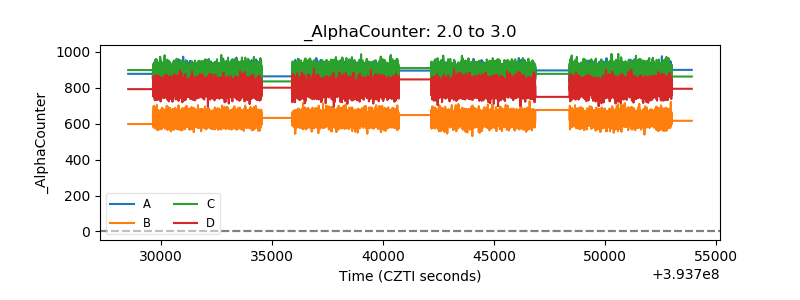 |
| _CPM_Rate | 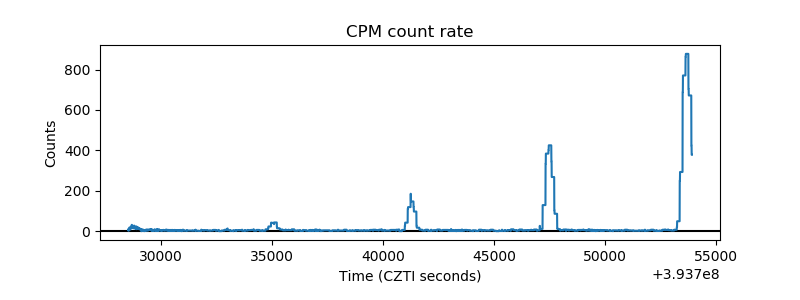 |
| CZT Counter | 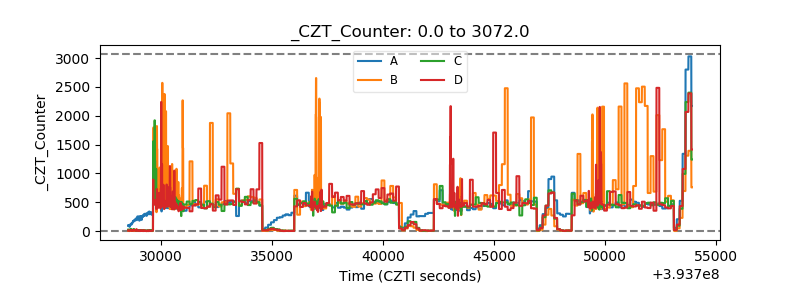 |
| +2.5 Volts monitor | 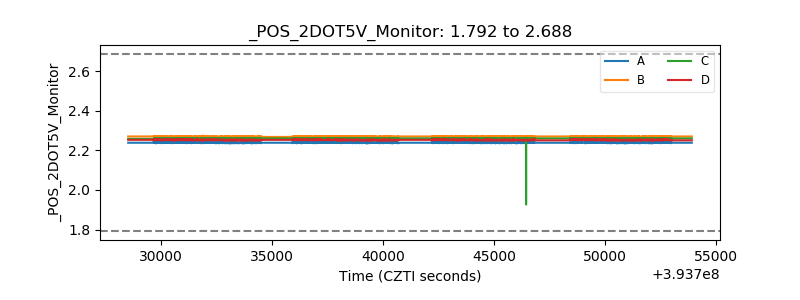 |
| +5 Volts monitor | 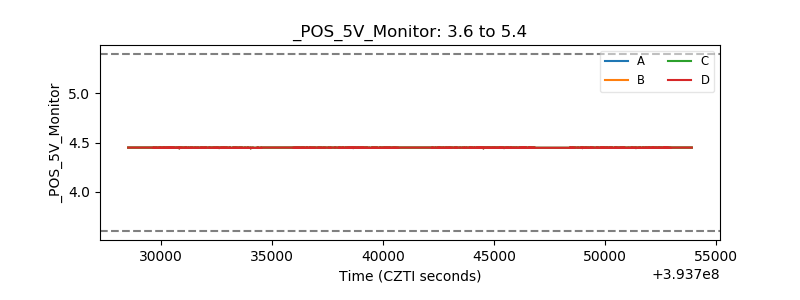 |
| _ROLL_ROT | 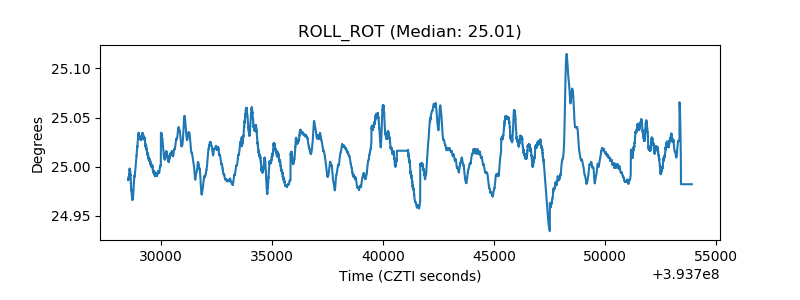 |
| _Roll_DEC | 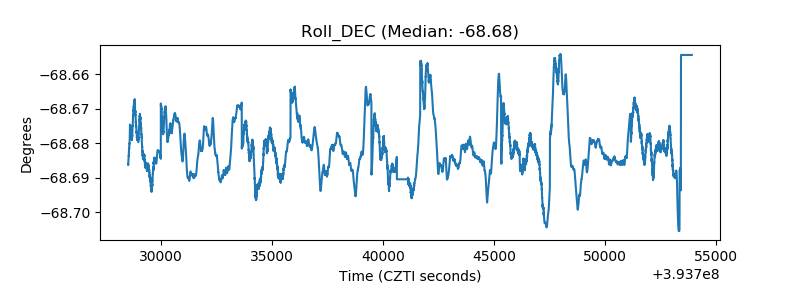 |
| _Roll_RA | 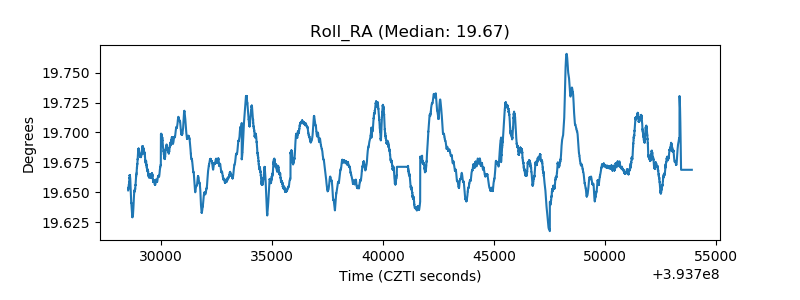 |
| Veto Counter | 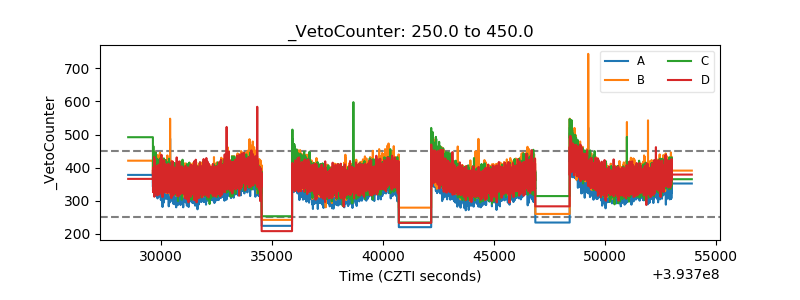 |