| Param | Original file | Final file |
|---|---|---|
| Filename | modeM0/AS1C07_009T01_9000005200_36426cztM0_level2.evt | modeM0/AS1C07_009T01_9000005200_36426cztM0_level2_quad_clean.evt |
| Size (bytes) | 454,288,320 | 90,630,720 |
| Size | 433.2 MB | 86.4 MB |
| Events in quadrant A | 2,825,056 | 595,391 |
| Events in quadrant B | 3,993,785 | 581,453 |
| Events in quadrant C | 3,104,720 | 590,323 |
| Events in quadrant D | 3,429,882 | 561,053 |
| Mode M0 | |||
|---|---|---|---|
| Quadrant | BADHDUFLAG | Total packets | Discarded packets |
| A | 0 | 12284 | 3 |
| B | 0 | 15844 | 2 |
| C | 0 | 12827 | 2 |
| D | 0 | 14349 | 2 |
| Mode SS | |||
|---|---|---|---|
| Quadrant | BADHDUFLAG | Total packets | Discarded packets |
| A | 0 | 122 | 0 |
| B | 0 | 122 | 0 |
| C | 0 | 122 | 0 |
| D | 0 | 122 | 0 |
| Mode M9 | |||
|---|---|---|---|
| Quadrant | BADHDUFLAG | Total packets | Discarded packets |
| A | 0 | 23 | 0 |
| B | 0 | 23 | 0 |
| C | 0 | 23 | 0 |
| D | 0 | 24 | 0 |
| Quadrant | Total seconds | Saturated seconds | Saturation percentage |
|---|---|---|---|
| A | 5957 | 7 | 0.117509% |
| B | 5957 | 273 | 4.582844% |
| C | 5957 | 50 | 0.839349% |
| D | 5957 | 94 | 1.577975% |
Noise dominated data is calculated using 1-second bins in cleaned event files. If a bin has >2000 counts, and if more than 50% of those come from <1% of pixels, then it is considered to be noise-dominated and hence unusable.
| Quadrant | # 1 sec bins | Bins with >0 counts | Bins with >2000 counts | High rate bins dominated by noise | Noise dominated (total time) | Noise dominated (detector-on time) | Marked lightcurve |
|---|---|---|---|---|---|---|---|
| A | 7269 | 5958 | 3 | 3 | 0.04% | 0.05% | 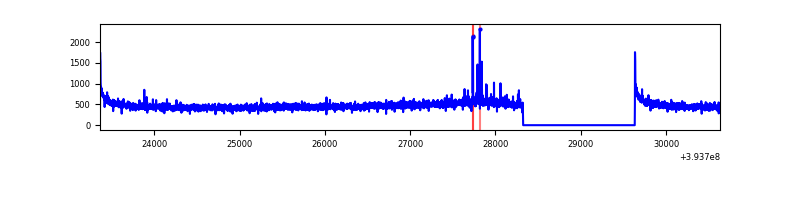 |
| B | 7269 | 5958 | 175 | 175 | 2.41% | 2.94% | 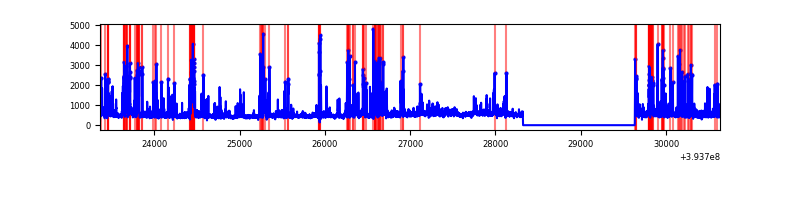 |
| C | 7269 | 5958 | 35 | 35 | 0.48% | 0.59% | 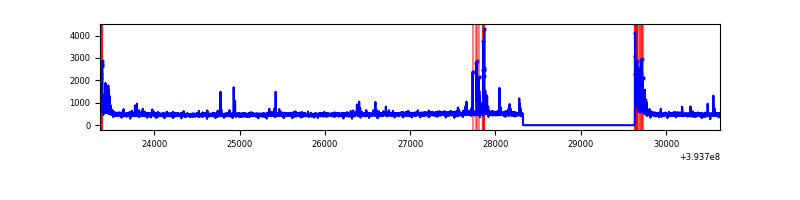 |
| D | 7269 | 5958 | 84 | 84 | 1.16% | 1.41% | 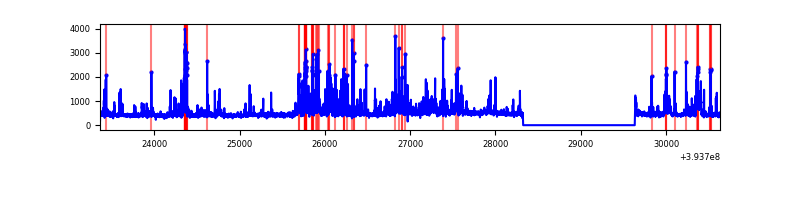 |
Top three noisy pixels from each quadrant. If the there are fewer than three noisy pixels in the level2.evt file, extra rows are filled as -1
| Pixel properties | Quadrant properties | ||||||
|---|---|---|---|---|---|---|---|
| Quadrant | DetID | PixID | Counts | Sigma | Mean | Median | Sigma |
| A | 10 | 83 | 195864 | 1444.26 | 670 | 656 | 135.2 |
| A | 9 | 143 | 23027 | 165.51 | 670 | 656 | 135.2 |
| A | 13 | 6 | 12343 | 86.47 | 670 | 656 | 135.2 |
| B | 5 | 172 | 575966 | 4599.15 | 652 | 634 | 125.1 |
| B | 5 | 255 | 520041 | 4152.09 | 652 | 634 | 125.1 |
| B | 0 | 189 | 133036 | 1058.41 | 652 | 634 | 125.1 |
| C | 15 | 214 | 256272 | 1686.66 | 653 | 657 | 151.6 |
| C | 0 | 10 | 199354 | 1311.09 | 653 | 657 | 151.6 |
| C | 12 | 249 | 88496 | 579.6 | 653 | 657 | 151.6 |
| D | 2 | 249 | 339996 | 2153.83 | 653 | 636 | 157.6 |
| D | 2 | 250 | 131475 | 830.4 | 653 | 636 | 157.6 |
| D | 12 | 6 | 110203 | 695.39 | 653 | 636 | 157.6 |
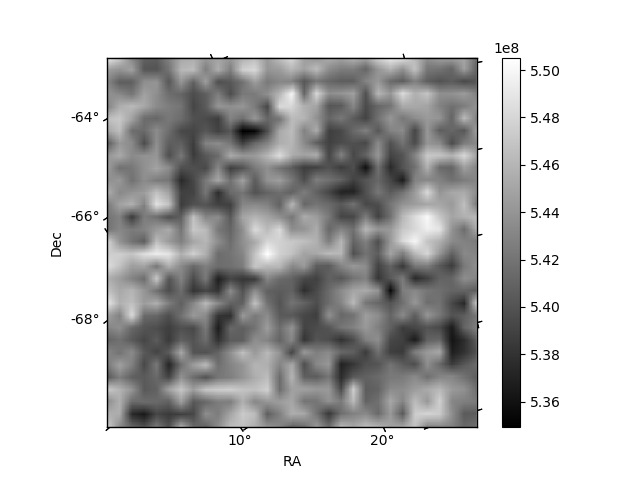
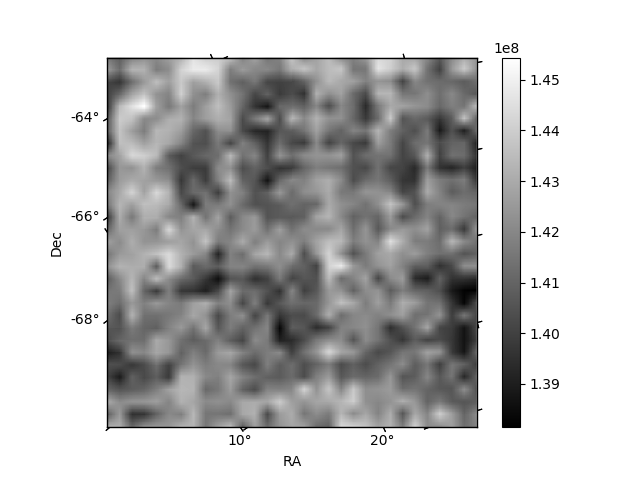
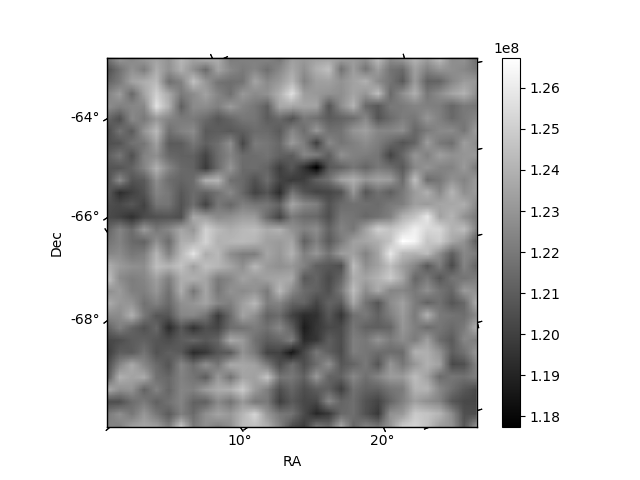
Histogram calculated using DETX and DETY for each event in the final _common_clean file
| Quadrant A | 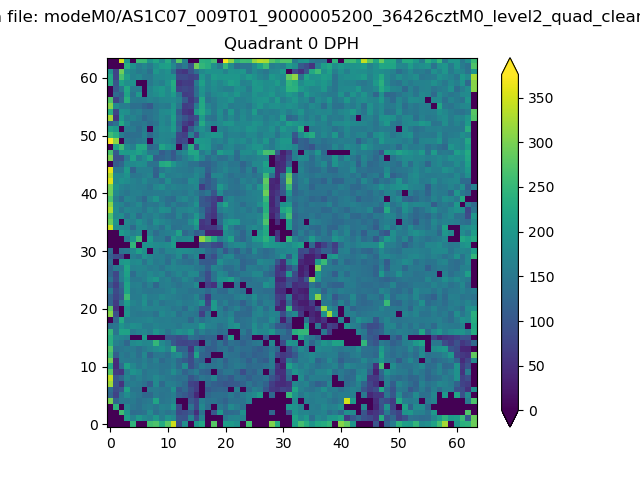 |
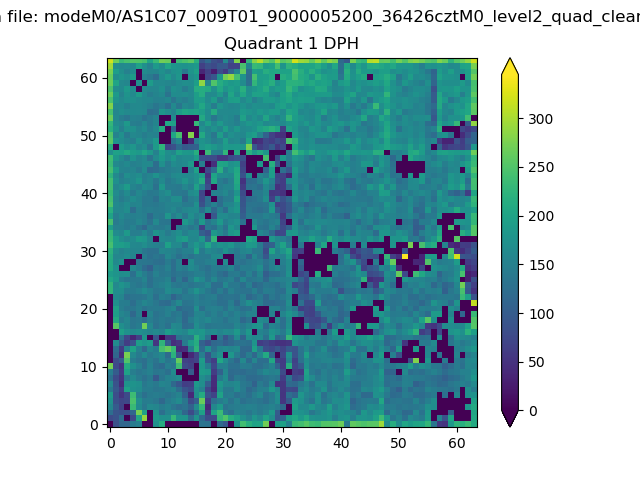 |
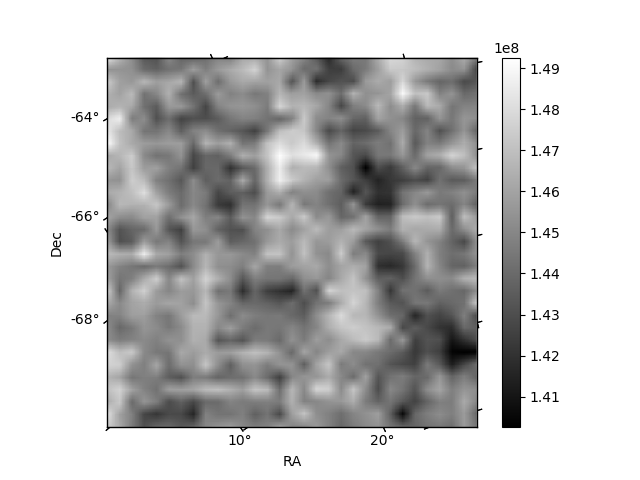
Quadrant B |
|---|---|---|---|
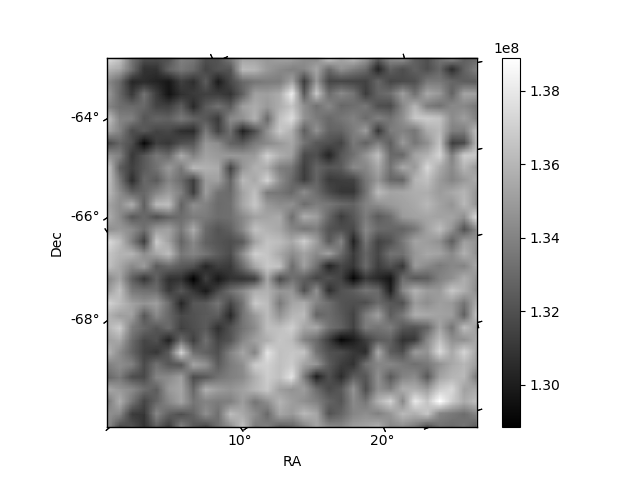
| Quadrant D | 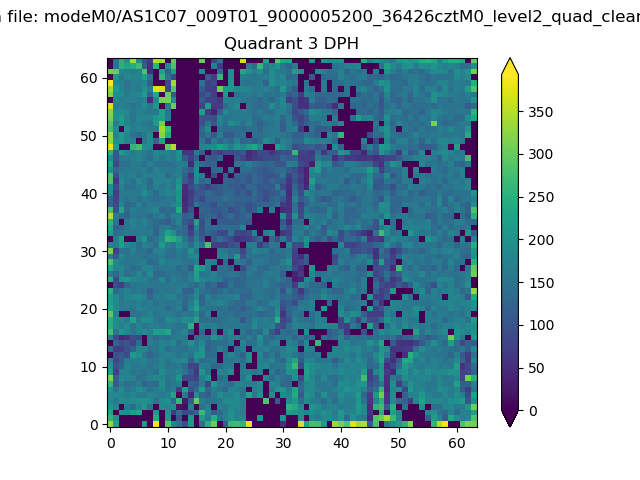 |
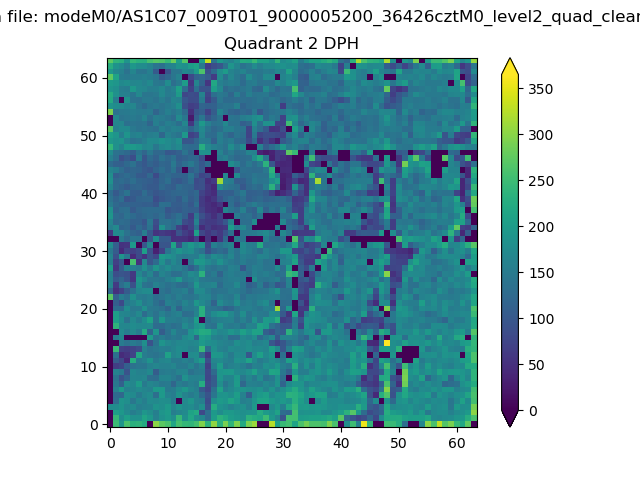 |
Quadrant C |
| Plot type | Count rate plots | Images |
|---|---|---|
| Comparison with Poisson distribution Blue bars denote a histogram of data divided into 1 sec bins. Red curve is a Poisson curve with rate = median count rate of data. |
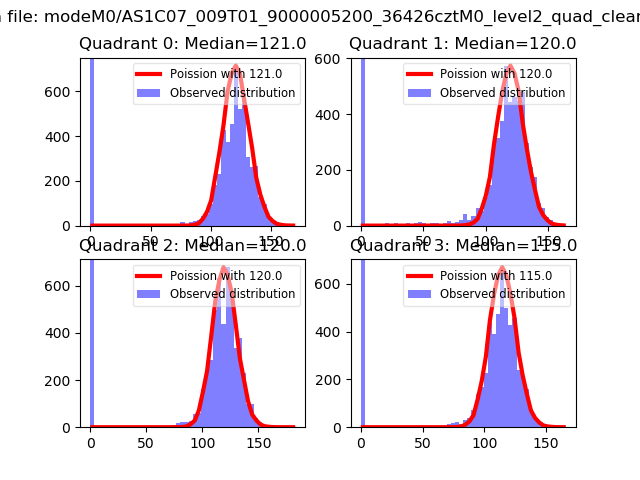 |
 |
| Quadrant-wise count rates Data is divided into 100 sec bins |
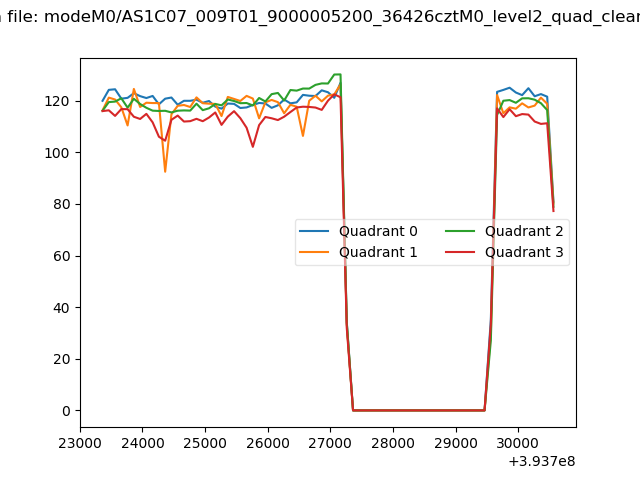 |
|
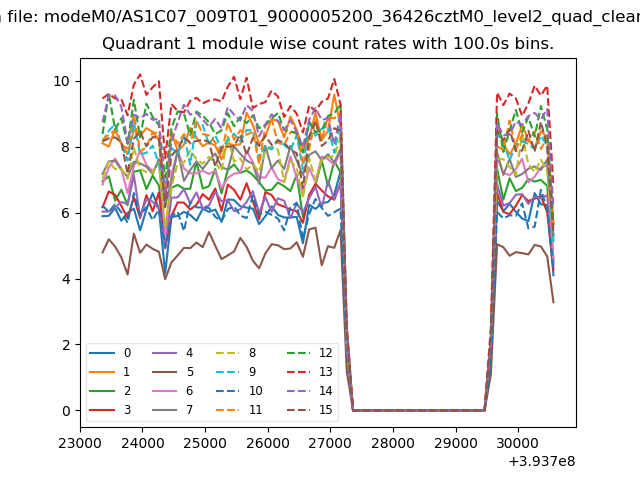
| Module-wise count rates for Quadrant A Data is divided into 100 sec bins |
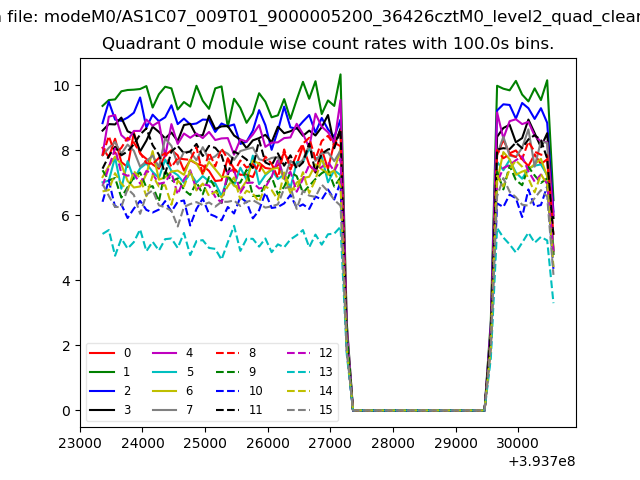 |
 |
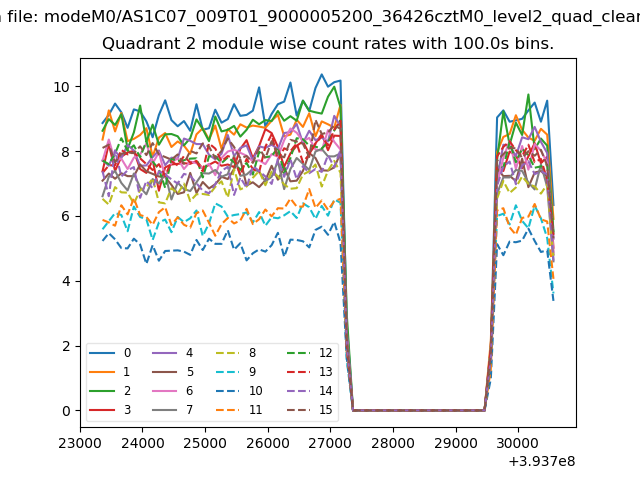
| Module-wise count rates for Quadrant B Data is divided into 100 sec bins |
 |
 |
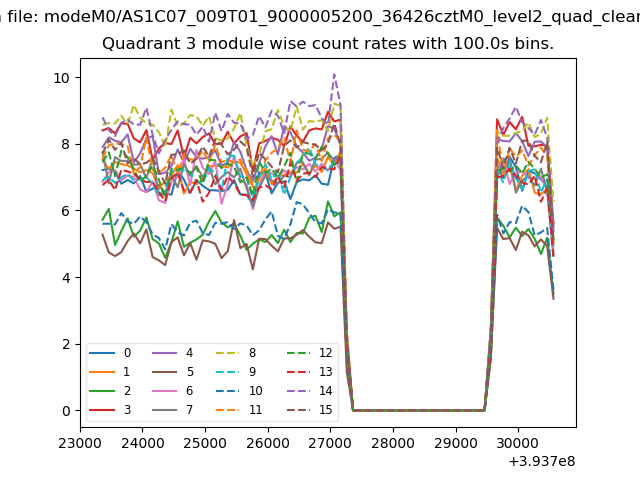
| Module-wise count rates for Quadrant C Data is divided into 100 sec bins |
 |
 |
| Module-wise count rates for Quadrant D Data is divided into 100 sec bins |
 |
 |
| Parameter | Plot |
|---|---|
| CZT HV Monitor | 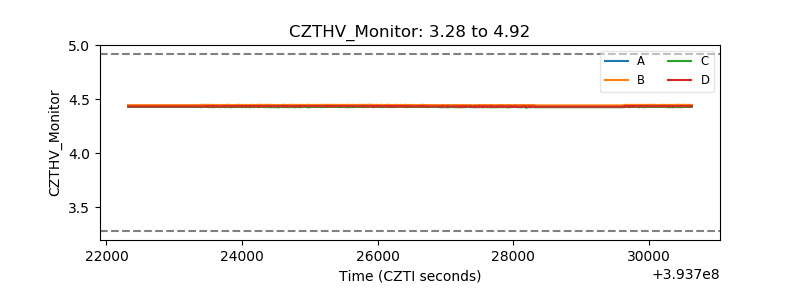 |
| D_VDD | 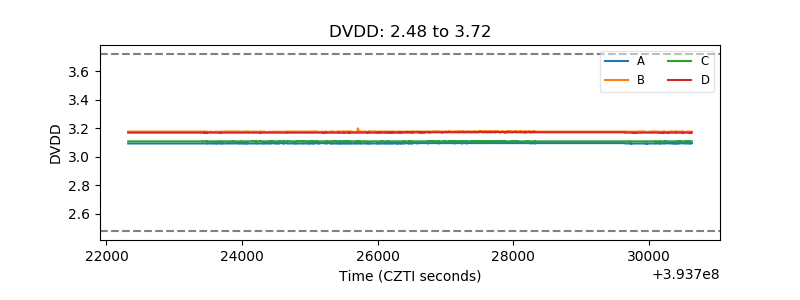 |
| Temperature 1 | 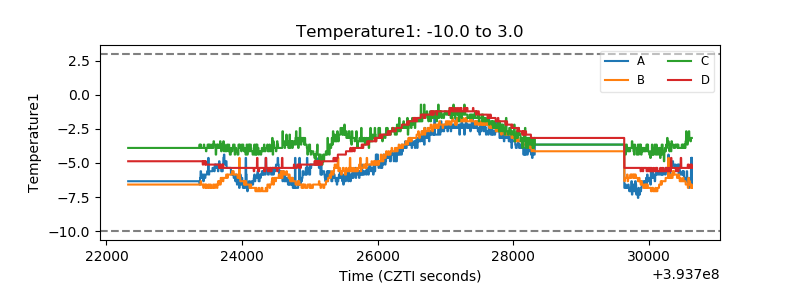 |
| Veto HV Monitor | 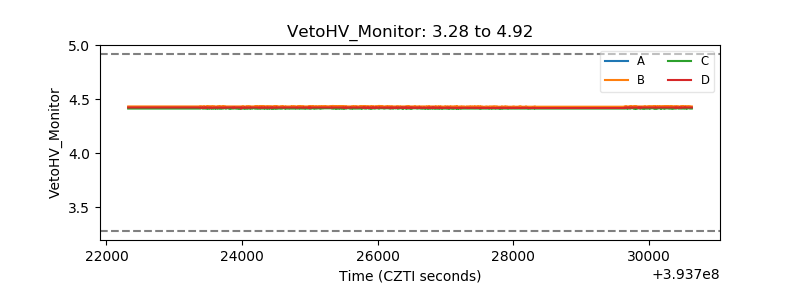 |
| Veto LLD | 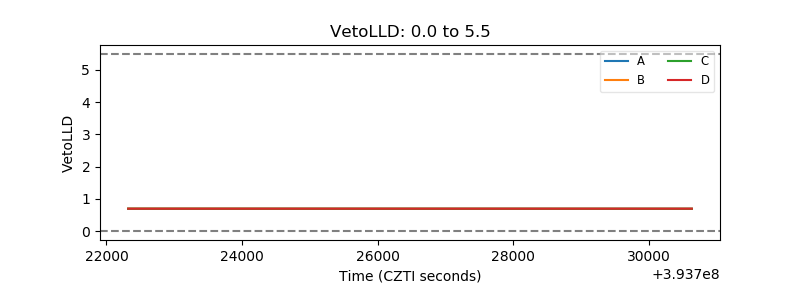 |
| Alpha Counter | 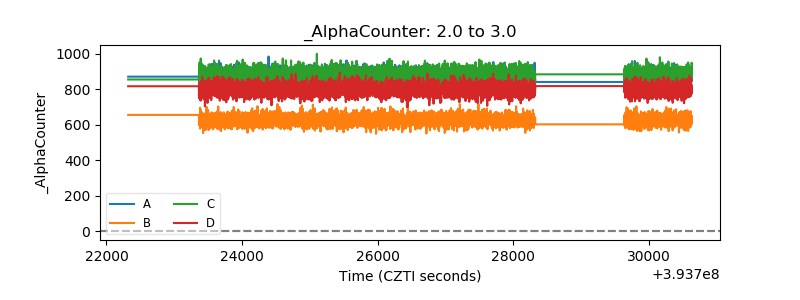 |
| _CPM_Rate | 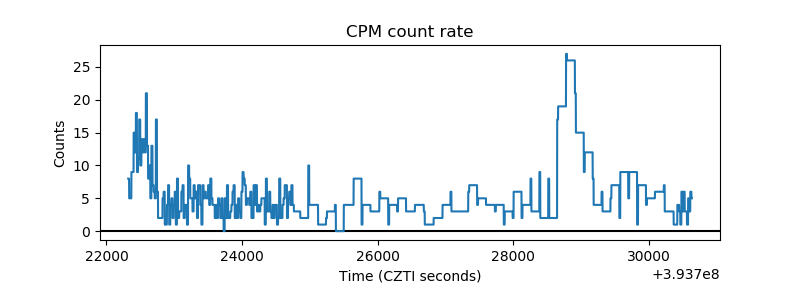 |
| CZT Counter | 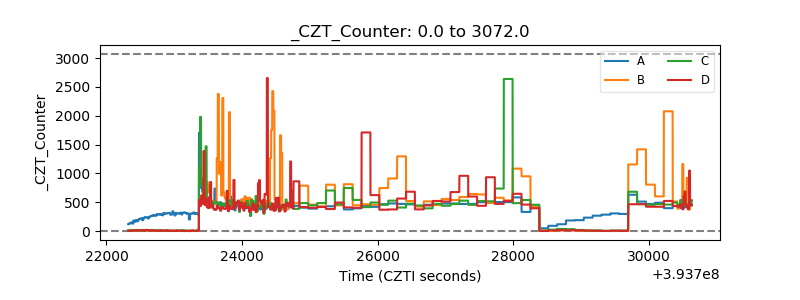 |
| +2.5 Volts monitor | 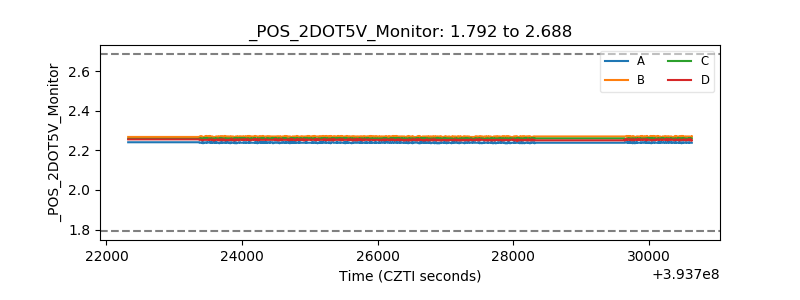 |
| +5 Volts monitor | 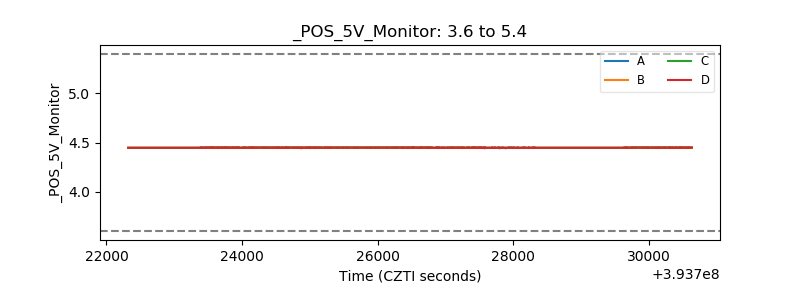 |
| _ROLL_ROT | 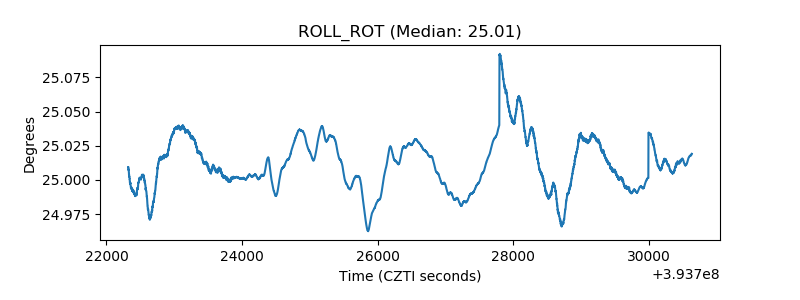 |
| _Roll_DEC | 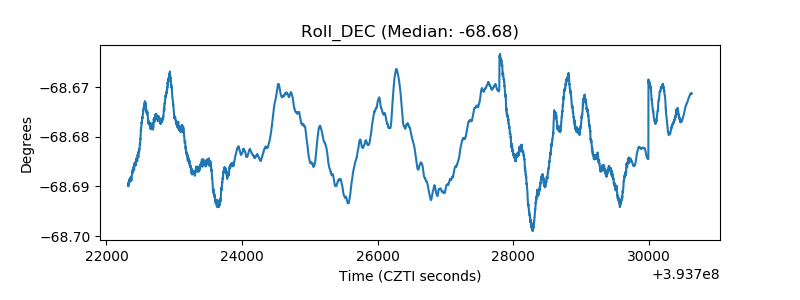 |
| _Roll_RA | 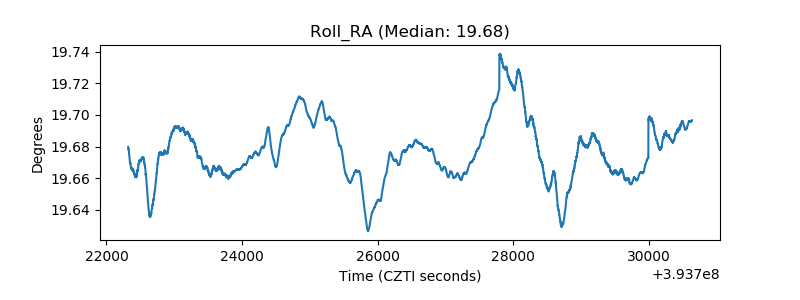 |
| Veto Counter | 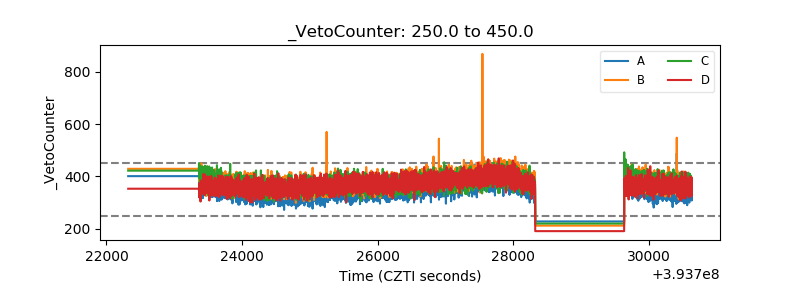 |