| Param | Original file | Final file |
|---|---|---|
| Filename | modeM0/AS1C07_009T01_9000005200_36425cztM0_level2.evt | modeM0/AS1C07_009T01_9000005200_36425cztM0_level2_quad_clean.evt |
| Size (bytes) | 454,121,280 | 99,083,520 |
| Size | 433.1 MB | 94.5 MB |
| Events in quadrant A | 2,811,746 | 663,460 |
| Events in quadrant B | 4,061,885 | 645,607 |
| Events in quadrant C | 3,067,174 | 651,404 |
| Events in quadrant D | 3,408,075 | 624,412 |
| Mode M0 | |||
|---|---|---|---|
| Quadrant | BADHDUFLAG | Total packets | Discarded packets |
| A | 0 | 12231 | 3 |
| B | 0 | 16098 | 2 |
| C | 0 | 12659 | 2 |
| D | 0 | 14291 | 2 |
| Mode SS | |||
|---|---|---|---|
| Quadrant | BADHDUFLAG | Total packets | Discarded packets |
| A | 0 | 124 | 0 |
| B | 0 | 124 | 0 |
| C | 0 | 124 | 0 |
| D | 0 | 124 | 0 |
| Mode M9 | |||
|---|---|---|---|
| Quadrant | BADHDUFLAG | Total packets | Discarded packets |
| A | 0 | 28 | 0 |
| B | 0 | 28 | 0 |
| C | 0 | 28 | 0 |
| D | 0 | 28 | 0 |
| Quadrant | Total seconds | Saturated seconds | Saturation percentage |
|---|---|---|---|
| A | 5949 | 7 | 0.117667% |
| B | 5949 | 317 | 5.328627% |
| C | 5949 | 58 | 0.974954% |
| D | 5949 | 110 | 1.849050% |
Noise dominated data is calculated using 1-second bins in cleaned event files. If a bin has >2000 counts, and if more than 50% of those come from <1% of pixels, then it is considered to be noise-dominated and hence unusable.
| Quadrant | # 1 sec bins | Bins with >0 counts | Bins with >2000 counts | High rate bins dominated by noise | Noise dominated (total time) | Noise dominated (detector-on time) | Marked lightcurve |
|---|---|---|---|---|---|---|---|
| A | 8844 | 5951 | 0 | 0 | 0.00% | 0.00% | 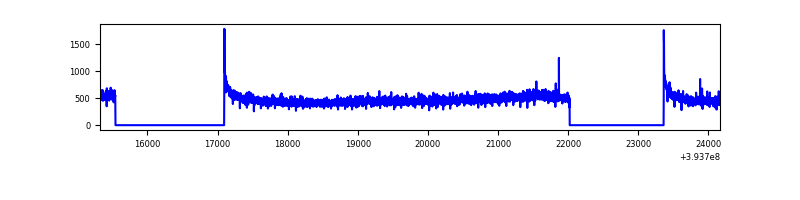 |
| B | 8844 | 5951 | 208 | 208 | 2.35% | 3.50% | 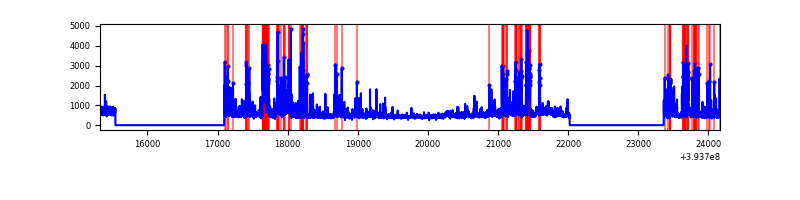 |
| C | 8844 | 5951 | 36 | 36 | 0.41% | 0.60% | 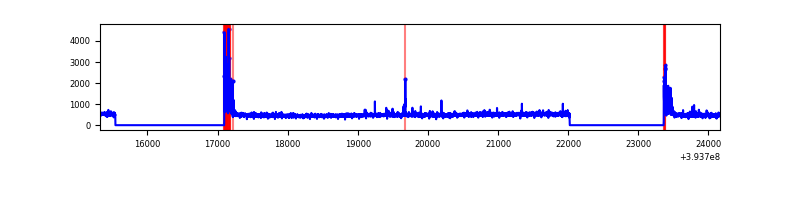 |
| D | 8844 | 5951 | 73 | 73 | 0.83% | 1.23% | 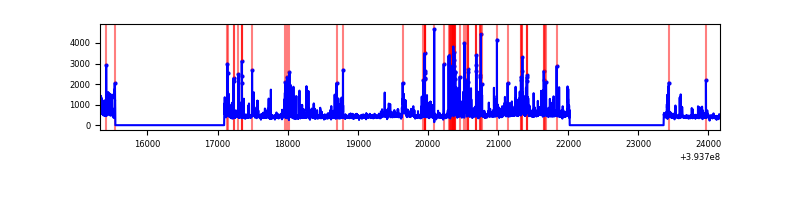 |
Top three noisy pixels from each quadrant. If the there are fewer than three noisy pixels in the level2.evt file, extra rows are filled as -1
| Pixel properties | Quadrant properties | ||||||
|---|---|---|---|---|---|---|---|
| Quadrant | DetID | PixID | Counts | Sigma | Mean | Median | Sigma |
| A | 10 | 83 | 195394 | 1434.95 | 672 | 658 | 135.7 |
| A | 13 | 254 | 10970 | 75.99 | 672 | 658 | 135.7 |
| A | 13 | 6 | 10452 | 72.17 | 672 | 658 | 135.7 |
| B | 5 | 172 | 593105 | 4728.27 | 652 | 633 | 125.3 |
| B | 5 | 255 | 364127 | 2900.89 | 652 | 633 | 125.3 |
| B | 0 | 189 | 195943 | 1558.69 | 652 | 633 | 125.3 |
| C | 15 | 214 | 253970 | 1669.93 | 652 | 656 | 151.7 |
| C | 0 | 10 | 232619 | 1529.18 | 652 | 656 | 151.7 |
| C | 4 | 254 | 19689 | 125.47 | 652 | 656 | 151.7 |
| D | 12 | 6 | 184909 | 1166.67 | 652 | 633 | 158.0 |
| D | 2 | 250 | 120821 | 760.92 | 652 | 633 | 158.0 |
| D | 12 | 233 | 115260 | 725.71 | 652 | 633 | 158.0 |
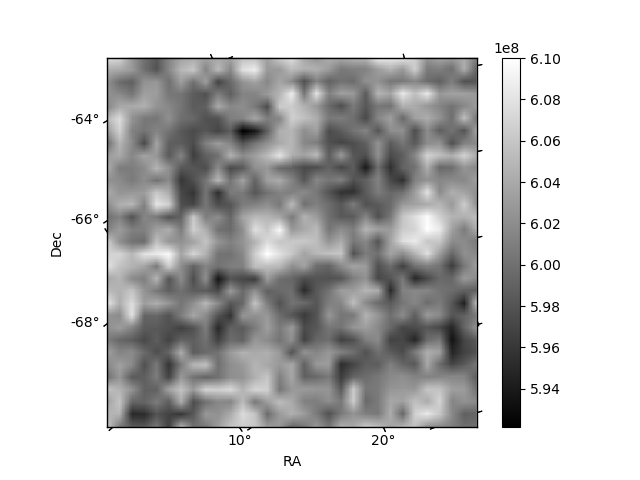
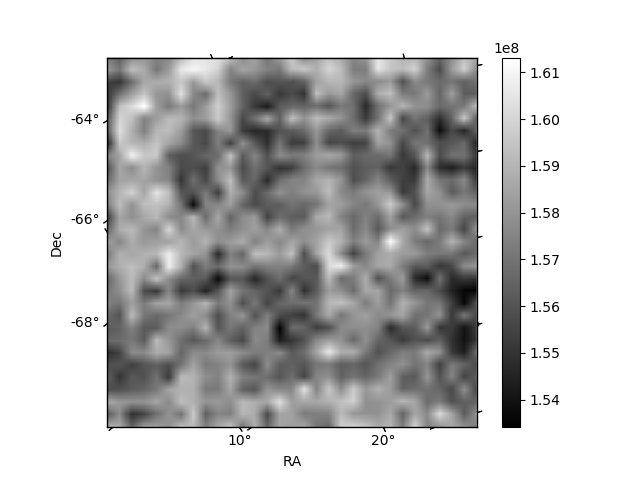
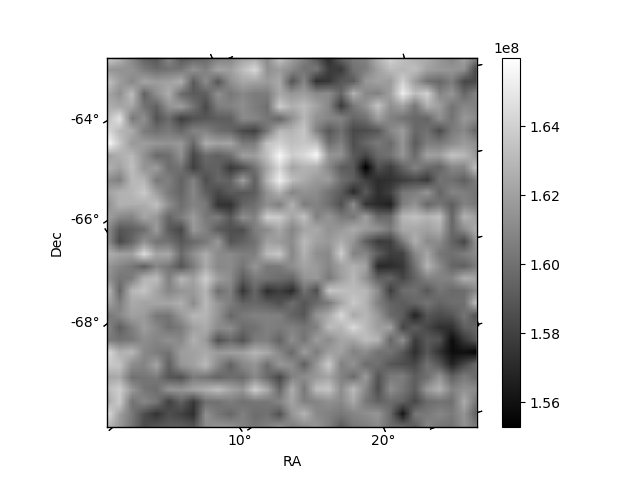
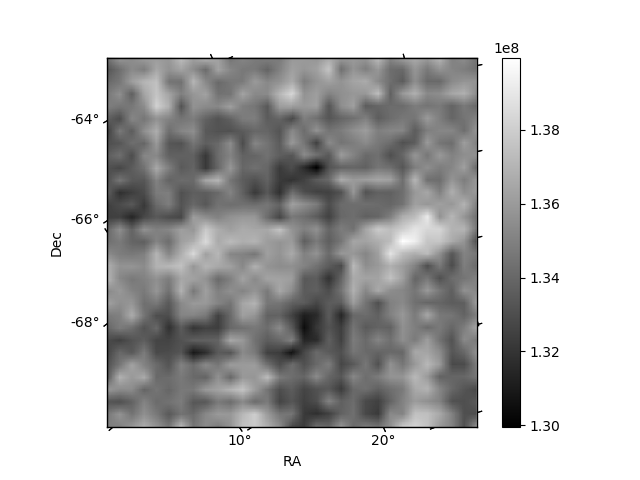
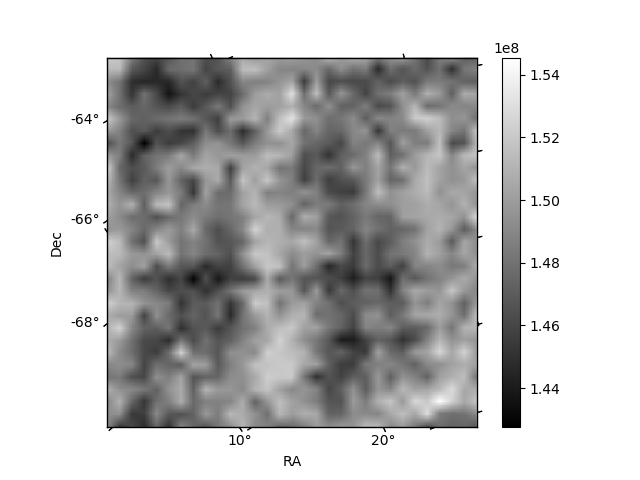
Histogram calculated using DETX and DETY for each event in the final _common_clean file
| Quadrant A | 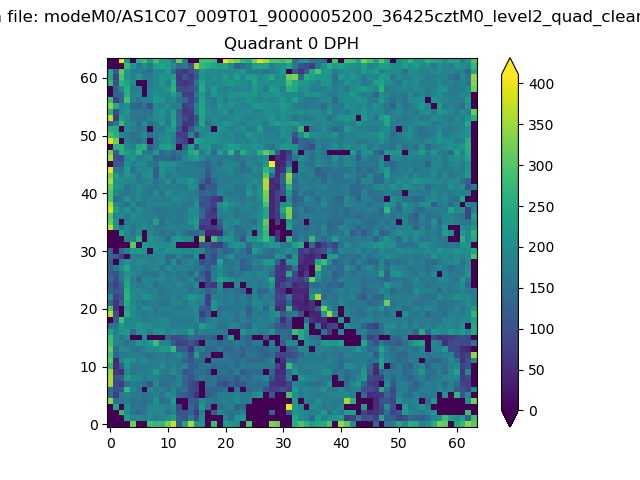 |
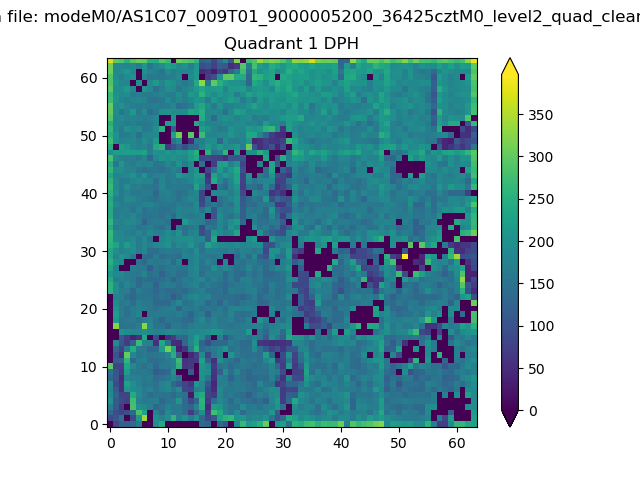 |
Quadrant B |
|---|---|---|---|
| Quadrant D | 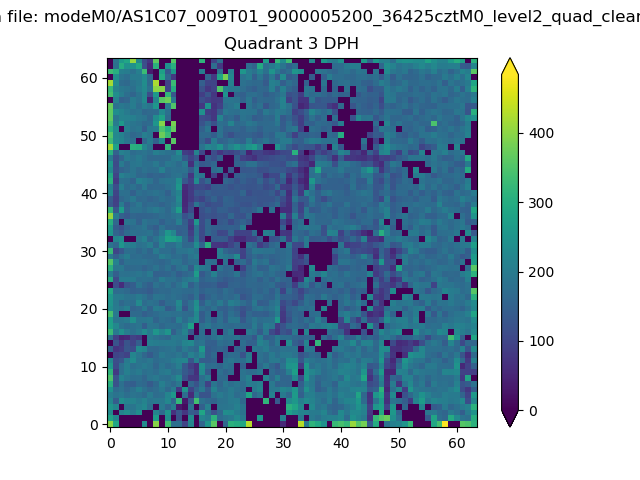 |
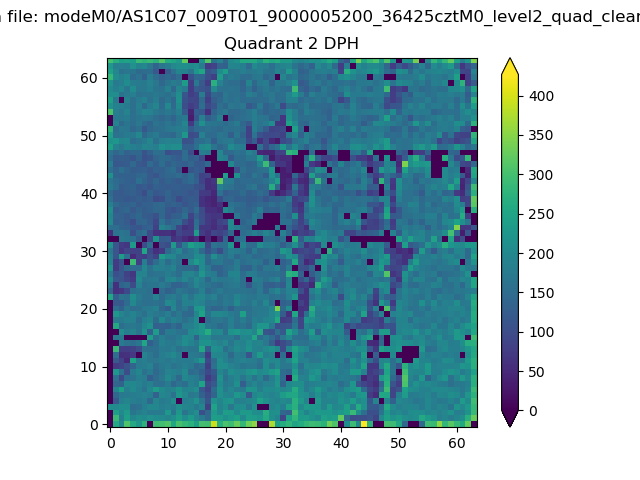 |
Quadrant C |
| Plot type | Count rate plots | Images |
|---|---|---|
| Comparison with Poisson distribution Blue bars denote a histogram of data divided into 1 sec bins. Red curve is a Poisson curve with rate = median count rate of data. |
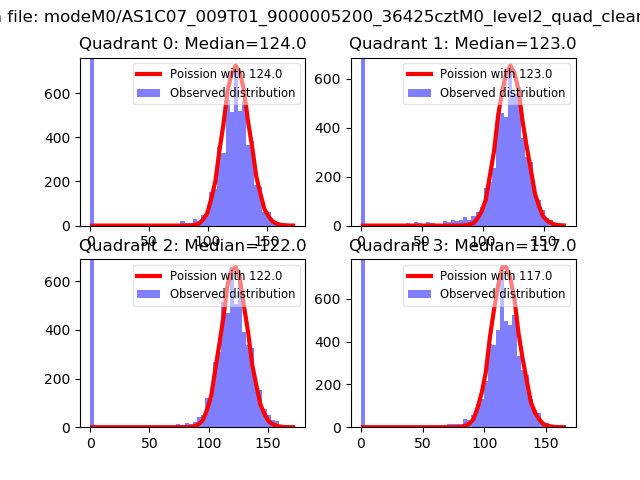 |
 |
| Quadrant-wise count rates Data is divided into 100 sec bins |
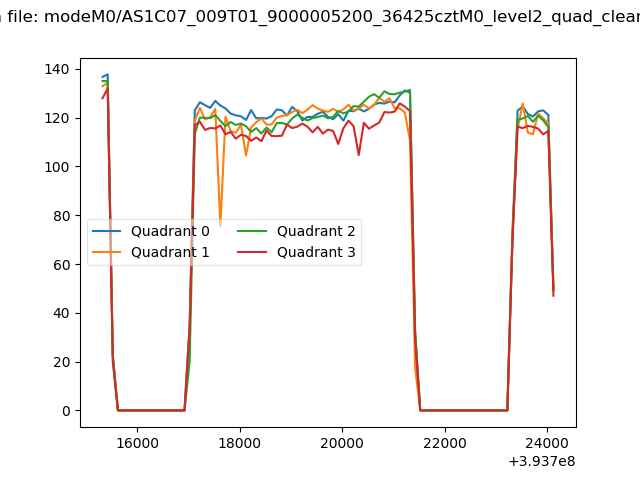 |
|
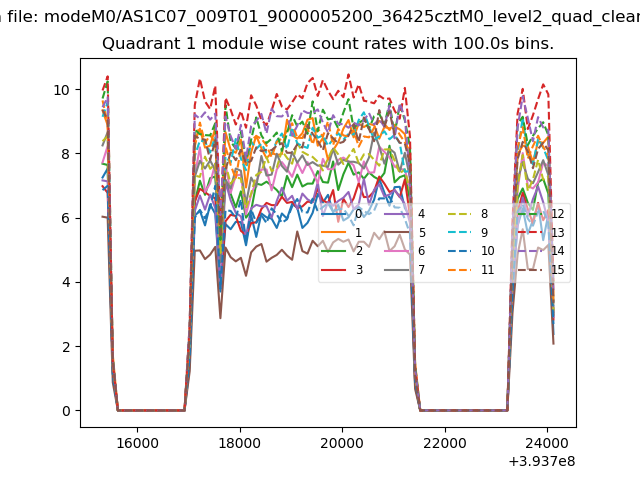
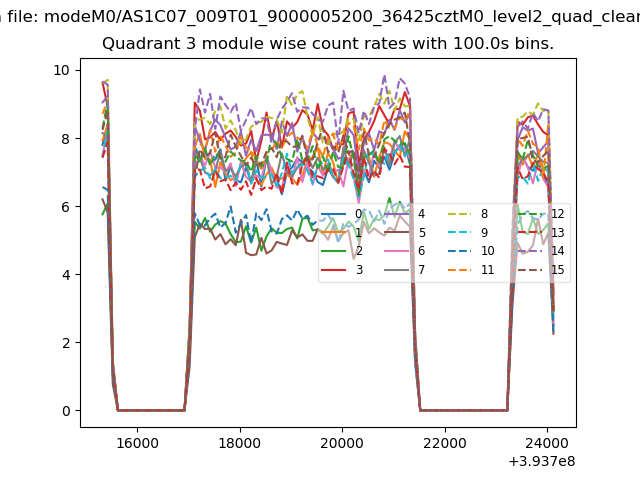
| Module-wise count rates for Quadrant A Data is divided into 100 sec bins |
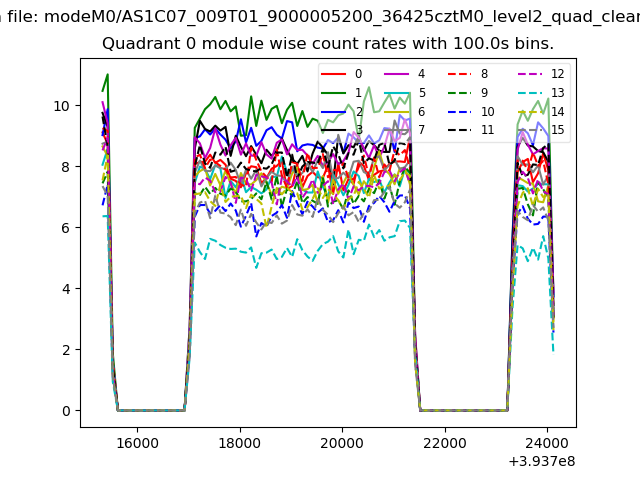 |
 |
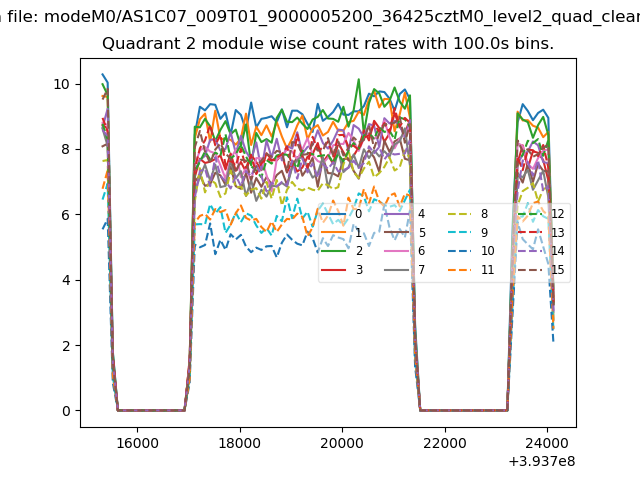
| Module-wise count rates for Quadrant B Data is divided into 100 sec bins |
 |
 |
| Module-wise count rates for Quadrant C Data is divided into 100 sec bins |
 |
 |
| Module-wise count rates for Quadrant D Data is divided into 100 sec bins |
 |
 |
| Parameter | Plot |
|---|---|
| CZT HV Monitor | 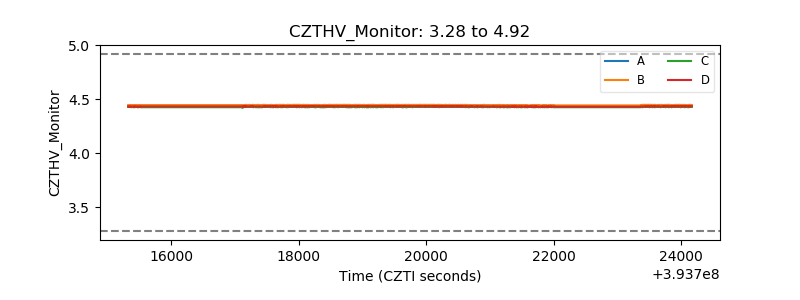 |
| D_VDD | 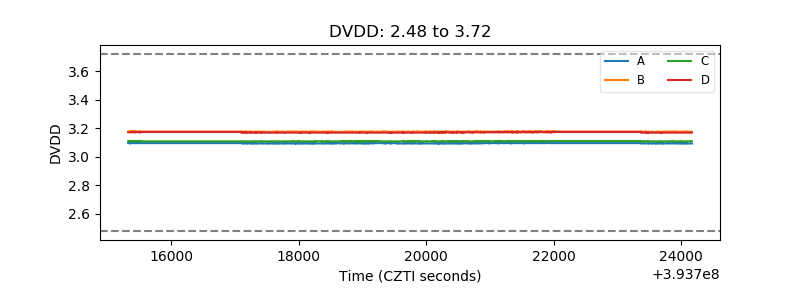 |
| Temperature 1 | 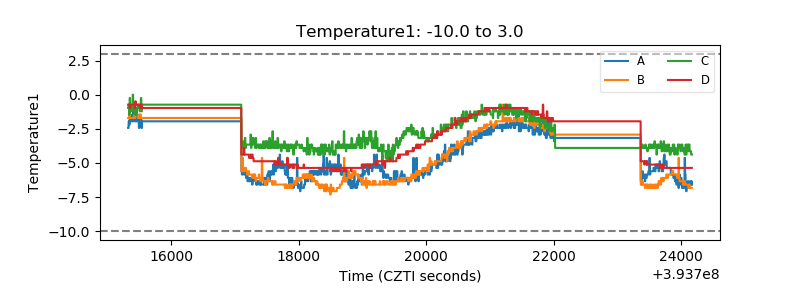 |
| Veto HV Monitor | 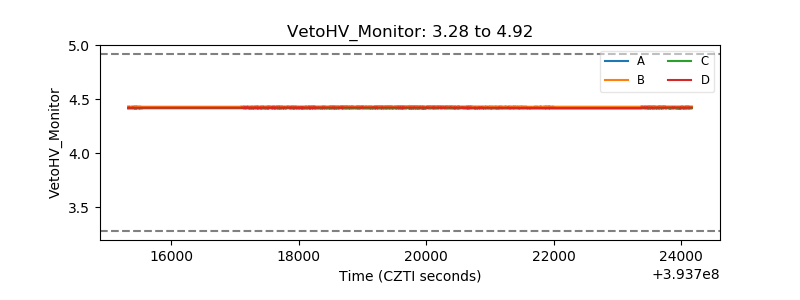 |
| Veto LLD | 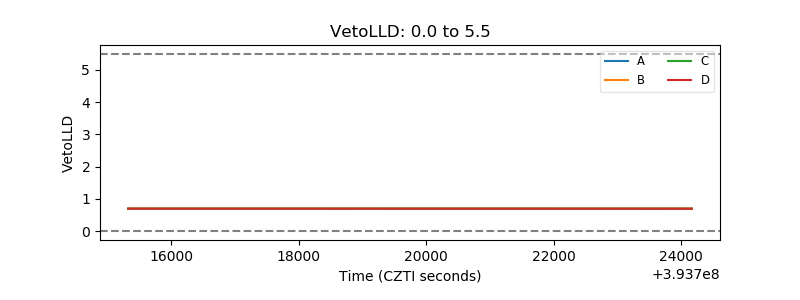 |
| Alpha Counter | 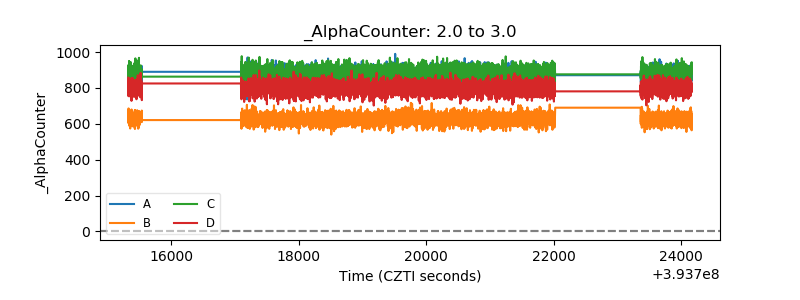 |
| _CPM_Rate | 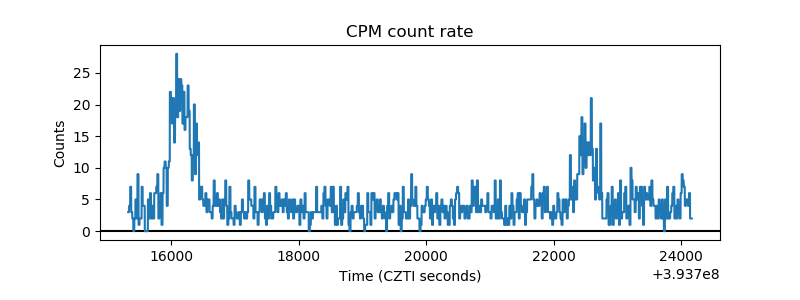 |
| CZT Counter | 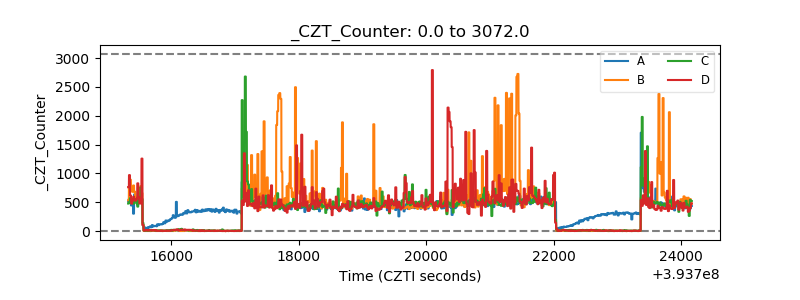 |
| +2.5 Volts monitor | 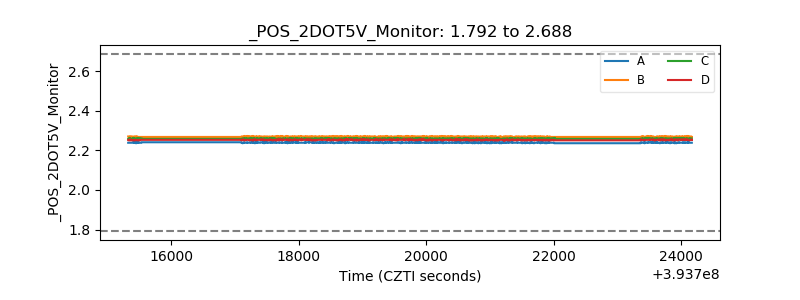 |
| +5 Volts monitor | 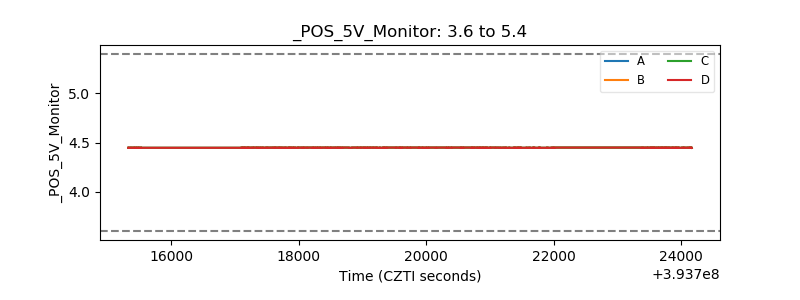 |
| _ROLL_ROT | 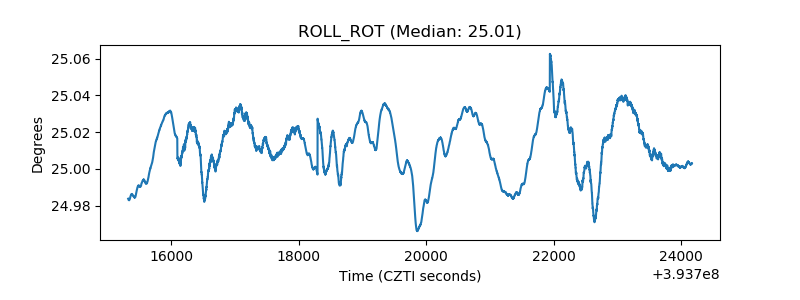 |
| _Roll_DEC | 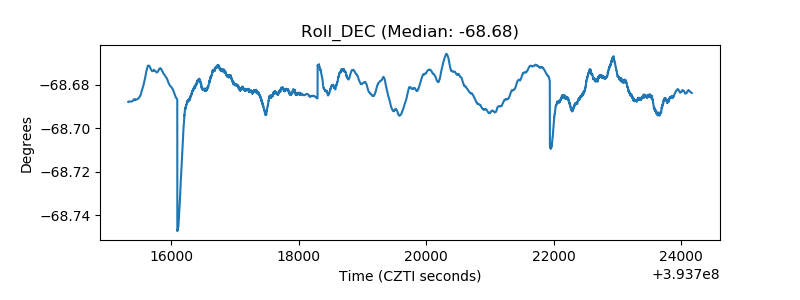 |
| _Roll_RA | 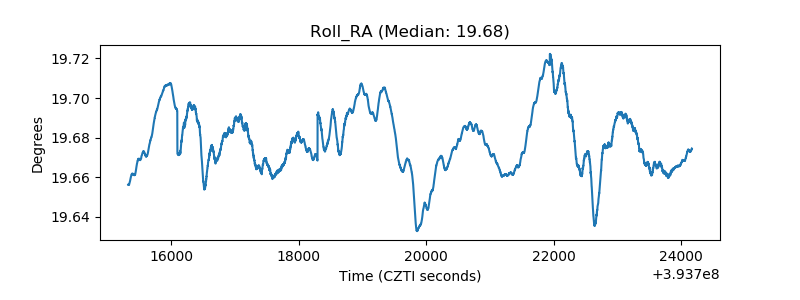 |
| Veto Counter | 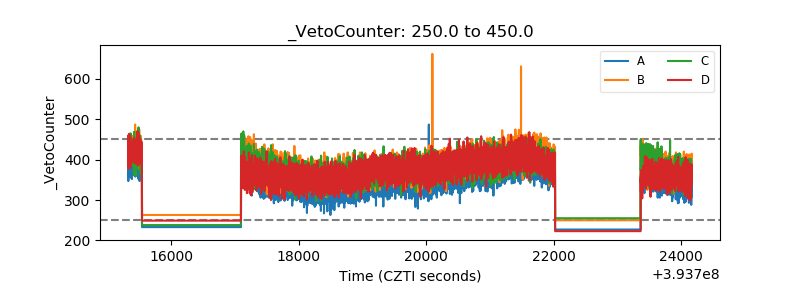 |