| Param | Original file | Final file |
|---|---|---|
| Filename | modeM0/AS1T04_084T01_9000005198_36417cztM0_level2.evt | modeM0/AS1T04_084T01_9000005198_36417cztM0_level2_quad_clean.evt |
| Size (bytes) | 437,584,320 | 62,570,880 |
| Size | 417.3 MB | 59.7 MB |
| Events in quadrant A | 2,686,169 | 388,077 |
| Events in quadrant B | 3,821,123 | 382,514 |
| Events in quadrant C | 2,911,258 | 380,769 |
| Events in quadrant D | 3,463,904 | 362,034 |
| Mode M0 | |||
|---|---|---|---|
| Quadrant | BADHDUFLAG | Total packets | Discarded packets |
| A | 0 | 11179 | 2 |
| B | 0 | 14856 | 1 |
| C | 0 | 11740 | 1 |
| D | 0 | 13915 | 1 |
| Mode SS | |||
|---|---|---|---|
| Quadrant | BADHDUFLAG | Total packets | Discarded packets |
| A | 0 | 112 | 0 |
| B | 0 | 112 | 0 |
| C | 0 | 112 | 0 |
| D | 0 | 112 | 0 |
| Mode M9 | |||
|---|---|---|---|
| Quadrant | BADHDUFLAG | Total packets | Discarded packets |
| A | 0 | 17 | 0 |
| B | 0 | 17 | 0 |
| C | 0 | 17 | 0 |
| D | 0 | 17 | 0 |
| Quadrant | Total seconds | Saturated seconds | Saturation percentage |
|---|---|---|---|
| A | 5440 | 5 | 0.091912% |
| B | 5440 | 264 | 4.852941% |
| C | 5440 | 59 | 1.084559% |
| D | 5440 | 162 | 2.977941% |
Noise dominated data is calculated using 1-second bins in cleaned event files. If a bin has >2000 counts, and if more than 50% of those come from <1% of pixels, then it is considered to be noise-dominated and hence unusable.
| Quadrant | # 1 sec bins | Bins with >0 counts | Bins with >2000 counts | High rate bins dominated by noise | Noise dominated (total time) | Noise dominated (detector-on time) | Marked lightcurve |
|---|---|---|---|---|---|---|---|
| A | 7173 | 5441 | 0 | 0 | 0.00% | 0.00% | 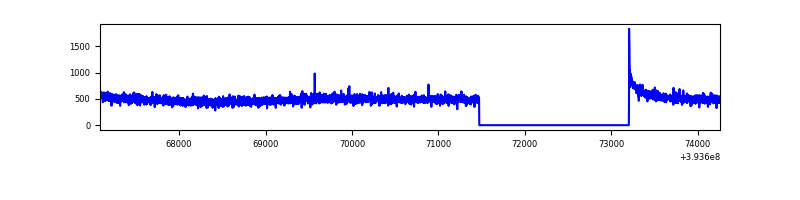 |
| B | 7173 | 5441 | 191 | 191 | 2.66% | 3.51% | 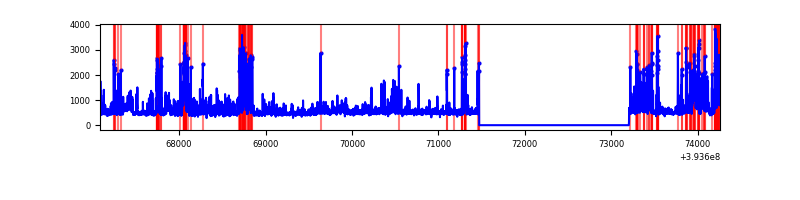 |
| C | 7173 | 5441 | 46 | 46 | 0.64% | 0.85% | 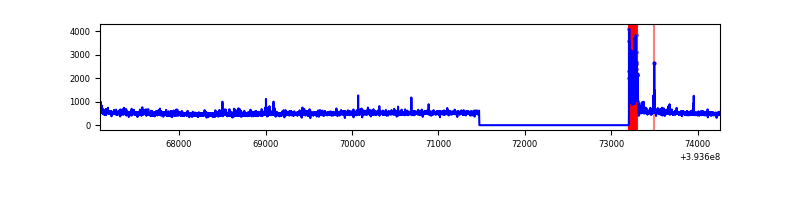 |
| D | 7173 | 5441 | 134 | 134 | 1.87% | 2.46% | 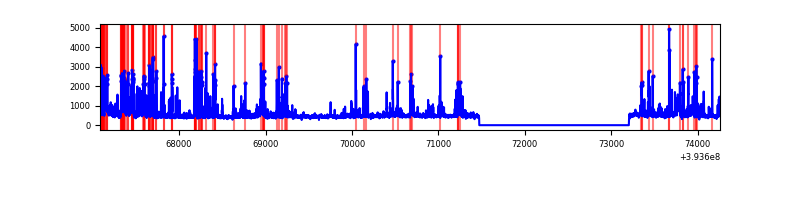 |
Top three noisy pixels from each quadrant. If the there are fewer than three noisy pixels in the level2.evt file, extra rows are filled as -1
| Pixel properties | Quadrant properties | ||||||
|---|---|---|---|---|---|---|---|
| Quadrant | DetID | PixID | Counts | Sigma | Mean | Median | Sigma |
| A | 10 | 83 | 155064 | 1184.32 | 645 | 635 | 130.4 |
| A | 15 | 223 | 34156 | 257.07 | 645 | 635 | 130.4 |
| A | 13 | 254 | 9365 | 66.95 | 645 | 635 | 130.4 |
| B | 5 | 172 | 455991 | 3736.58 | 623 | 606 | 121.9 |
| B | 5 | 236 | 233897 | 1914.23 | 623 | 606 | 121.9 |
| B | 4 | 232 | 233598 | 1911.78 | 623 | 606 | 121.9 |
| C | 0 | 10 | 272712 | 1893.37 | 617 | 620 | 143.7 |
| C | 15 | 214 | 231478 | 1606.44 | 617 | 620 | 143.7 |
| C | 13 | 61 | 4247 | 25.24 | 617 | 620 | 143.7 |
| D | 2 | 249 | 521904 | 3468.8 | 619 | 602 | 150.3 |
| D | 12 | 6 | 129097 | 855.02 | 619 | 602 | 150.3 |
| D | 13 | 171 | 109177 | 722.47 | 619 | 602 | 150.3 |
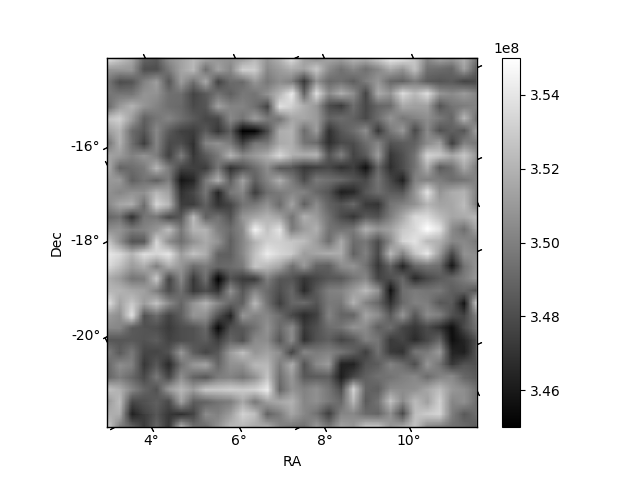
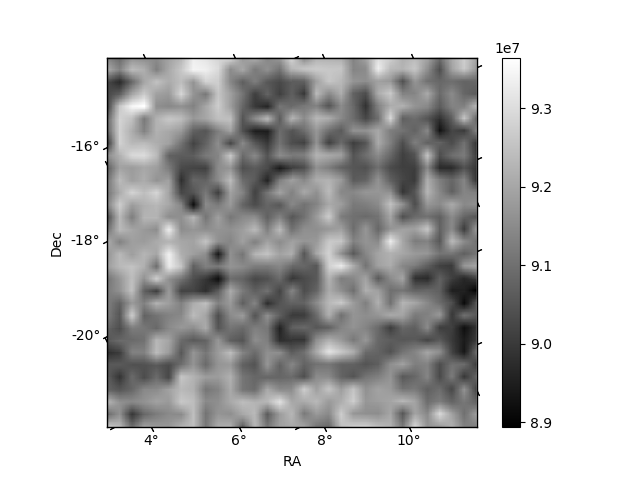
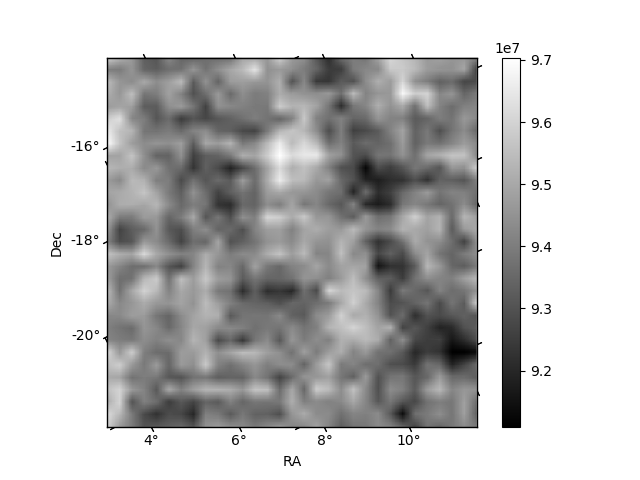
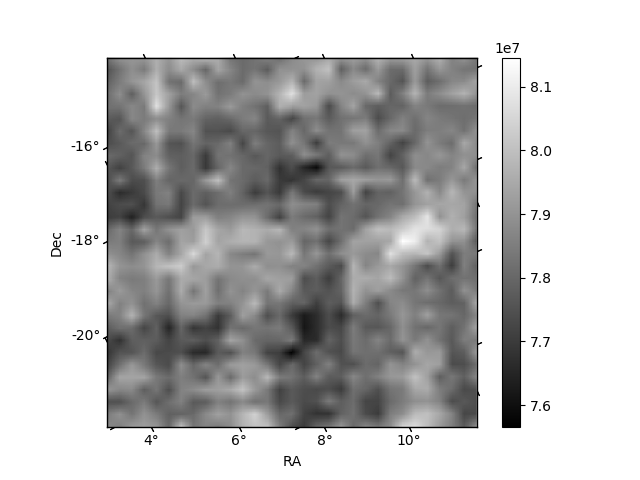
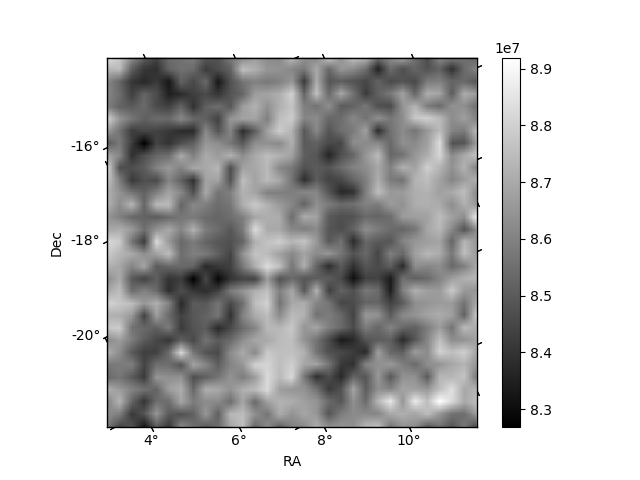
Histogram calculated using DETX and DETY for each event in the final _common_clean file
| Quadrant A | 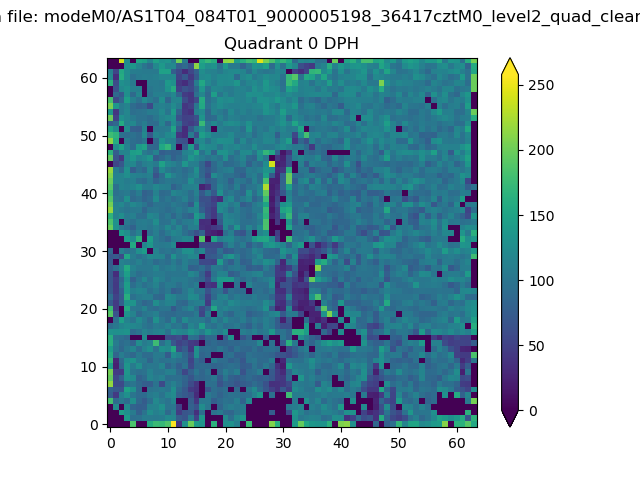 |
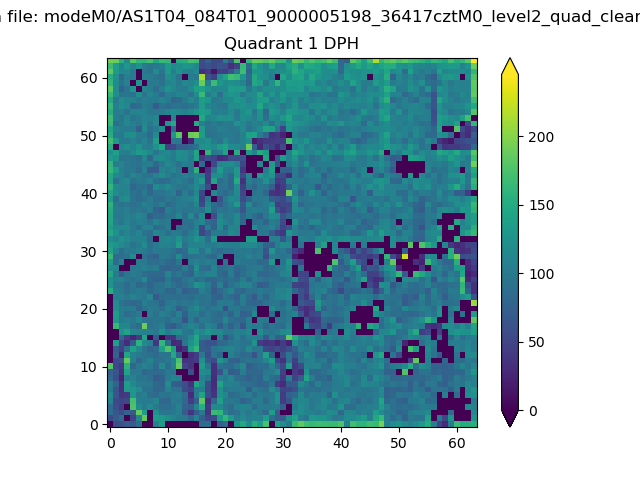 |
Quadrant B |
|---|---|---|---|
| Quadrant D | 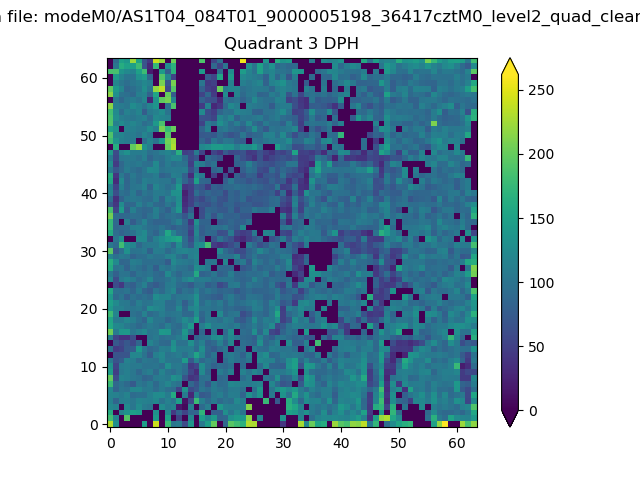 |
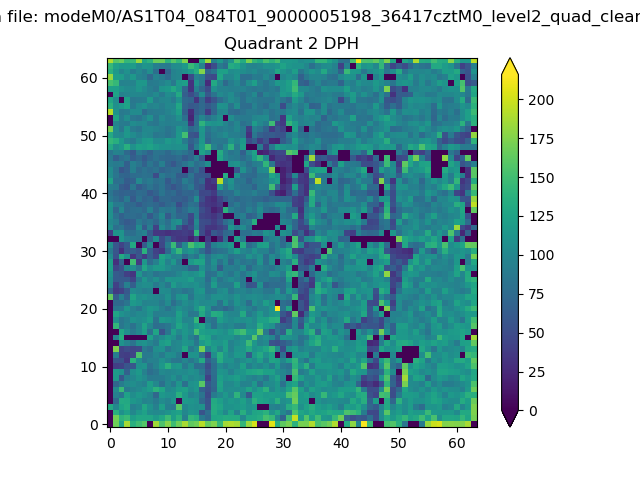 |
Quadrant C |
| Plot type | Count rate plots | Images |
|---|---|---|
| Comparison with Poisson distribution Blue bars denote a histogram of data divided into 1 sec bins. Red curve is a Poisson curve with rate = median count rate of data. |
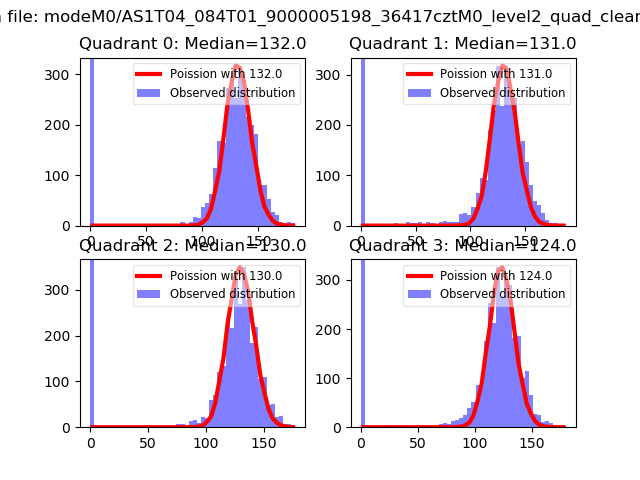 |
 |
| Quadrant-wise count rates Data is divided into 100 sec bins |
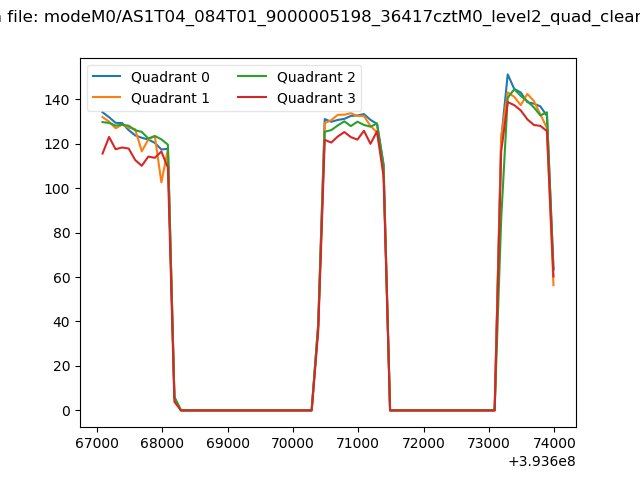 |
|
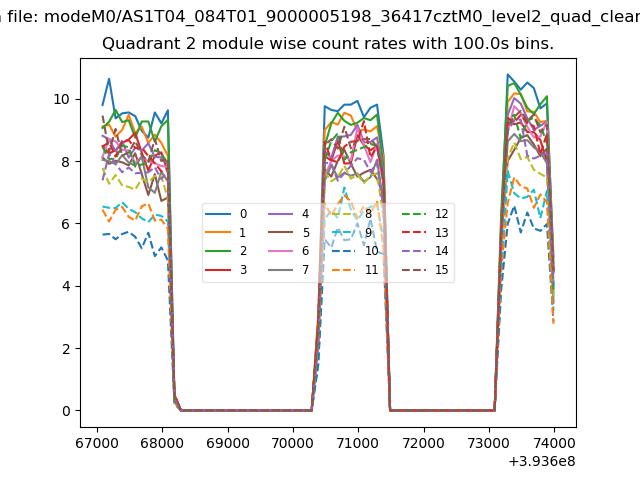
| Module-wise count rates for Quadrant A Data is divided into 100 sec bins |
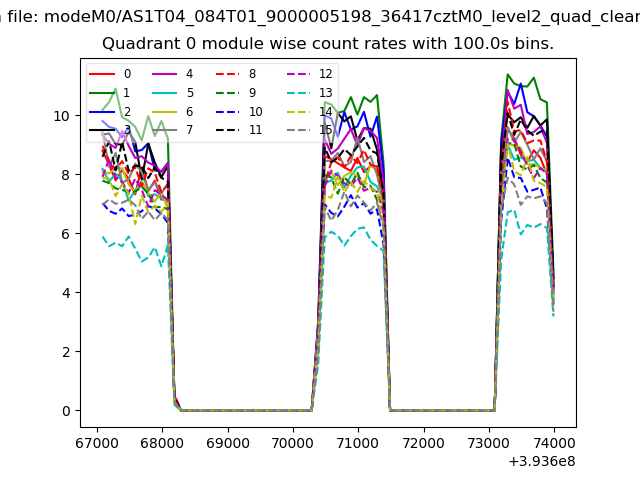 |
 |
| Module-wise count rates for Quadrant B Data is divided into 100 sec bins |
 |
 |
| Module-wise count rates for Quadrant C Data is divided into 100 sec bins |
 |
 |
| Module-wise count rates for Quadrant D Data is divided into 100 sec bins |
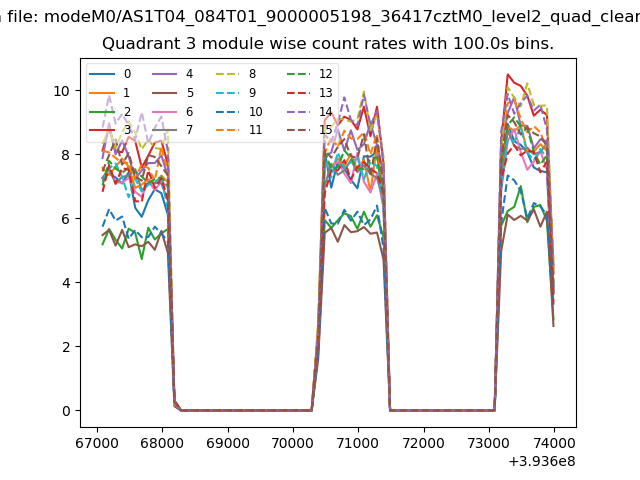 |
 |
| Parameter | Plot |
|---|---|
| CZT HV Monitor | 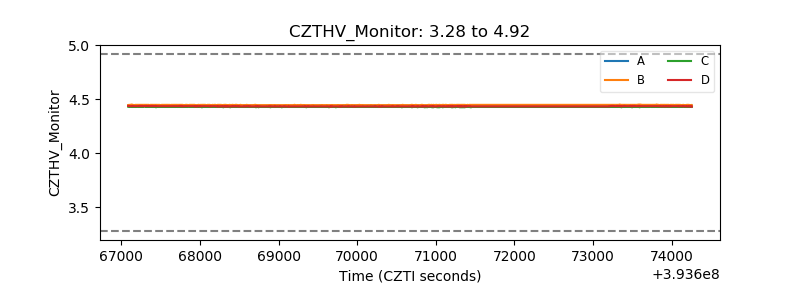 |
| D_VDD | 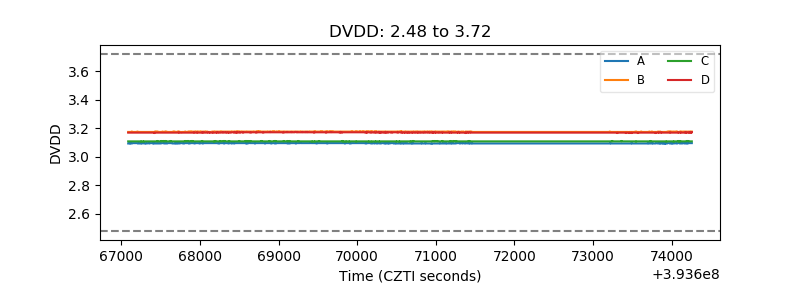 |
| Temperature 1 | 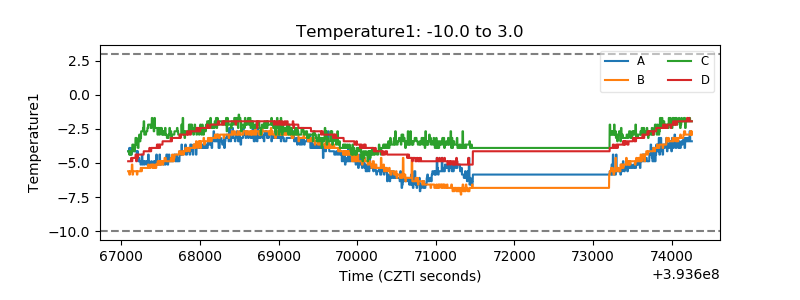 |
| Veto HV Monitor | 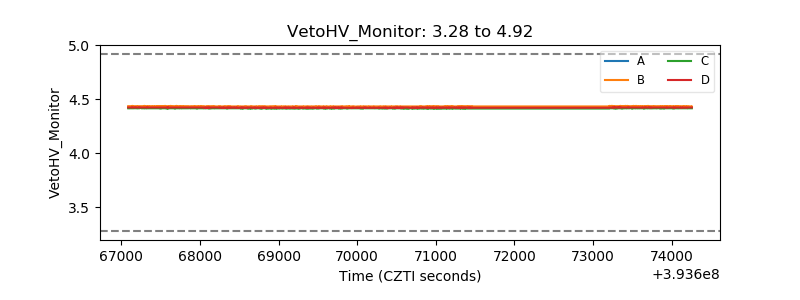 |
| Veto LLD | 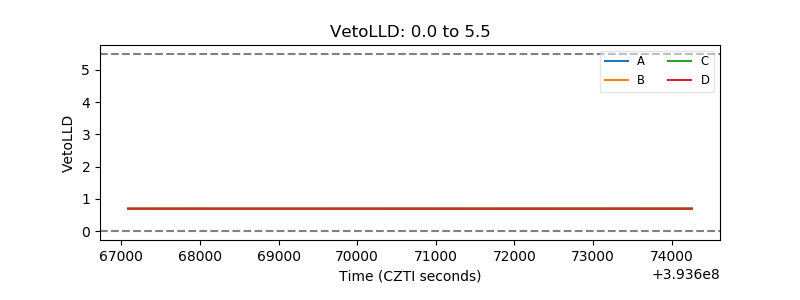 |
| Alpha Counter | 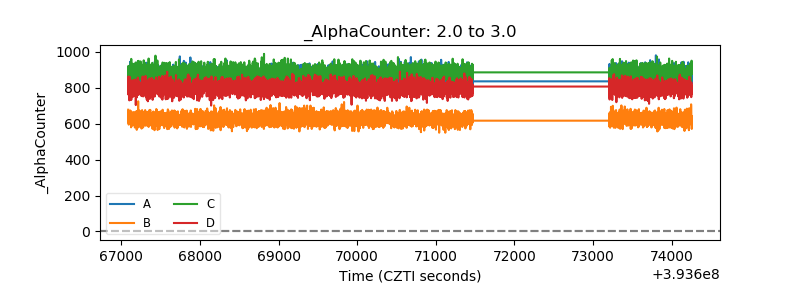 |
| _CPM_Rate | 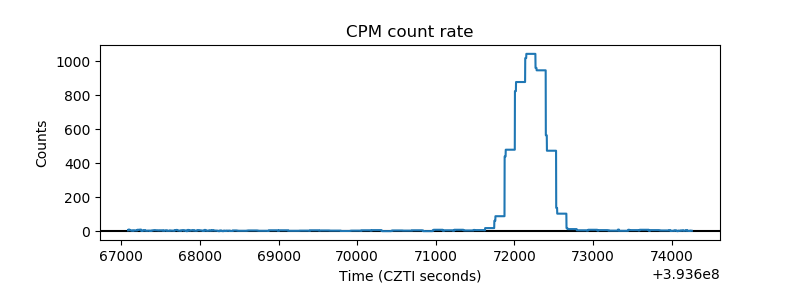 |
| CZT Counter | 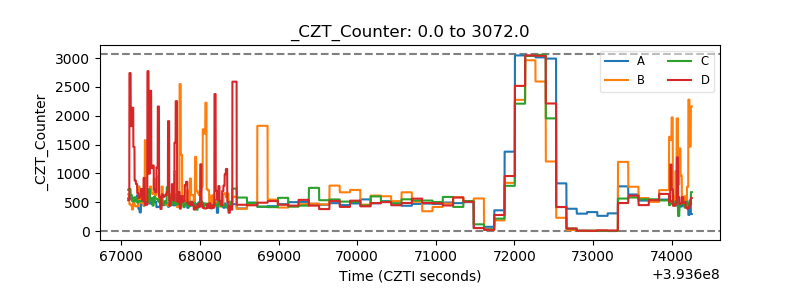 |
| +2.5 Volts monitor | 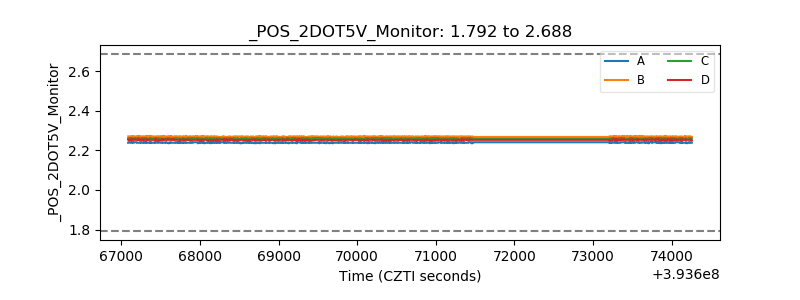 |
| +5 Volts monitor | 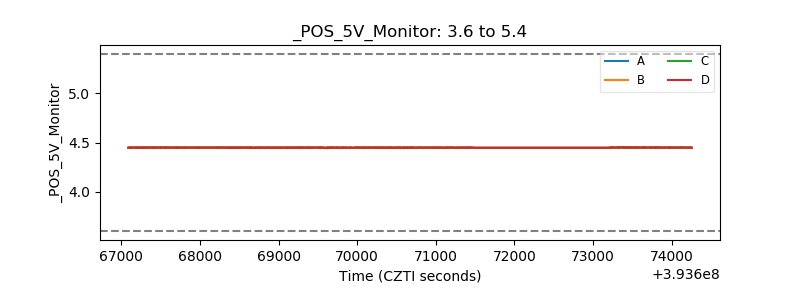 |
| _ROLL_ROT | 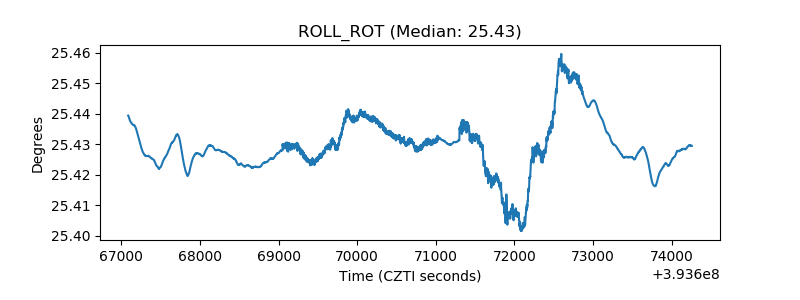 |
| _Roll_DEC | 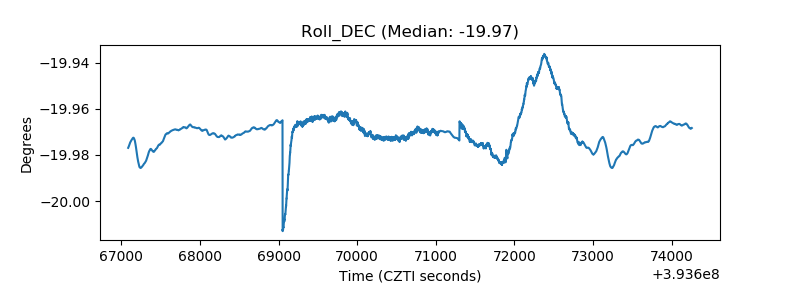 |
| _Roll_RA | 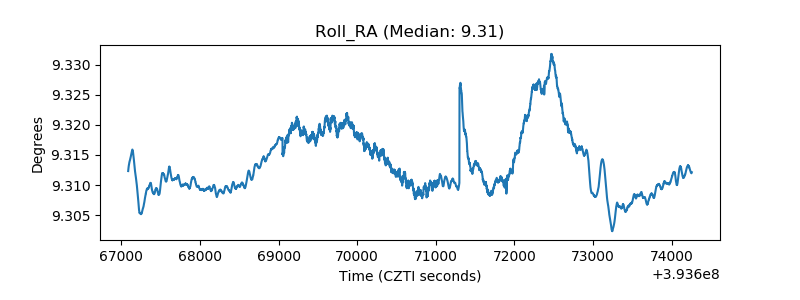 |
| Veto Counter | 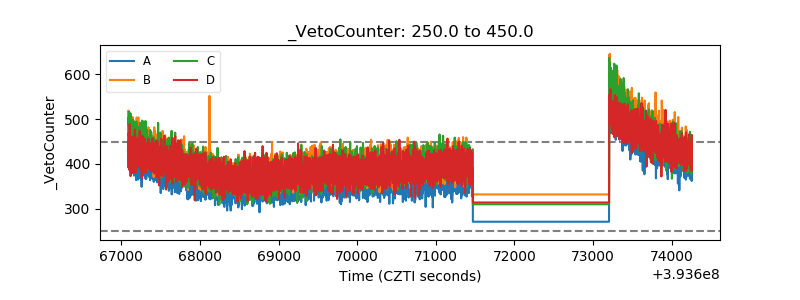 |