| Param | Original file | Final file |
|---|---|---|
| Filename | modeM0/AS1T04_084T01_9000005198_36414cztM0_level2.evt | modeM0/AS1T04_084T01_9000005198_36414cztM0_level2_quad_clean.evt |
| Size (bytes) | 1,414,949,760 | 176,440,320 |
| Size | 1.3 GB | 168.3 MB |
| Events in quadrant A | 7,927,354 | 1,089,512 |
| Events in quadrant B | 11,330,446 | 1,080,120 |
| Events in quadrant C | 8,402,691 | 1,081,478 |
| Events in quadrant D | 14,095,860 | 971,905 |
| Mode M0 | |||
|---|---|---|---|
| Quadrant | BADHDUFLAG | Total packets | Discarded packets |
| A | 0 | 33974 | 5 |
| B | 0 | 44578 | 4 |
| C | 0 | 34627 | 4 |
| D | 0 | 52940 | 4 |
| Mode SS | |||
|---|---|---|---|
| Quadrant | BADHDUFLAG | Total packets | Discarded packets |
| A | 0 | 332 | 0 |
| B | 0 | 332 | 0 |
| C | 0 | 332 | 0 |
| D | 0 | 332 | 0 |
| Mode M9 | |||
|---|---|---|---|
| Quadrant | BADHDUFLAG | Total packets | Discarded packets |
| A | 0 | 55 | 0 |
| B | 0 | 55 | 0 |
| C | 0 | 55 | 0 |
| D | 0 | 55 | 0 |
| Quadrant | Total seconds | Saturated seconds | Saturation percentage |
|---|---|---|---|
| A | 16239 | 28 | 0.172424% |
| B | 16239 | 1062 | 6.539812% |
| C | 16239 | 159 | 0.979124% |
| D | 16239 | 2145 | 13.208941% |
Noise dominated data is calculated using 1-second bins in cleaned event files. If a bin has >2000 counts, and if more than 50% of those come from <1% of pixels, then it is considered to be noise-dominated and hence unusable.
| Quadrant | # 1 sec bins | Bins with >0 counts | Bins with >2000 counts | High rate bins dominated by noise | Noise dominated (total time) | Noise dominated (detector-on time) | Marked lightcurve |
|---|---|---|---|---|---|---|---|
| A | 21697 | 16243 | 1 | 1 | 0.00% | 0.01% | 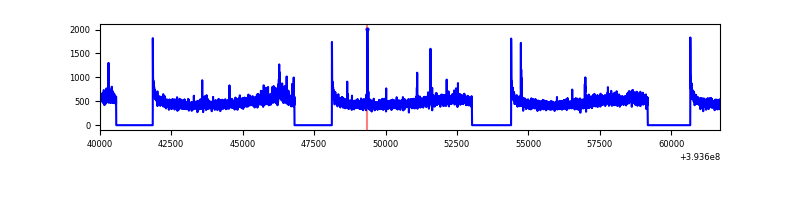 |
| B | 21697 | 16243 | 668 | 668 | 3.08% | 4.11% | 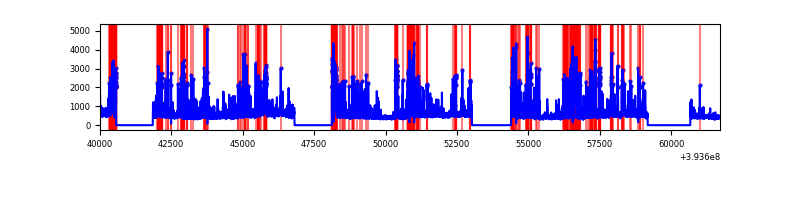 |
| C | 21697 | 16243 | 92 | 92 | 0.42% | 0.57% | 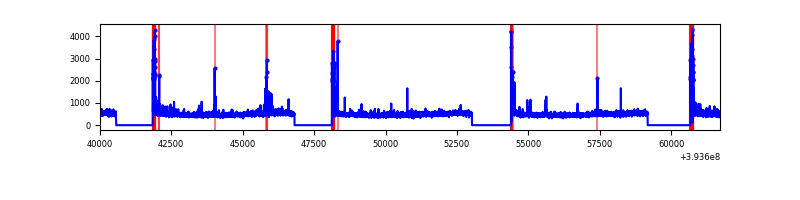 |
| D | 21697 | 16243 | 1863 | 1863 | 8.59% | 11.47% | 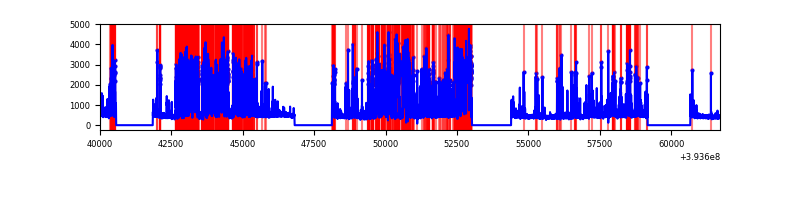 |
Top three noisy pixels from each quadrant. If the there are fewer than three noisy pixels in the level2.evt file, extra rows are filled as -1
| Pixel properties | Quadrant properties | ||||||
|---|---|---|---|---|---|---|---|
| Quadrant | DetID | PixID | Counts | Sigma | Mean | Median | Sigma |
| A | 10 | 83 | 465371 | 1223.97 | 1877 | 1837 | 378.7 |
| A | 15 | 223 | 81281 | 209.77 | 1877 | 1837 | 378.7 |
| A | 12 | 189 | 56566 | 144.51 | 1877 | 1837 | 378.7 |
| B | 5 | 172 | 2404736 | 6890.53 | 1813 | 1763 | 348.7 |
| B | 5 | 255 | 743340 | 2126.47 | 1813 | 1763 | 348.7 |
| B | 5 | 236 | 347942 | 992.67 | 1813 | 1763 | 348.7 |
| C | 15 | 214 | 688381 | 1634.68 | 1811 | 1821 | 420.0 |
| C | 0 | 10 | 625842 | 1485.77 | 1811 | 1821 | 420.0 |
| C | 0 | 207 | 17463 | 37.24 | 1811 | 1821 | 420.0 |
| D | 2 | 249 | 4303488 | 10196.02 | 1716 | 1667 | 421.9 |
| D | 12 | 227 | 1808414 | 4282.29 | 1716 | 1667 | 421.9 |
| D | 2 | 250 | 410243 | 968.39 | 1716 | 1667 | 421.9 |
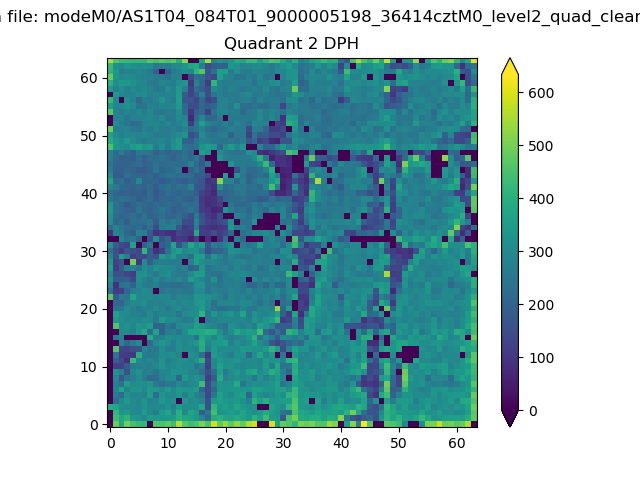
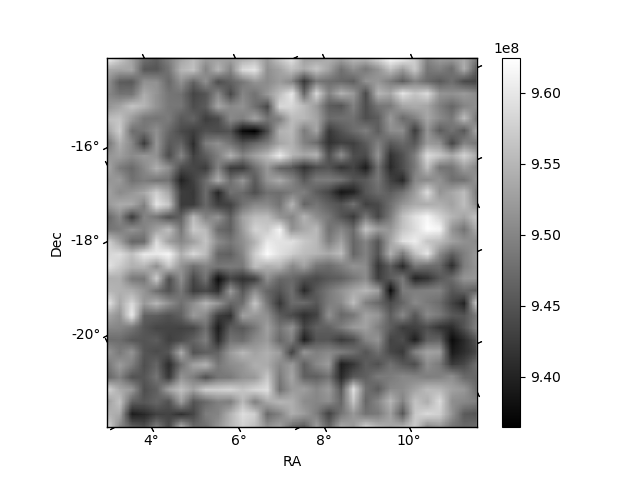
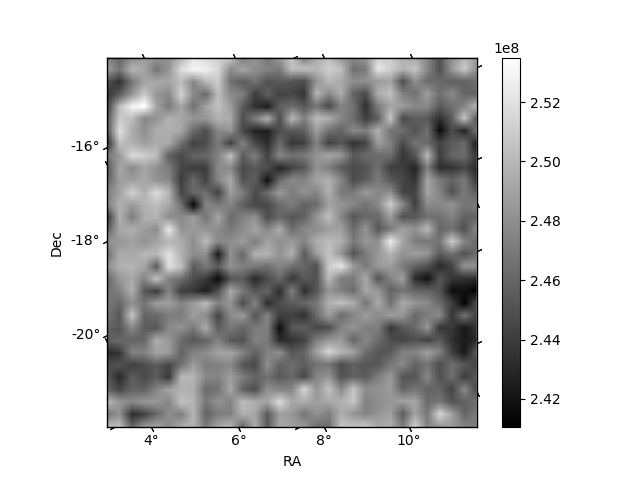
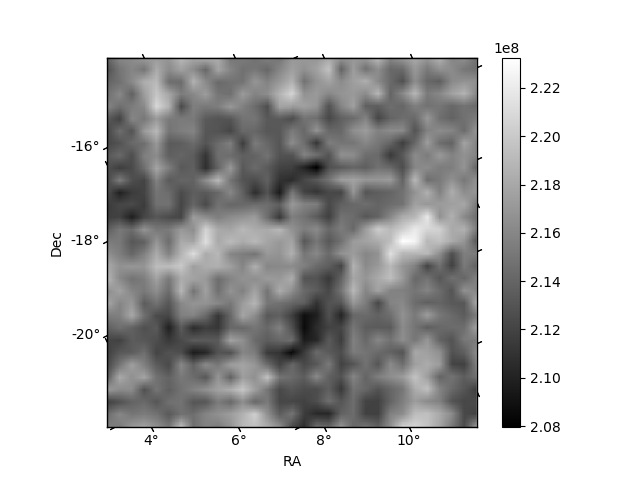
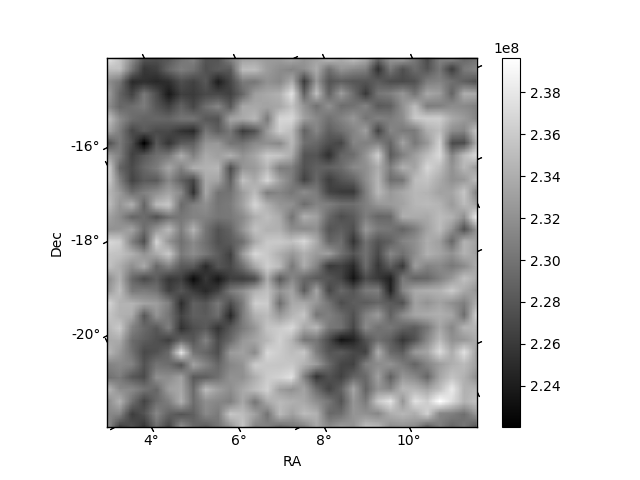
Histogram calculated using DETX and DETY for each event in the final _common_clean file
| Quadrant A | 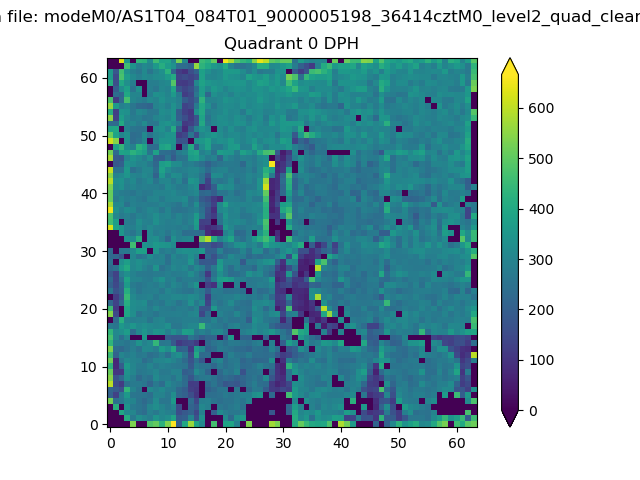 |
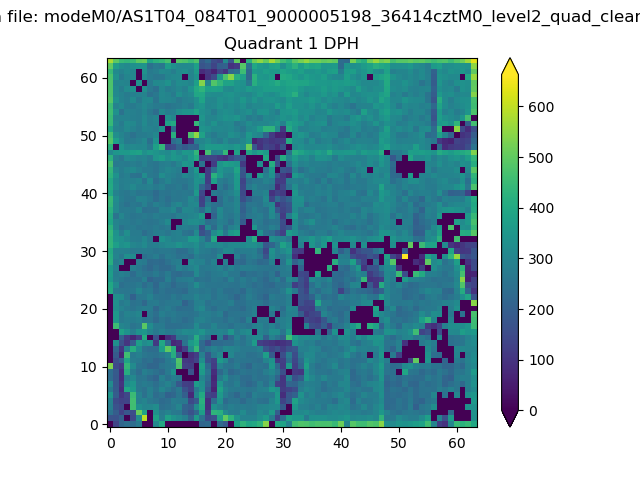 |
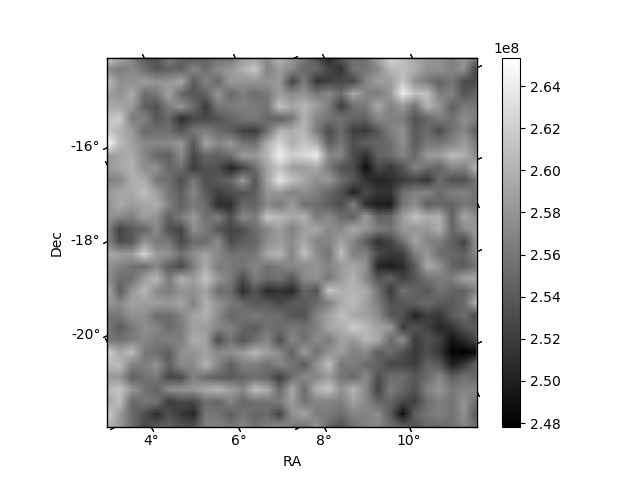
Quadrant B |
|---|---|---|---|
| Quadrant D | 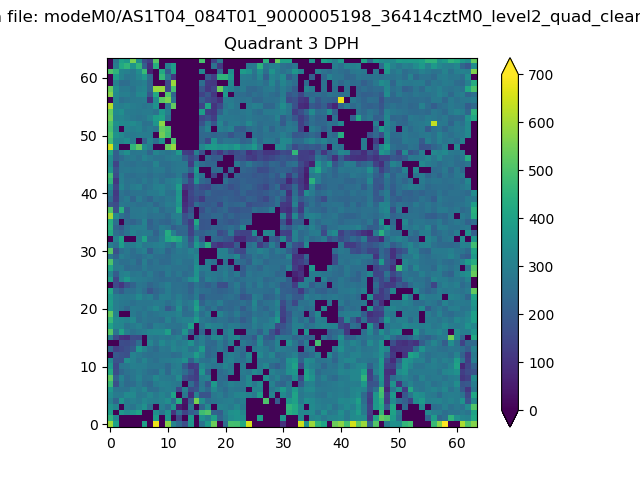 |
 |
Quadrant C |
| Plot type | Count rate plots | Images |
|---|---|---|
| Comparison with Poisson distribution Blue bars denote a histogram of data divided into 1 sec bins. Red curve is a Poisson curve with rate = median count rate of data. |
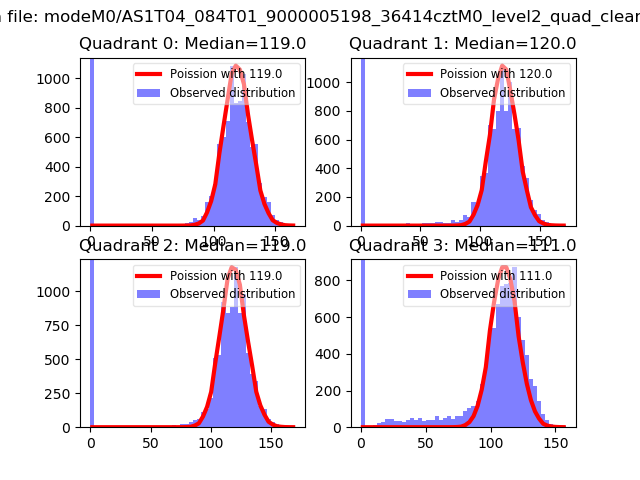 |
 |
| Quadrant-wise count rates Data is divided into 100 sec bins |
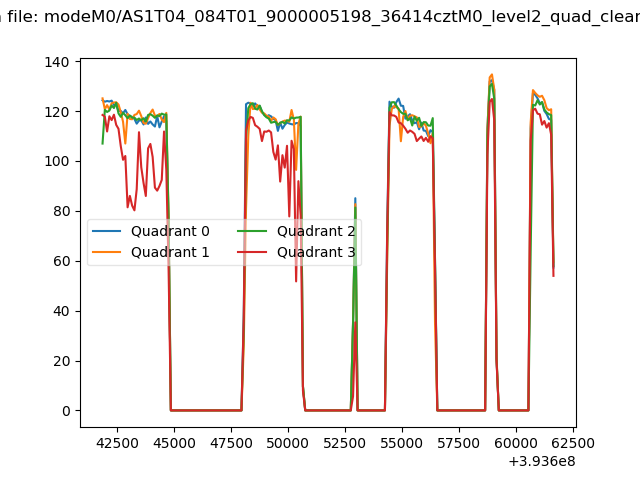 |
|
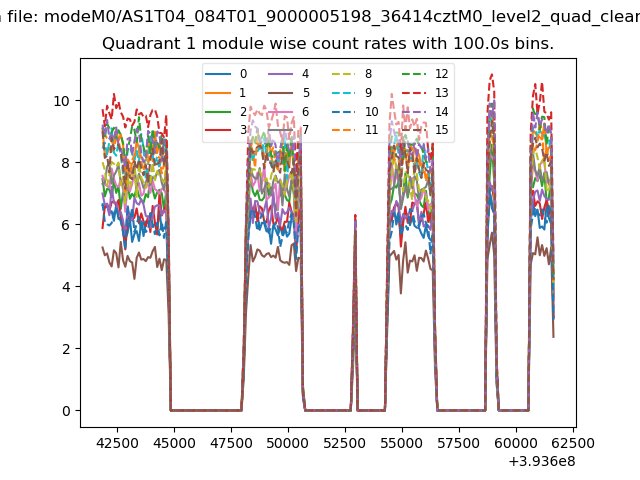
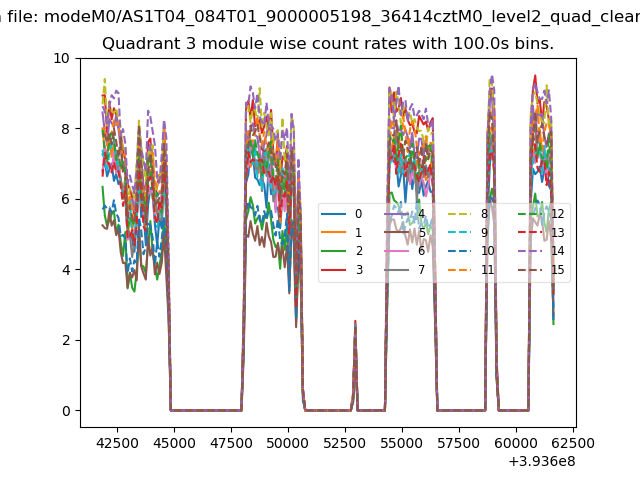
| Module-wise count rates for Quadrant A Data is divided into 100 sec bins |
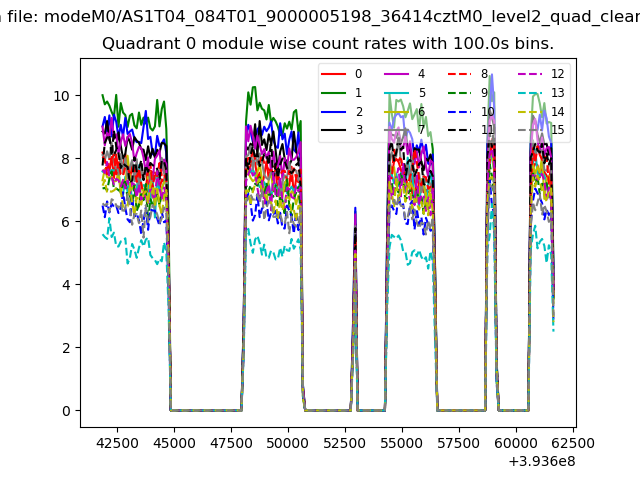 |
 |
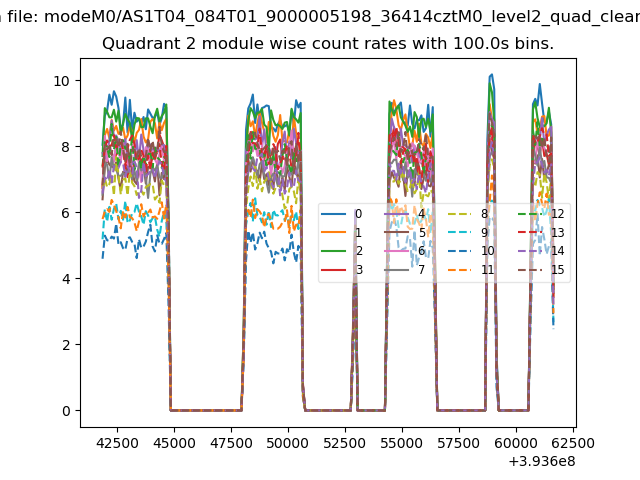
| Module-wise count rates for Quadrant B Data is divided into 100 sec bins |
 |
 |
| Module-wise count rates for Quadrant C Data is divided into 100 sec bins |
 |
 |
| Module-wise count rates for Quadrant D Data is divided into 100 sec bins |
 |
 |
| Parameter | Plot |
|---|---|
| CZT HV Monitor | 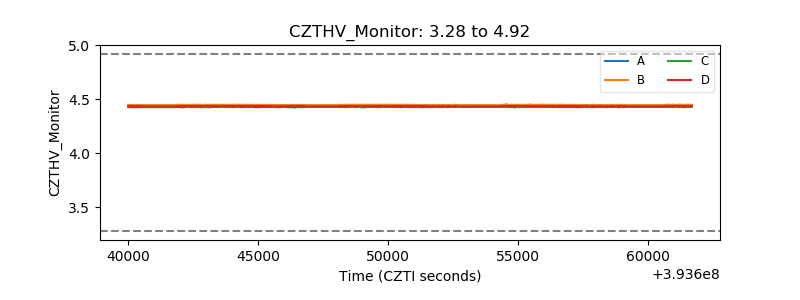 |
| D_VDD | 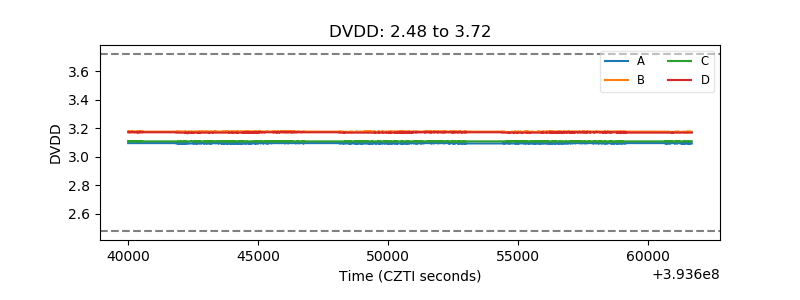 |
| Temperature 1 | 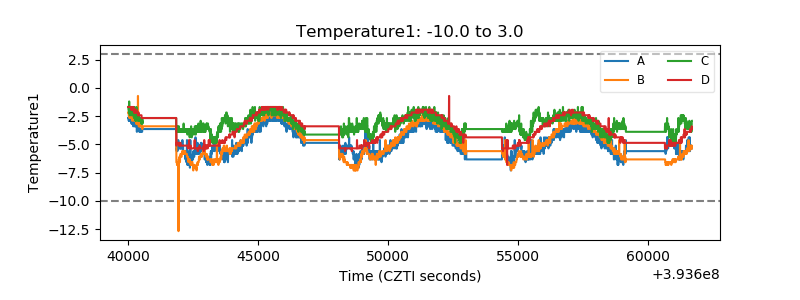 |
| Veto HV Monitor | 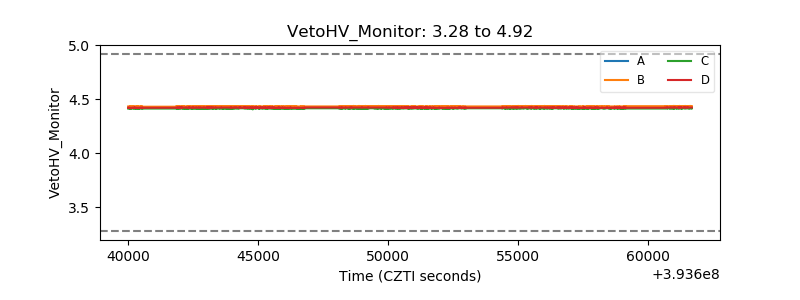 |
| Veto LLD | 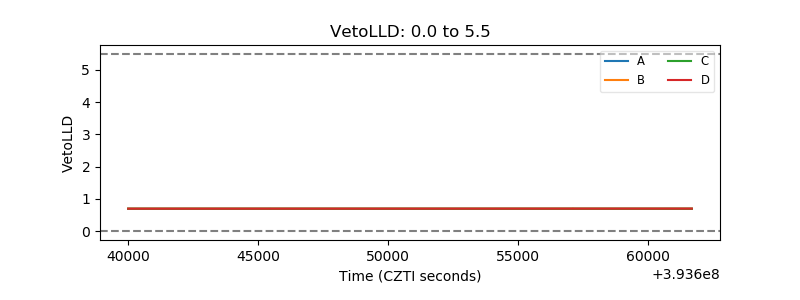 |
| Alpha Counter | 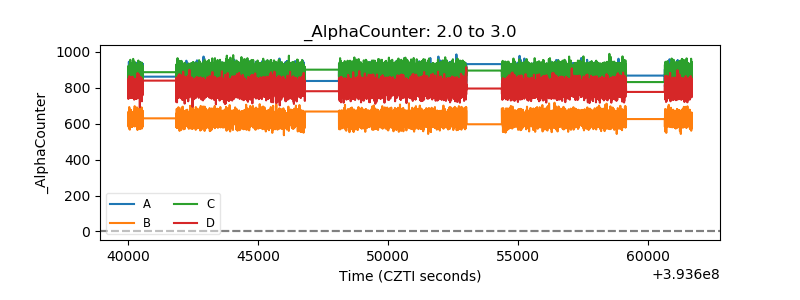 |
| _CPM_Rate | 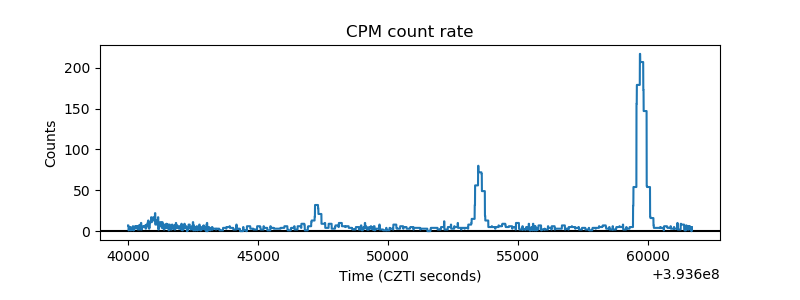 |
| CZT Counter | 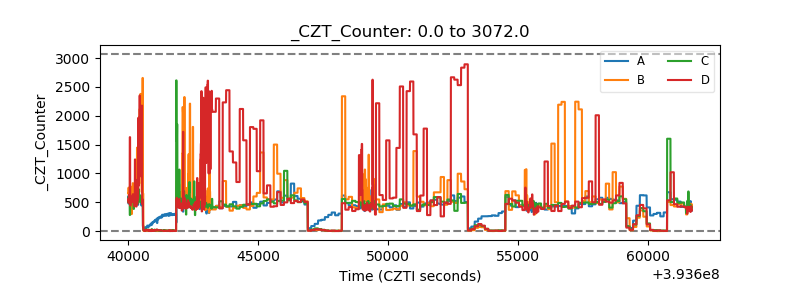 |
| +2.5 Volts monitor | 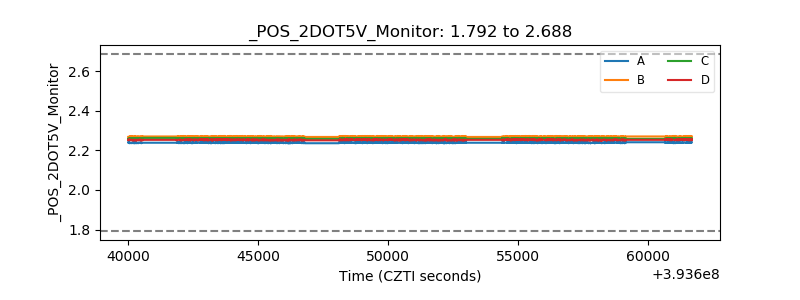 |
| +5 Volts monitor | 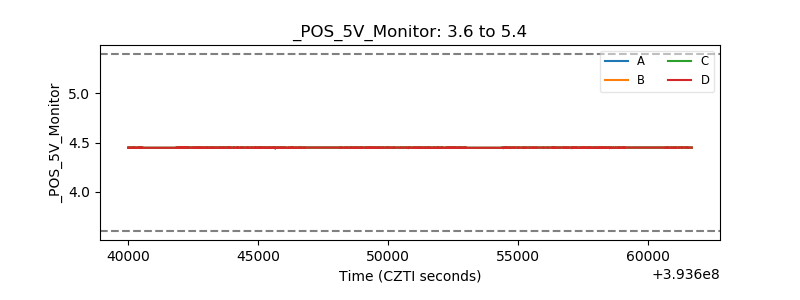 |
| _ROLL_ROT | 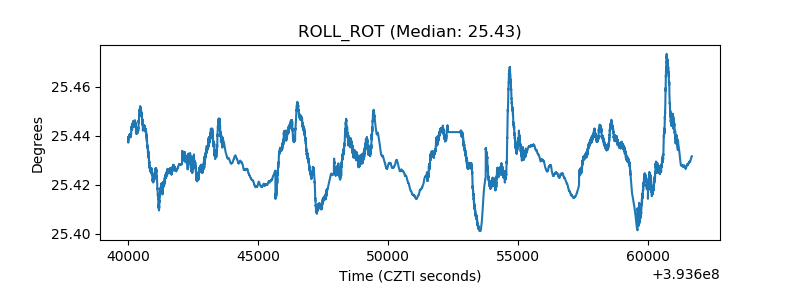 |
| _Roll_DEC | 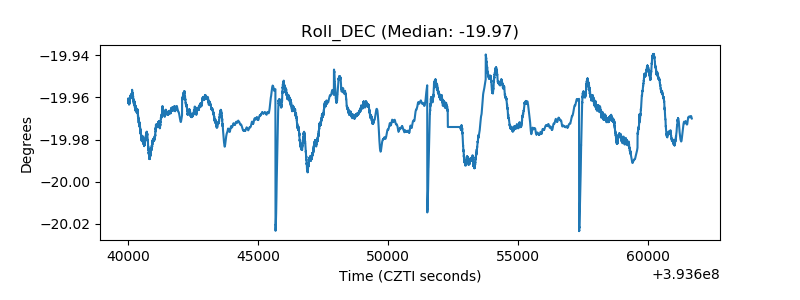 |
| _Roll_RA | 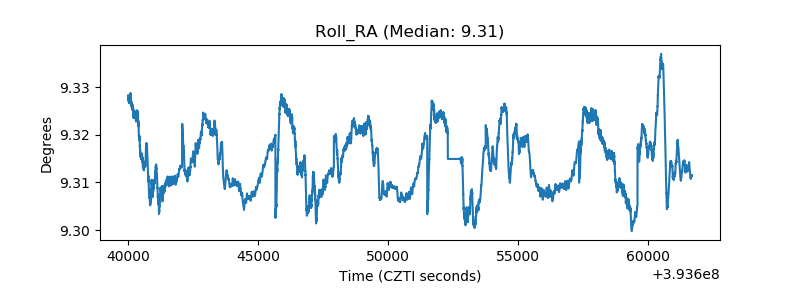 |
| Veto Counter | 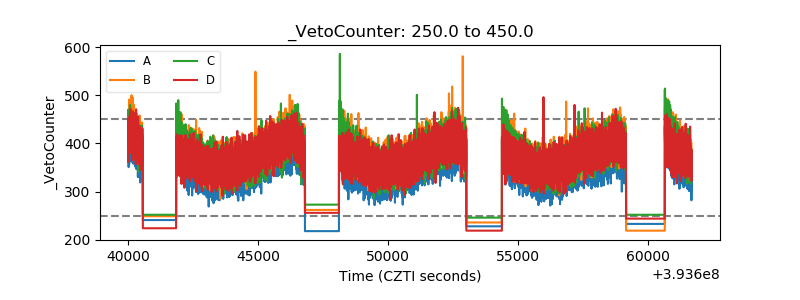 |