| Param | Original file | Final file |
|---|---|---|
| Filename | modeM0/AS1T04_084T01_9000005198_36411cztM0_level2.evt | modeM0/AS1T04_084T01_9000005198_36411cztM0_level2_quad_clean.evt |
| Size (bytes) | 513,889,920 | 82,321,920 |
| Size | 490.1 MB | 78.5 MB |
| Events in quadrant A | 3,080,366 | 527,019 |
| Events in quadrant B | 4,819,139 | 511,463 |
| Events in quadrant C | 3,299,839 | 519,807 |
| Events in quadrant D | 3,936,897 | 495,265 |
| Mode M0 | |||
|---|---|---|---|
| Quadrant | BADHDUFLAG | Total packets | Discarded packets |
| A | 0 | 13186 | 3 |
| B | 0 | 18585 | 2 |
| C | 0 | 13526 | 2 |
| D | 0 | 15955 | 2 |
| Mode SS | |||
|---|---|---|---|
| Quadrant | BADHDUFLAG | Total packets | Discarded packets |
| A | 0 | 128 | 0 |
| B | 0 | 128 | 0 |
| C | 0 | 128 | 0 |
| D | 0 | 128 | 0 |
| Mode M9 | |||
|---|---|---|---|
| Quadrant | BADHDUFLAG | Total packets | Discarded packets |
| A | 0 | 27 | 0 |
| B | 0 | 27 | 0 |
| C | 0 | 27 | 0 |
| D | 0 | 27 | 0 |
| Quadrant | Total seconds | Saturated seconds | Saturation percentage |
|---|---|---|---|
| A | 6300 | 9 | 0.142857% |
| B | 6300 | 540 | 8.571429% |
| C | 6300 | 64 | 1.015873% |
| D | 6300 | 213 | 3.380952% |
Noise dominated data is calculated using 1-second bins in cleaned event files. If a bin has >2000 counts, and if more than 50% of those come from <1% of pixels, then it is considered to be noise-dominated and hence unusable.
| Quadrant | # 1 sec bins | Bins with >0 counts | Bins with >2000 counts | High rate bins dominated by noise | Noise dominated (total time) | Noise dominated (detector-on time) | Marked lightcurve |
|---|---|---|---|---|---|---|---|
| A | 8984 | 6302 | 1 | 1 | 0.01% | 0.02% | 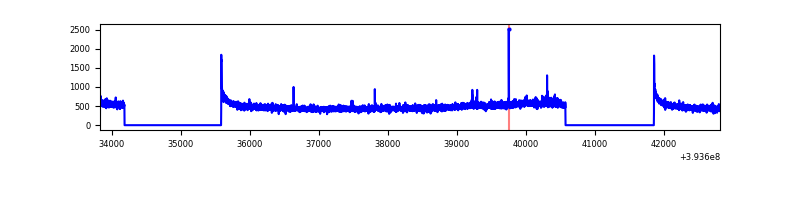 |
| B | 8984 | 6302 | 347 | 347 | 3.86% | 5.51% | 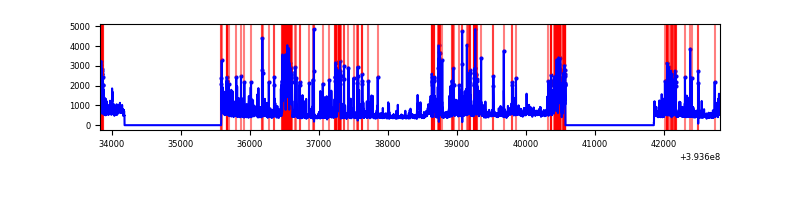 |
| C | 8984 | 6302 | 43 | 43 | 0.48% | 0.68% | 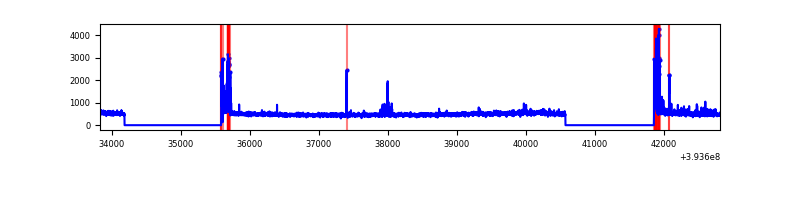 |
| D | 8984 | 6302 | 167 | 167 | 1.86% | 2.65% | 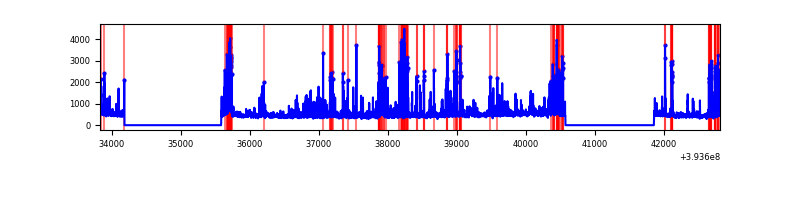 |
Top three noisy pixels from each quadrant. If the there are fewer than three noisy pixels in the level2.evt file, extra rows are filled as -1
| Pixel properties | Quadrant properties | ||||||
|---|---|---|---|---|---|---|---|
| Quadrant | DetID | PixID | Counts | Sigma | Mean | Median | Sigma |
| A | 10 | 83 | 200396 | 1347.01 | 727 | 712 | 148.2 |
| A | 15 | 223 | 39908 | 264.4 | 727 | 712 | 148.2 |
| A | 8 | 144 | 22182 | 144.83 | 727 | 712 | 148.2 |
| B | 5 | 172 | 1337166 | 9959.53 | 697 | 677 | 134.2 |
| B | 5 | 255 | 349953 | 2602.81 | 697 | 677 | 134.2 |
| B | 0 | 189 | 204972 | 1522.41 | 697 | 677 | 134.2 |
| C | 15 | 214 | 269896 | 1626.92 | 706 | 711 | 165.5 |
| C | 0 | 10 | 261668 | 1577.19 | 706 | 711 | 165.5 |
| C | 15 | 159 | 11524 | 65.35 | 706 | 711 | 165.5 |
| D | 12 | 6 | 446817 | 2595.12 | 703 | 684 | 171.9 |
| D | 2 | 249 | 253305 | 1469.47 | 703 | 684 | 171.9 |
| D | 2 | 250 | 167444 | 970.03 | 703 | 684 | 171.9 |
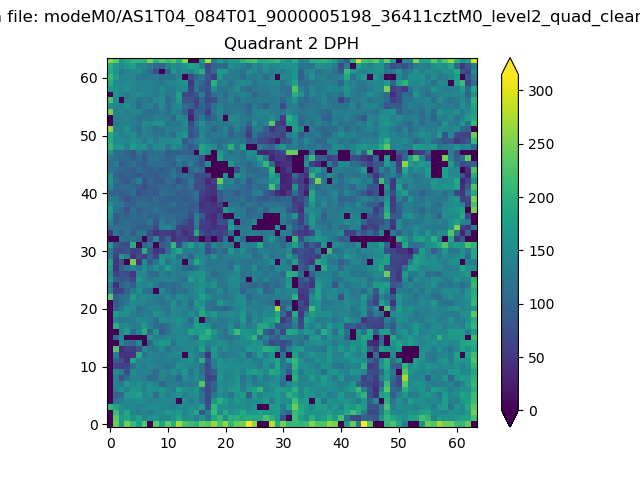
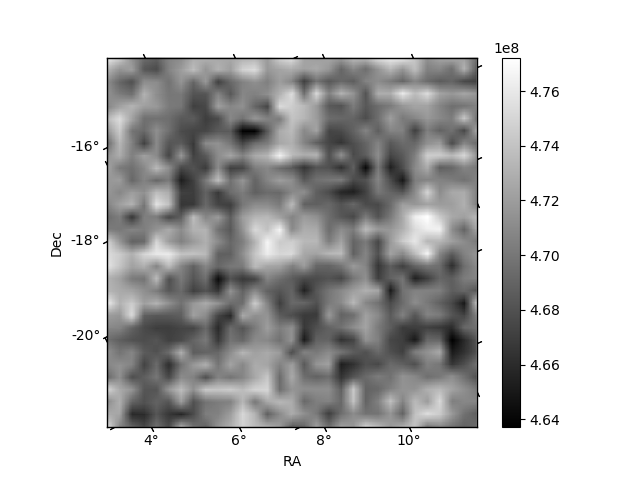
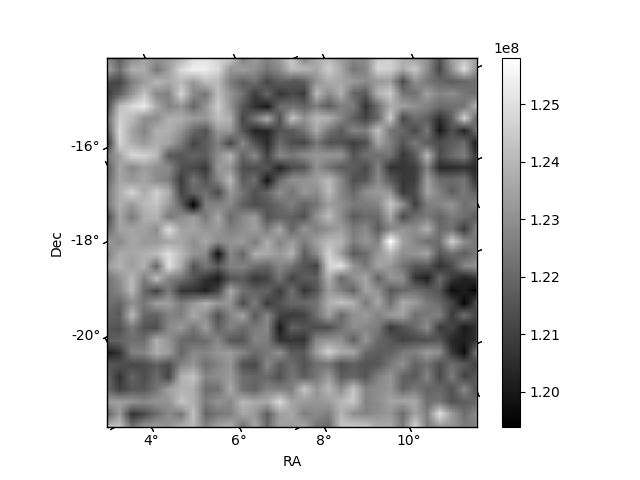
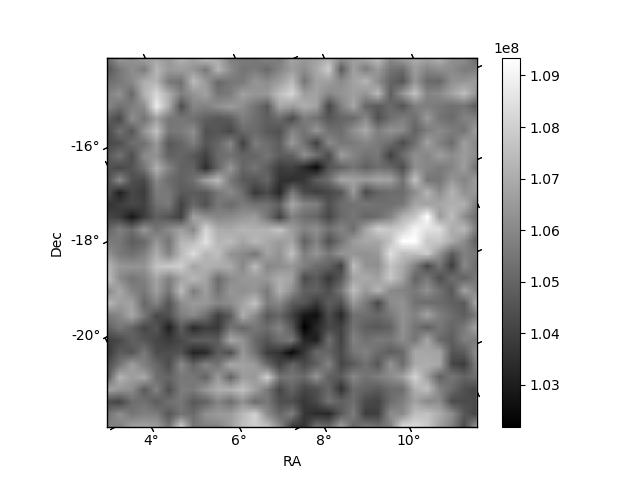
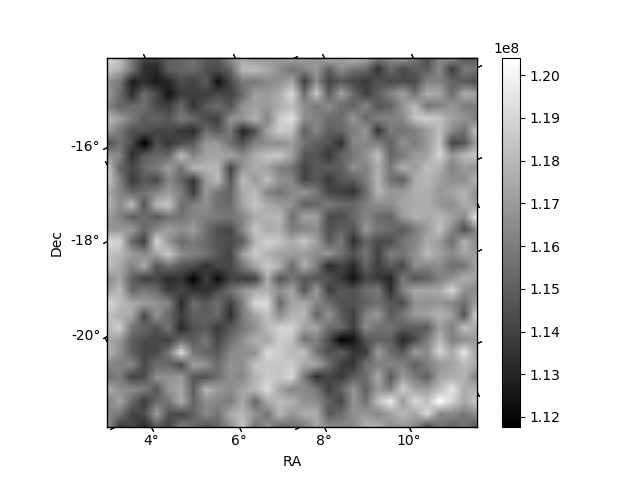
Histogram calculated using DETX and DETY for each event in the final _common_clean file
| Quadrant A | 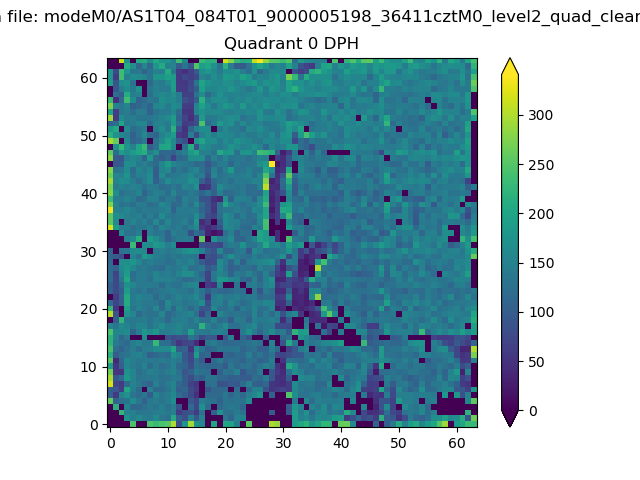 |
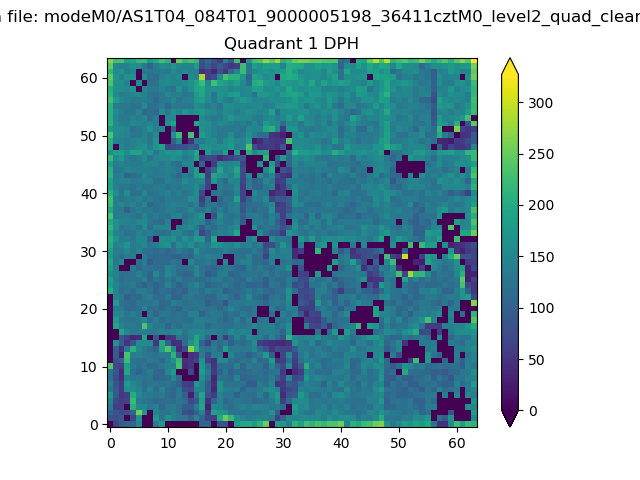 |
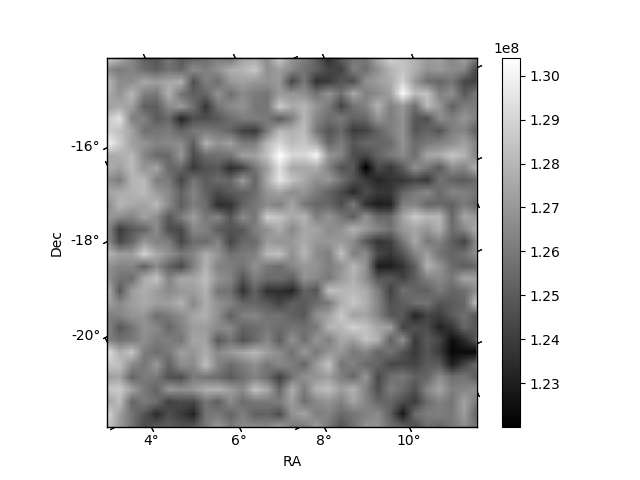
Quadrant B |
|---|---|---|---|
| Quadrant D | 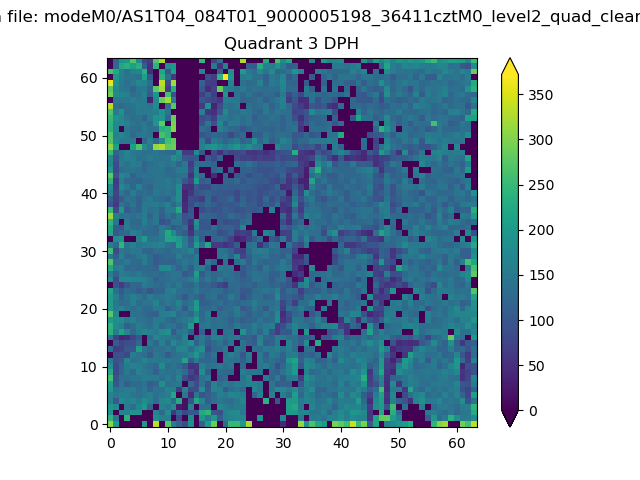 |
 |
Quadrant C |
| Plot type | Count rate plots | Images |
|---|---|---|
| Comparison with Poisson distribution Blue bars denote a histogram of data divided into 1 sec bins. Red curve is a Poisson curve with rate = median count rate of data. |
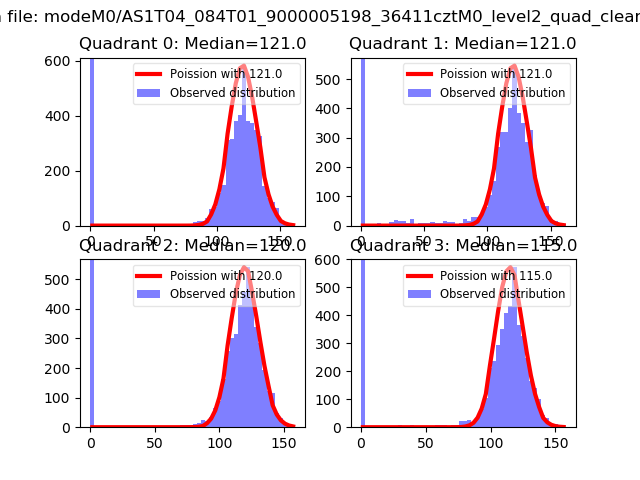 |
 |
| Quadrant-wise count rates Data is divided into 100 sec bins |
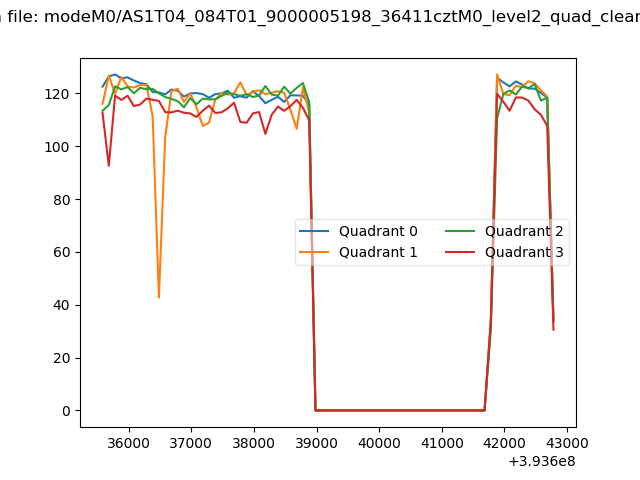 |
|
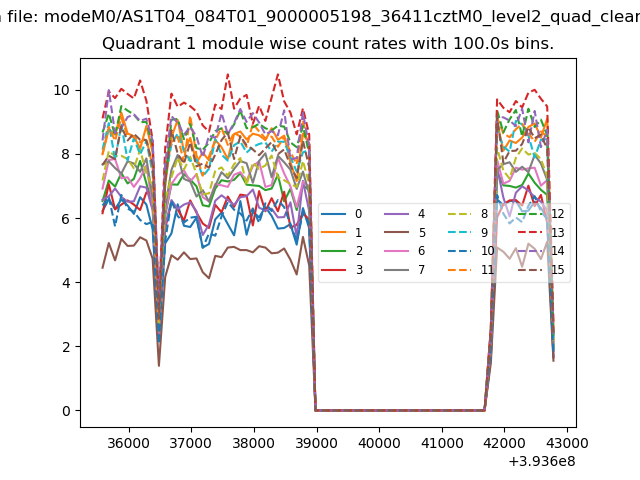
| Module-wise count rates for Quadrant A Data is divided into 100 sec bins |
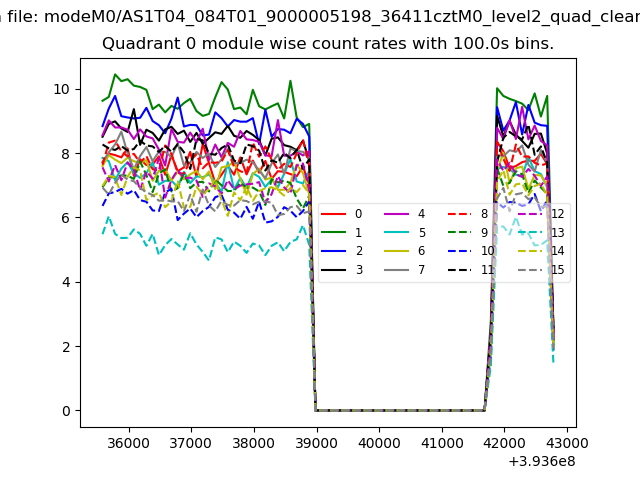 |
 |
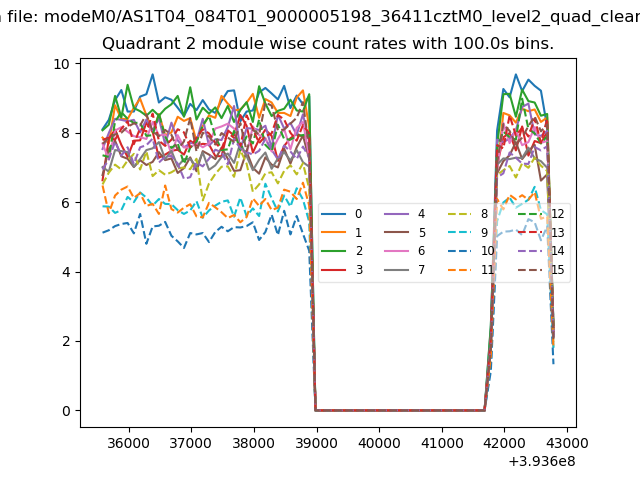
| Module-wise count rates for Quadrant B Data is divided into 100 sec bins |
 |
 |
| Module-wise count rates for Quadrant C Data is divided into 100 sec bins |
 |
 |
| Module-wise count rates for Quadrant D Data is divided into 100 sec bins |
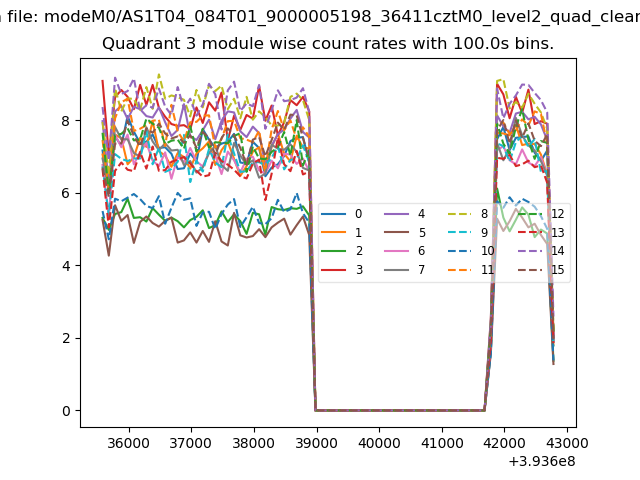 |
 |
| Parameter | Plot |
|---|---|
| CZT HV Monitor | 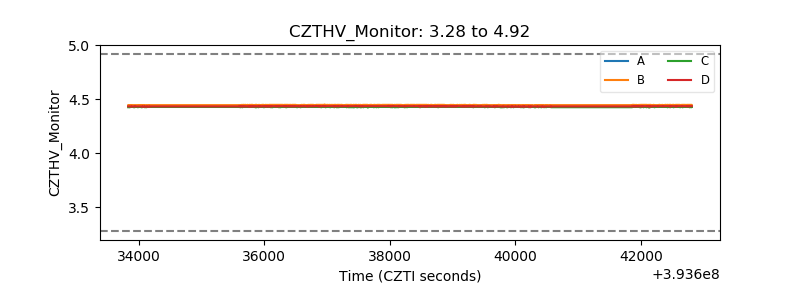 |
| D_VDD | 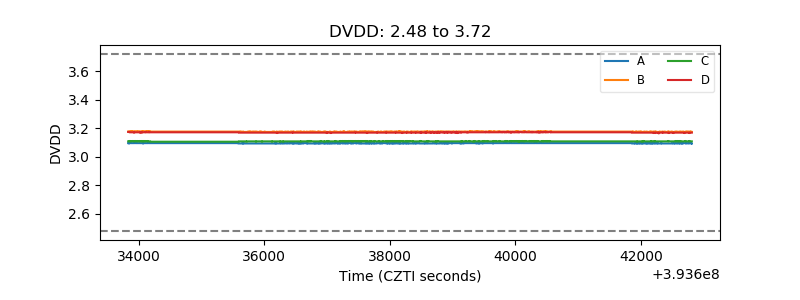 |
| Temperature 1 | 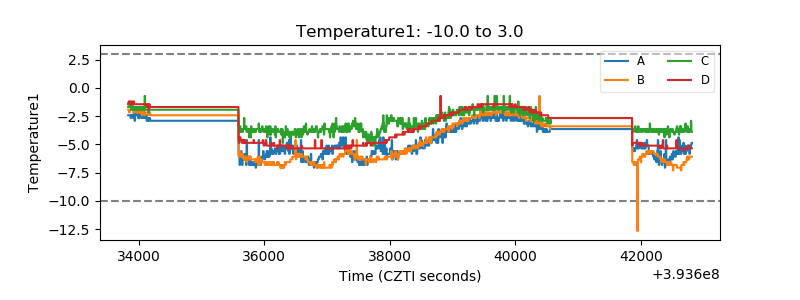 |
| Veto HV Monitor | 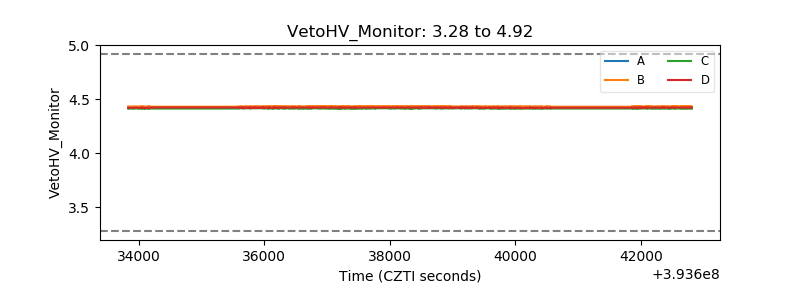 |
| Veto LLD | 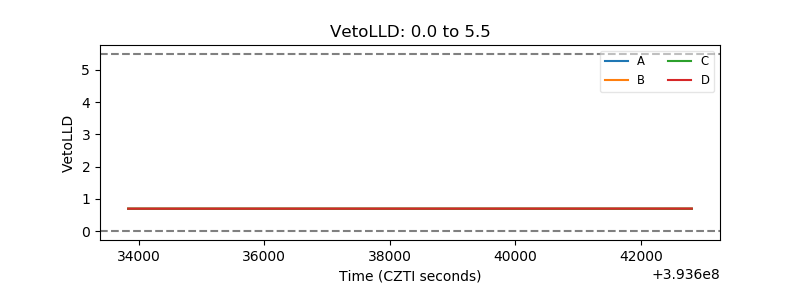 |
| Alpha Counter | 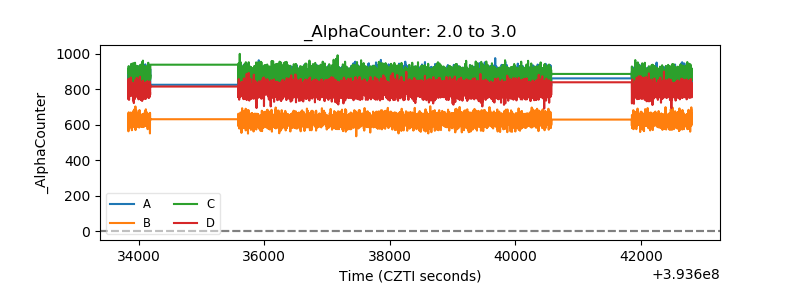 |
| _CPM_Rate | 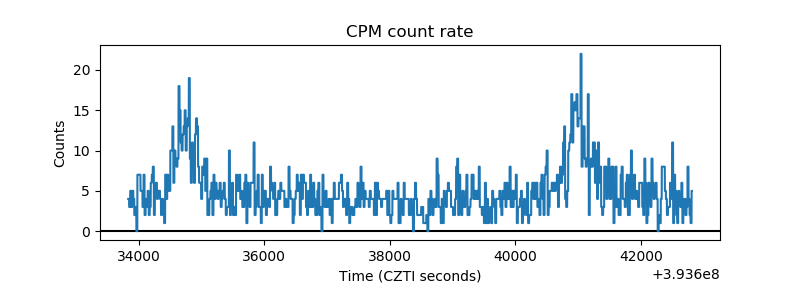 |
| CZT Counter | 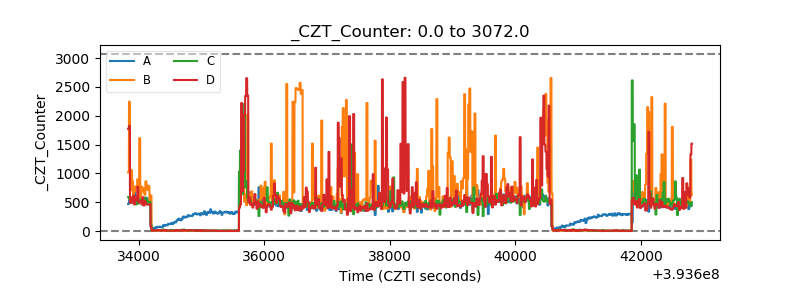 |
| +2.5 Volts monitor | 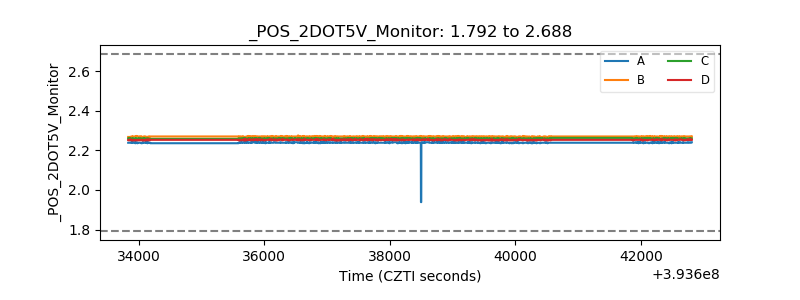 |
| +5 Volts monitor | 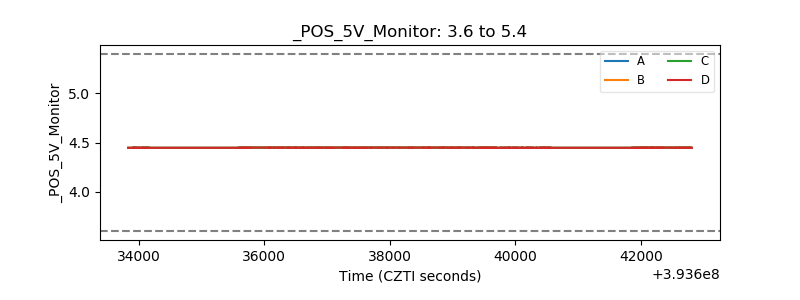 |
| _ROLL_ROT | 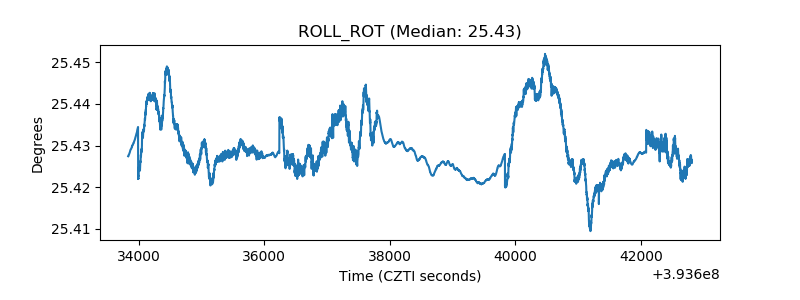 |
| _Roll_DEC | 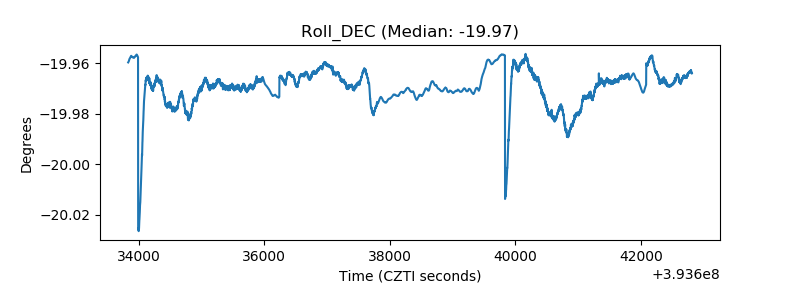 |
| _Roll_RA | 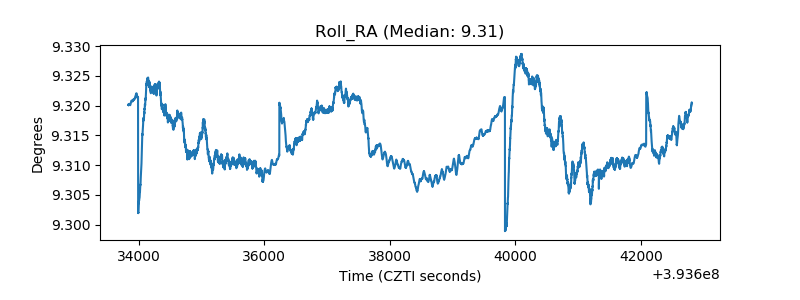 |
| Veto Counter | 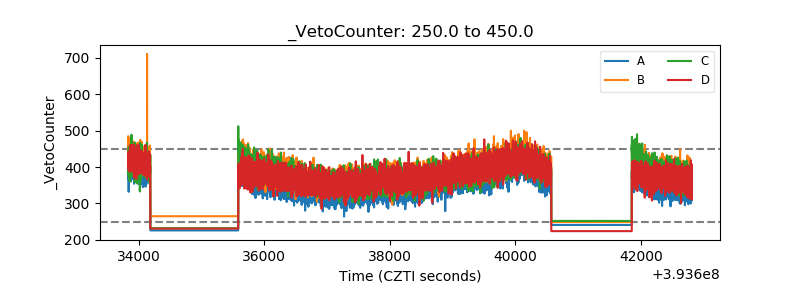 |