| Param | Original file | Final file |
|---|---|---|
| Filename | modeM0/AS1T04_084T01_9000005198_36408cztM0_level2.evt | modeM0/AS1T04_084T01_9000005198_36408cztM0_level2_quad_clean.evt |
| Size (bytes) | 426,908,160 | 69,073,920 |
| Size | 407.1 MB | 65.9 MB |
| Events in quadrant A | 2,540,878 | 445,305 |
| Events in quadrant B | 3,798,197 | 440,403 |
| Events in quadrant C | 2,908,625 | 438,124 |
| Events in quadrant D | 3,337,426 | 412,821 |
| Mode M0 | |||
|---|---|---|---|
| Quadrant | BADHDUFLAG | Total packets | Discarded packets |
| A | 0 | 10654 | 3 |
| B | 0 | 14606 | 2 |
| C | 0 | 11481 | 2 |
| D | 0 | 13232 | 2 |
| Mode SS | |||
|---|---|---|---|
| Quadrant | BADHDUFLAG | Total packets | Discarded packets |
| A | 0 | 104 | 0 |
| B | 0 | 104 | 0 |
| C | 0 | 104 | 0 |
| D | 0 | 104 | 0 |
| Mode M9 | |||
|---|---|---|---|
| Quadrant | BADHDUFLAG | Total packets | Discarded packets |
| A | 0 | 38 | 0 |
| B | 0 | 38 | 0 |
| C | 0 | 38 | 0 |
| D | 0 | 39 | 0 |
| Quadrant | Total seconds | Saturated seconds | Saturation percentage |
|---|---|---|---|
| A | 5057 | 16 | 0.316393% |
| B | 5057 | 223 | 4.409729% |
| C | 5057 | 153 | 3.025509% |
| D | 5057 | 146 | 2.887087% |
Noise dominated data is calculated using 1-second bins in cleaned event files. If a bin has >2000 counts, and if more than 50% of those come from <1% of pixels, then it is considered to be noise-dominated and hence unusable.
| Quadrant | # 1 sec bins | Bins with >0 counts | Bins with >2000 counts | High rate bins dominated by noise | Noise dominated (total time) | Noise dominated (detector-on time) | Marked lightcurve |
|---|---|---|---|---|---|---|---|
| A | 7088 | 5058 | 3 | 3 | 0.04% | 0.06% | 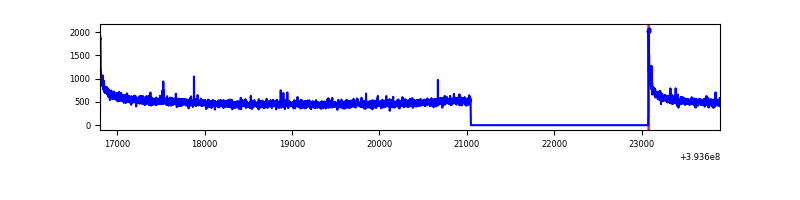 |
| B | 7088 | 5058 | 150 | 150 | 2.12% | 2.97% | 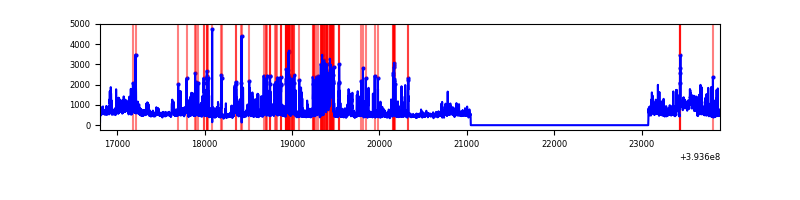 |
| C | 7088 | 5058 | 110 | 110 | 1.55% | 2.17% | 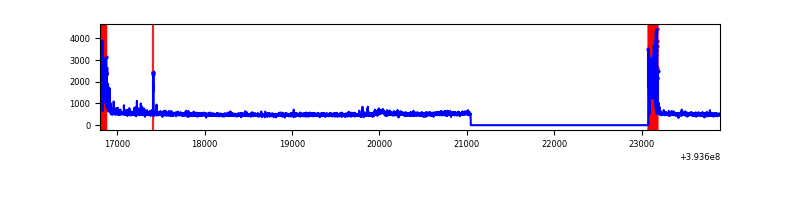 |
| D | 7088 | 5058 | 143 | 143 | 2.02% | 2.83% | 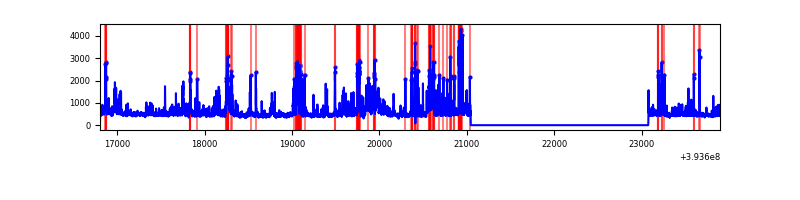 |
Top three noisy pixels from each quadrant. If the there are fewer than three noisy pixels in the level2.evt file, extra rows are filled as -1
| Pixel properties | Quadrant properties | ||||||
|---|---|---|---|---|---|---|---|
| Quadrant | DetID | PixID | Counts | Sigma | Mean | Median | Sigma |
| A | 10 | 83 | 184015 | 1507.44 | 606 | 595 | 121.7 |
| A | 13 | 254 | 8492 | 64.9 | 606 | 595 | 121.7 |
| A | 13 | 6 | 7018 | 52.79 | 606 | 595 | 121.7 |
| B | 5 | 172 | 503607 | 4371.61 | 595 | 579 | 115.1 |
| B | 5 | 255 | 312061 | 2706.96 | 595 | 579 | 115.1 |
| B | 4 | 171 | 215972 | 1871.89 | 595 | 579 | 115.1 |
| C | 0 | 10 | 381464 | 2821.54 | 582 | 586 | 135.0 |
| C | 15 | 214 | 214077 | 1581.54 | 582 | 586 | 135.0 |
| C | 6 | 11 | 22883 | 165.17 | 582 | 586 | 135.0 |
| D | 12 | 6 | 419032 | 2905.18 | 583 | 566 | 144.0 |
| D | 2 | 153 | 383082 | 2655.6 | 583 | 566 | 144.0 |
| D | 2 | 250 | 95022 | 655.76 | 583 | 566 | 144.0 |
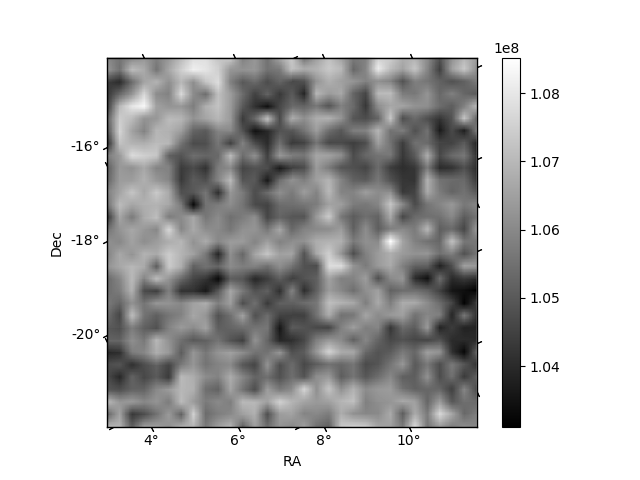
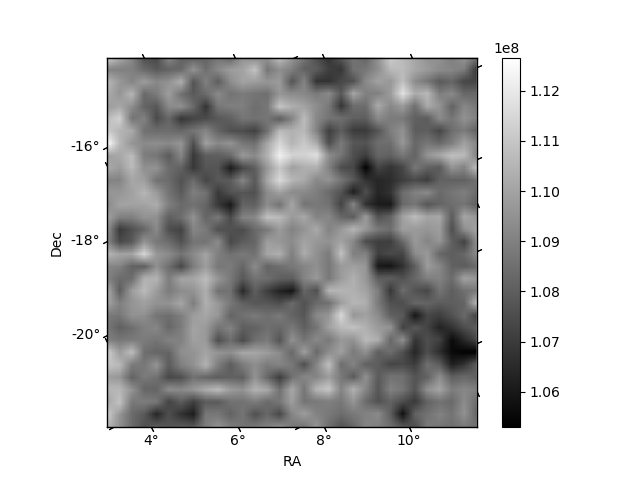
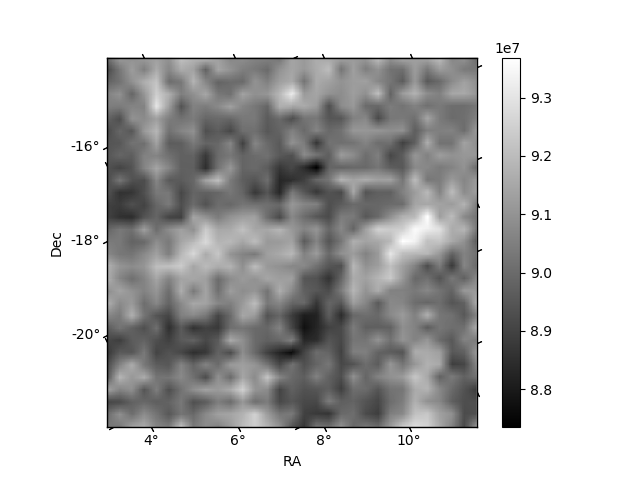
Histogram calculated using DETX and DETY for each event in the final _common_clean file
| Quadrant A | 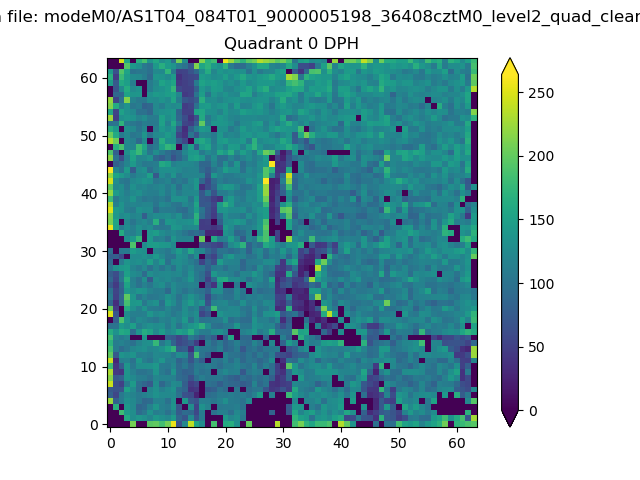 |
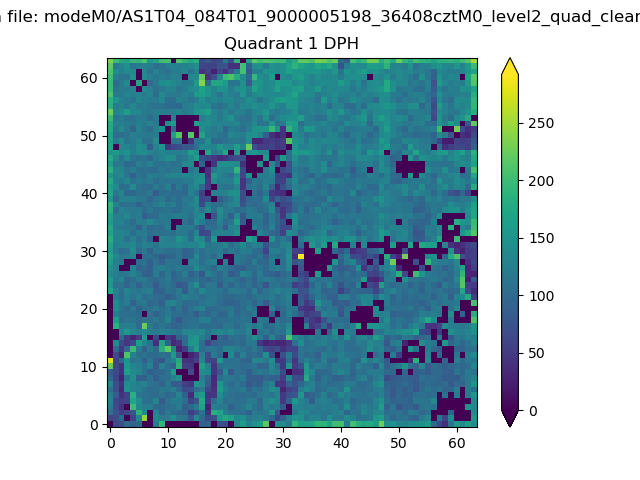 |
Quadrant B |
|---|---|---|---|
| Quadrant D | 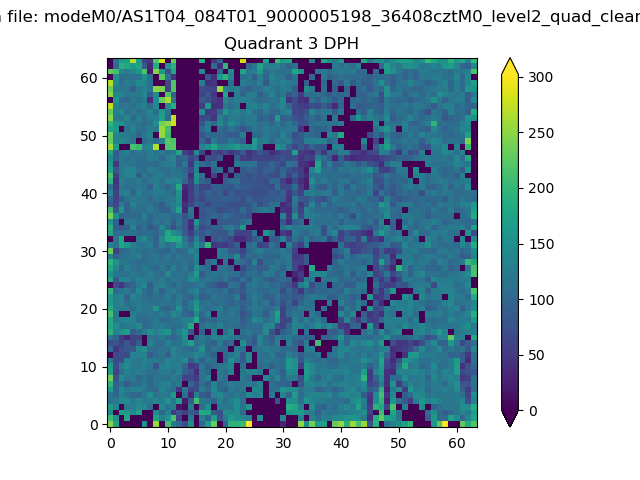 |
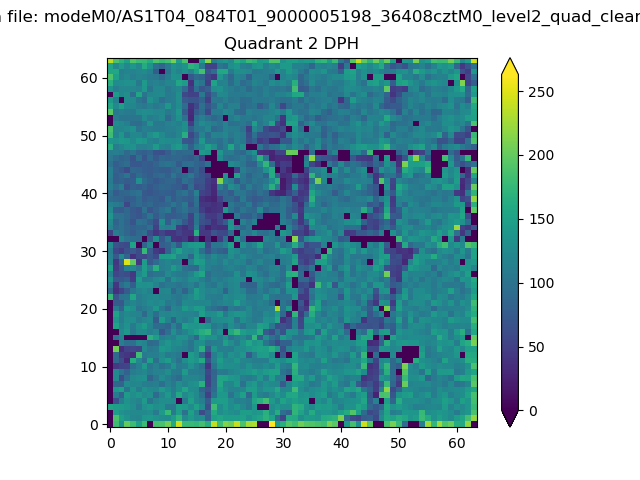 |
Quadrant C |
| Plot type | Count rate plots | Images |
|---|---|---|
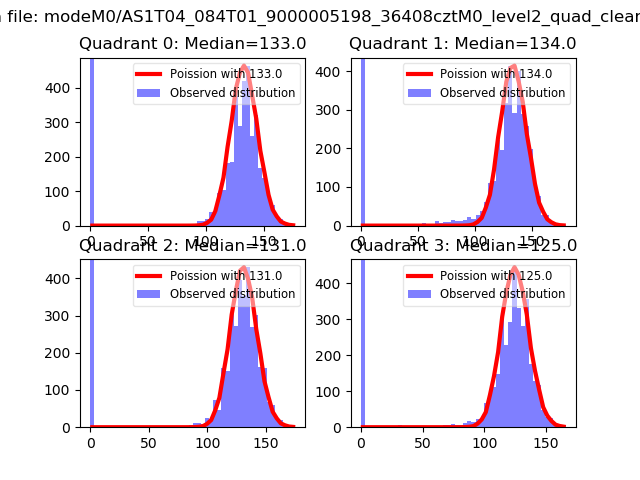
| Comparison with Poisson distribution Blue bars denote a histogram of data divided into 1 sec bins. Red curve is a Poisson curve with rate = median count rate of data. |
 |
 |
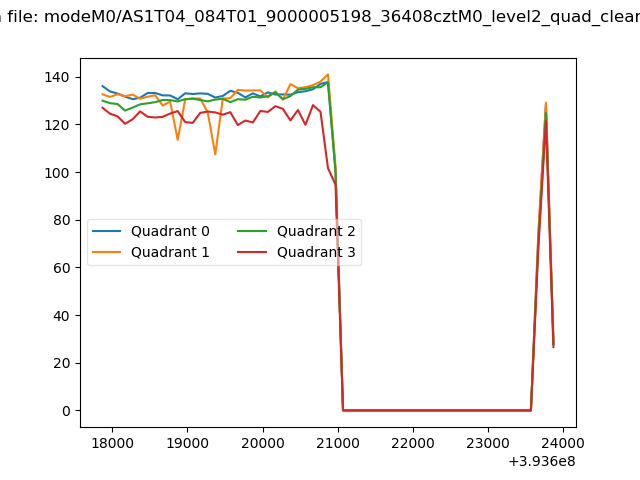
| Quadrant-wise count rates Data is divided into 100 sec bins |
 |
|
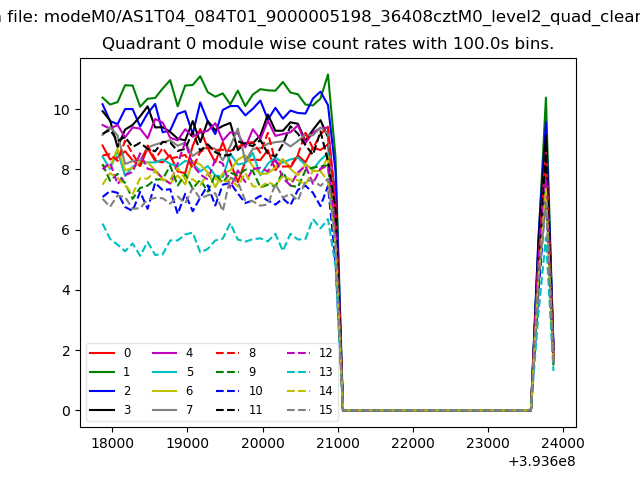
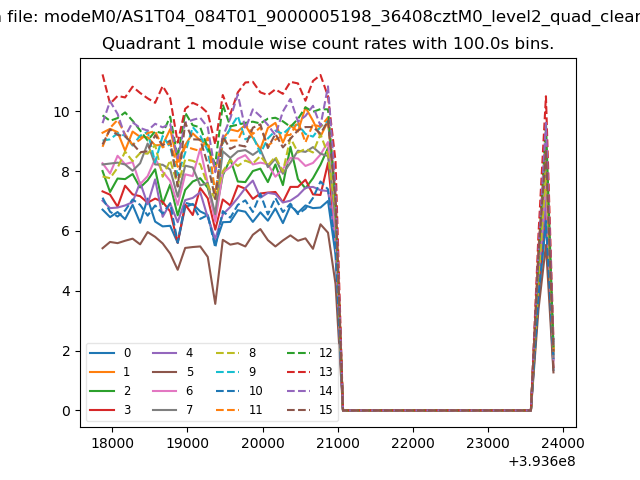
| Module-wise count rates for Quadrant A Data is divided into 100 sec bins |
 |
 |
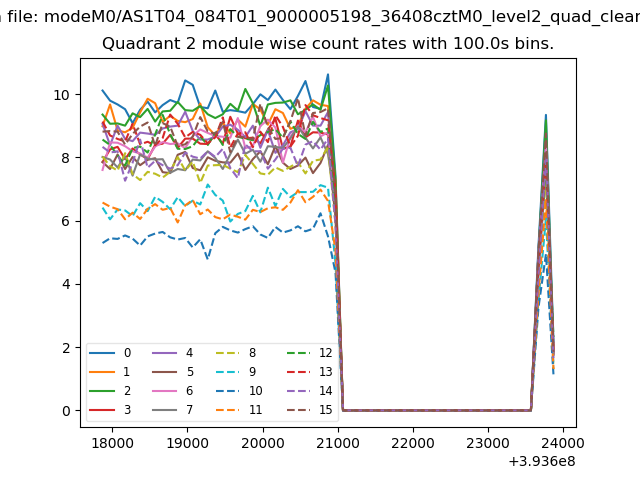
| Module-wise count rates for Quadrant B Data is divided into 100 sec bins |
 |
 |
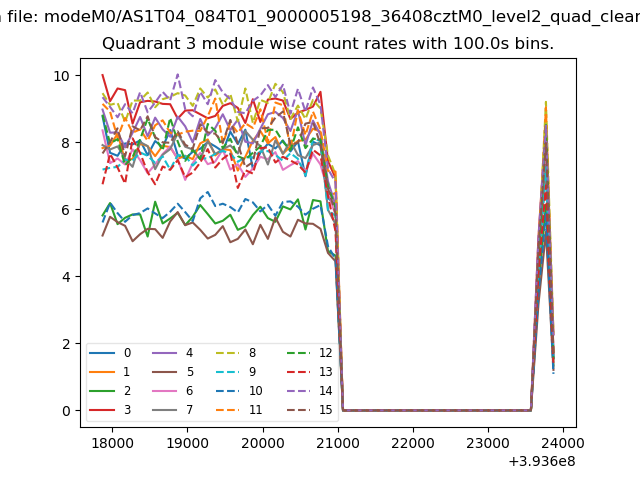
| Module-wise count rates for Quadrant C Data is divided into 100 sec bins |
 |
 |
| Module-wise count rates for Quadrant D Data is divided into 100 sec bins |
 |
 |
| Parameter | Plot |
|---|---|
| CZT HV Monitor | 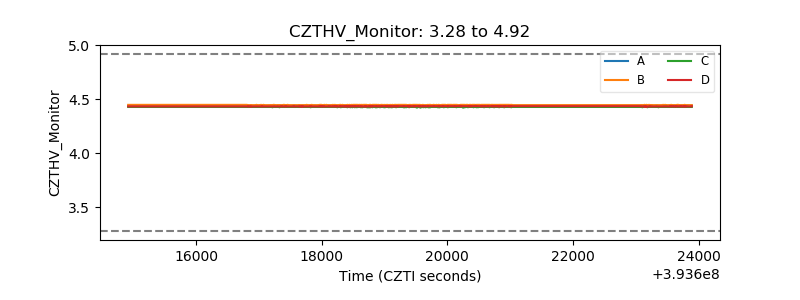 |
| D_VDD | 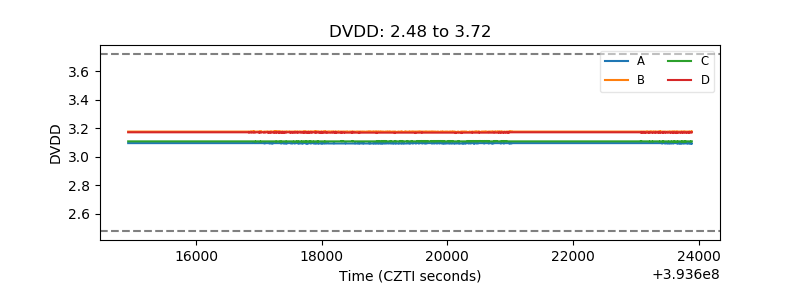 |
| Temperature 1 | 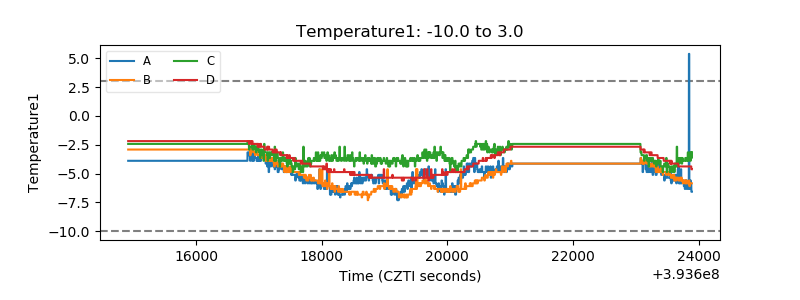 |
| Veto HV Monitor | 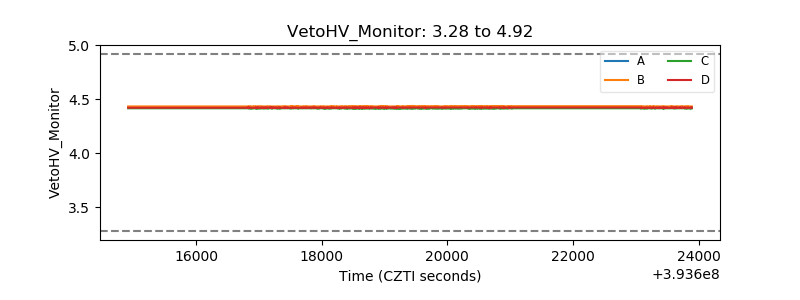 |
| Veto LLD | 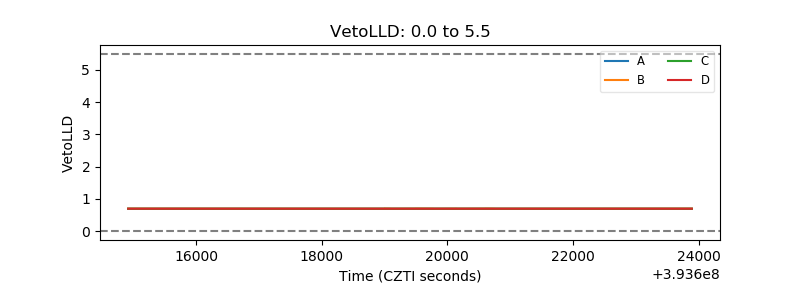 |
| Alpha Counter | 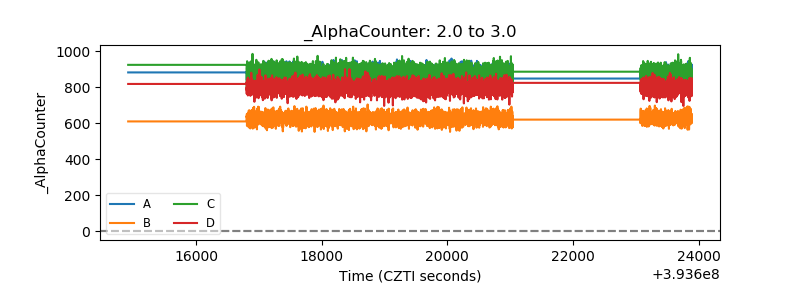 |
| _CPM_Rate | 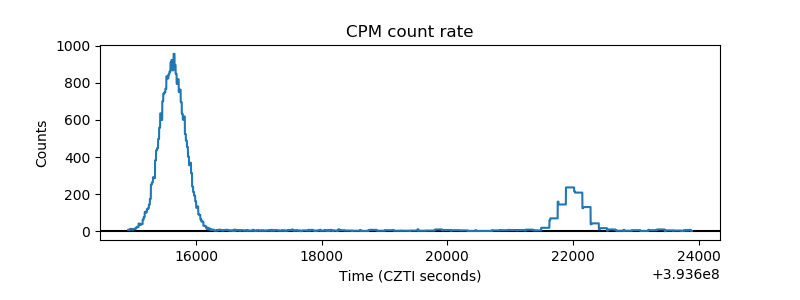 |
| CZT Counter |  |
| +2.5 Volts monitor | 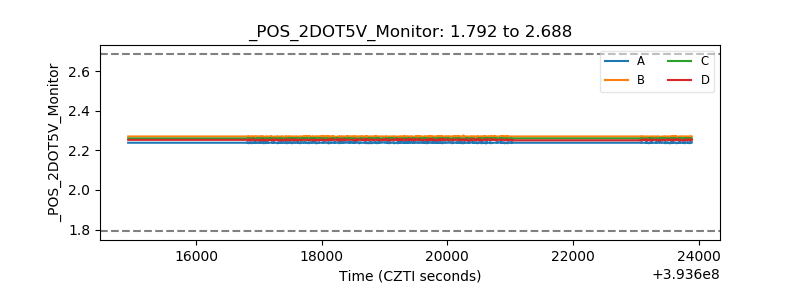 |
| +5 Volts monitor | 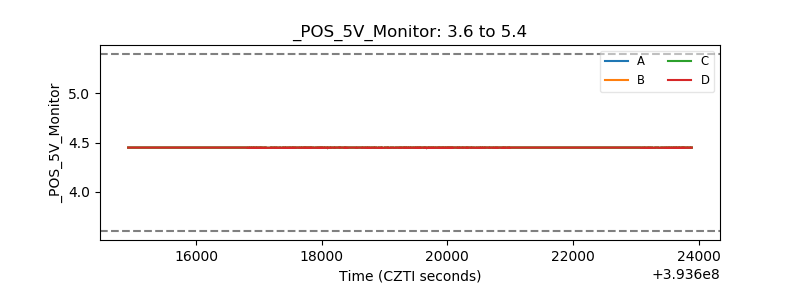 |
| _ROLL_ROT | 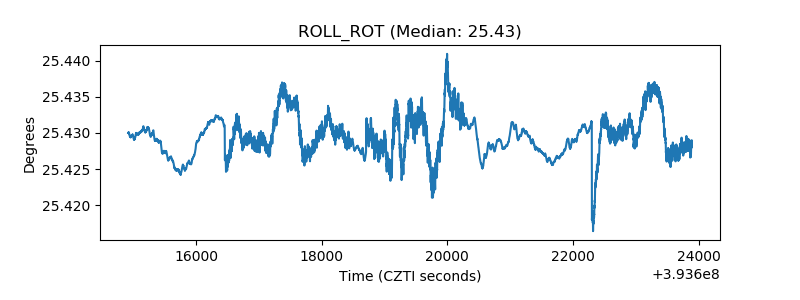 |
| _Roll_DEC | 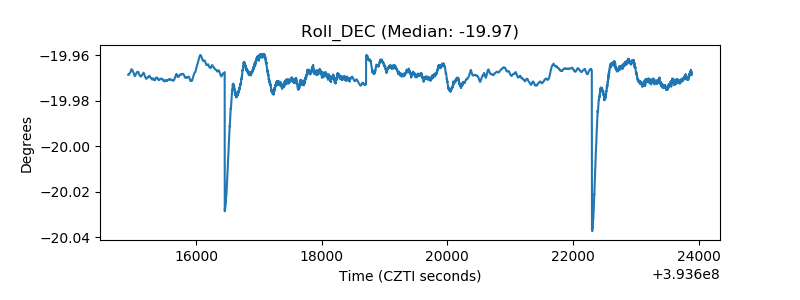 |
| _Roll_RA | 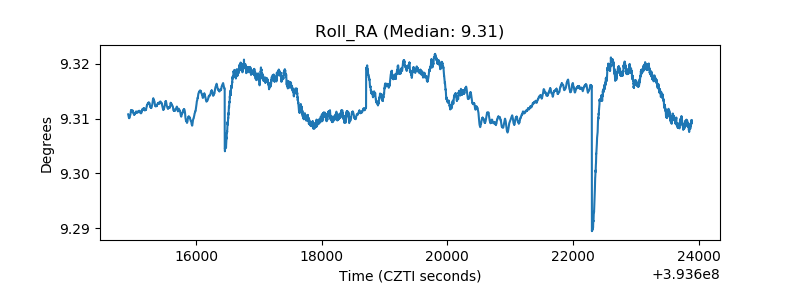 |
| Veto Counter |  |