| Param | Original file | Final file |
|---|---|---|
| Filename | modeM0/AS1T04_084T01_9000005198_36407cztM0_level2.evt | modeM0/AS1T04_084T01_9000005198_36407cztM0_level2_quad_clean.evt |
| Size (bytes) | 389,833,920 | 58,953,600 |
| Size | 371.8 MB | 56.2 MB |
| Events in quadrant A | 2,592,689 | 370,098 |
| Events in quadrant B | 3,267,505 | 366,992 |
| Events in quadrant C | 2,997,099 | 357,425 |
| Events in quadrant D | 2,615,664 | 346,523 |
| Mode M0 | |||
|---|---|---|---|
| Quadrant | BADHDUFLAG | Total packets | Discarded packets |
| A | 0 | 10624 | 3 |
| B | 0 | 12926 | 2 |
| C | 0 | 11678 | 2 |
| D | 0 | 10830 | 2 |
| Mode SS | |||
|---|---|---|---|
| Quadrant | BADHDUFLAG | Total packets | Discarded packets |
| A | 0 | 100 | 0 |
| B | 0 | 100 | 0 |
| C | 0 | 100 | 0 |
| D | 0 | 100 | 0 |
| Mode M9 | |||
|---|---|---|---|
| Quadrant | BADHDUFLAG | Total packets | Discarded packets |
| A | 0 | 30 | 0 |
| B | 0 | 30 | 0 |
| C | 0 | 30 | 0 |
| D | 0 | 31 | 0 |
| Quadrant | Total seconds | Saturated seconds | Saturation percentage |
|---|---|---|---|
| A | 4900 | 9 | 0.183673% |
| B | 4900 | 108 | 2.204082% |
| C | 4900 | 131 | 2.673469% |
| D | 4900 | 24 | 0.489796% |
Noise dominated data is calculated using 1-second bins in cleaned event files. If a bin has >2000 counts, and if more than 50% of those come from <1% of pixels, then it is considered to be noise-dominated and hence unusable.
| Quadrant | # 1 sec bins | Bins with >0 counts | Bins with >2000 counts | High rate bins dominated by noise | Noise dominated (total time) | Noise dominated (detector-on time) | Marked lightcurve |
|---|---|---|---|---|---|---|---|
| A | 7053 | 4901 | 0 | 0 | 0.00% | 0.00% | 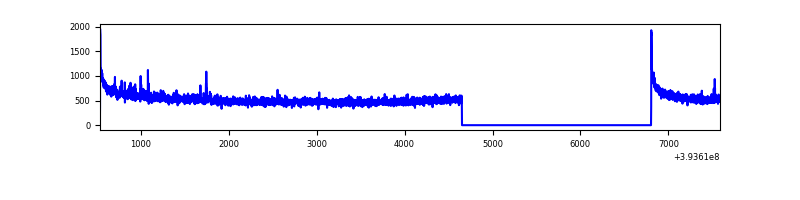 |
| B | 7053 | 4901 | 52 | 52 | 0.74% | 1.06% | 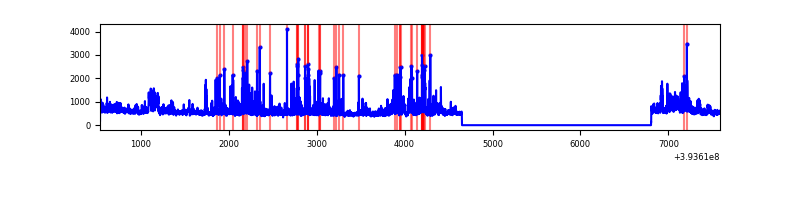 |
| C | 7053 | 4901 | 108 | 108 | 1.53% | 2.20% | 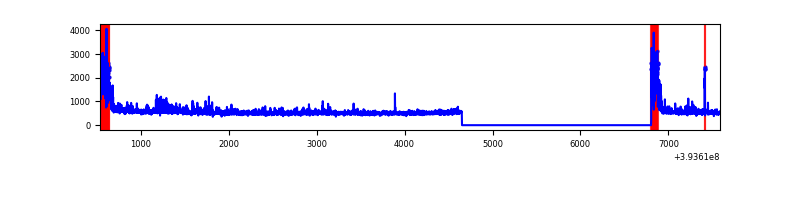 |
| D | 7053 | 4901 | 16 | 16 | 0.23% | 0.33% | 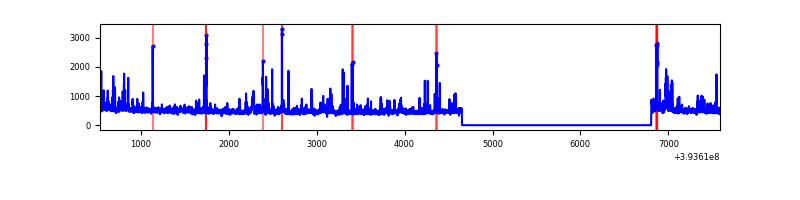 |
Top three noisy pixels from each quadrant. If the there are fewer than three noisy pixels in the level2.evt file, extra rows are filled as -1
| Pixel properties | Quadrant properties | ||||||
|---|---|---|---|---|---|---|---|
| Quadrant | DetID | PixID | Counts | Sigma | Mean | Median | Sigma |
| A | 10 | 83 | 182281 | 1475.47 | 615 | 605 | 123.1 |
| A | 7 | 16 | 11912 | 91.83 | 615 | 605 | 123.1 |
| A | 13 | 254 | 8939 | 67.68 | 615 | 605 | 123.1 |
| B | 5 | 255 | 228849 | 1947.9 | 610 | 595 | 117.2 |
| B | 5 | 172 | 204592 | 1740.89 | 610 | 595 | 117.2 |
| B | 0 | 189 | 137481 | 1168.17 | 610 | 595 | 117.2 |
| C | 0 | 10 | 477915 | 3520.05 | 588 | 593 | 135.6 |
| C | 15 | 214 | 208057 | 1529.96 | 588 | 593 | 135.6 |
| C | 15 | 159 | 11693 | 81.86 | 588 | 593 | 135.6 |
| D | 2 | 250 | 97447 | 661.98 | 595 | 580 | 146.3 |
| D | 12 | 6 | 75767 | 513.82 | 595 | 580 | 146.3 |
| D | 13 | 249 | 45193 | 304.88 | 595 | 580 | 146.3 |
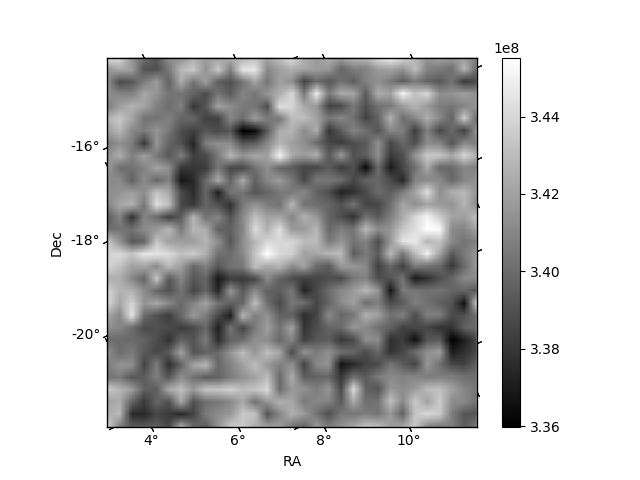
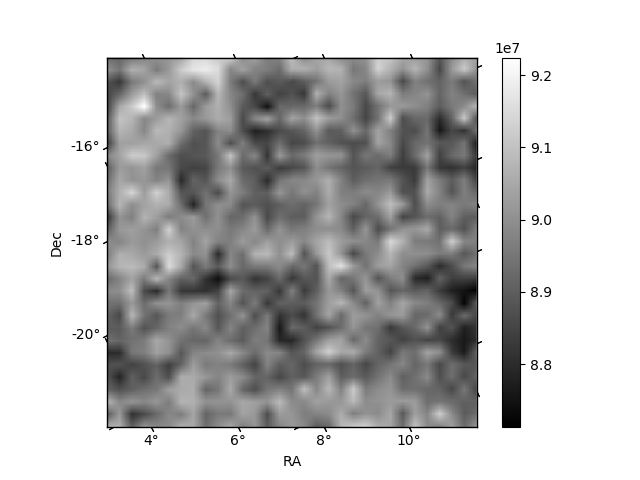
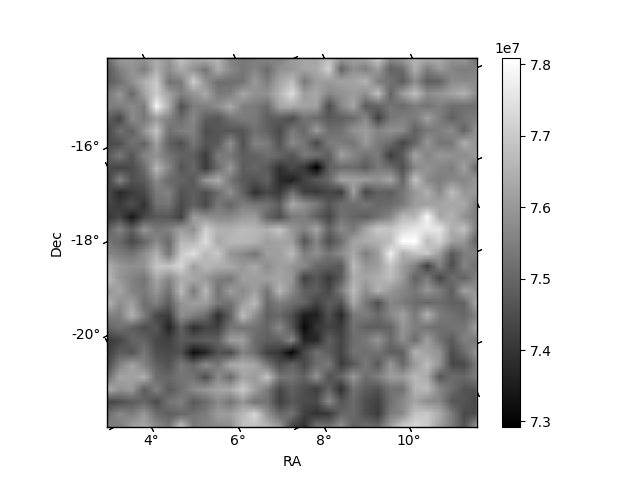
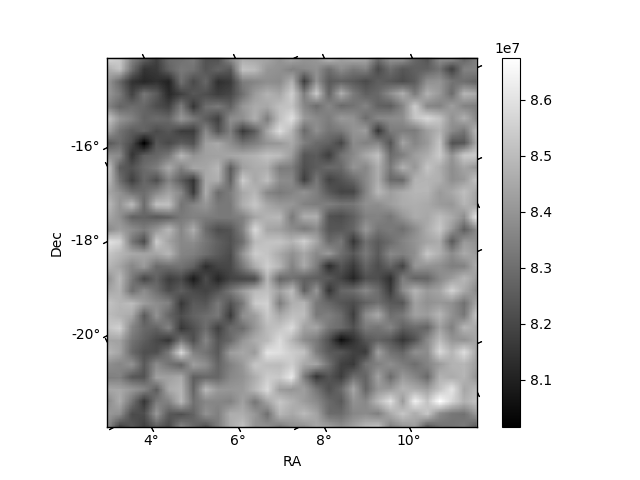
Histogram calculated using DETX and DETY for each event in the final _common_clean file
| Quadrant A | 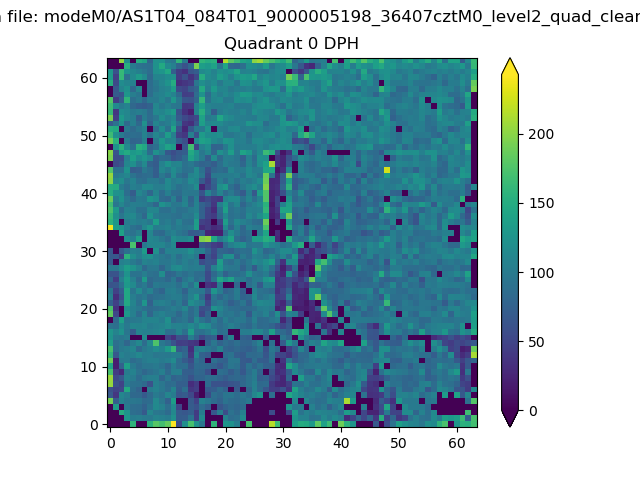 |
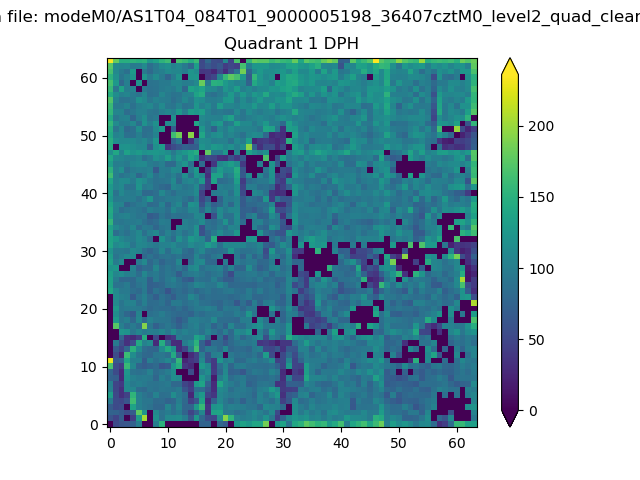 |
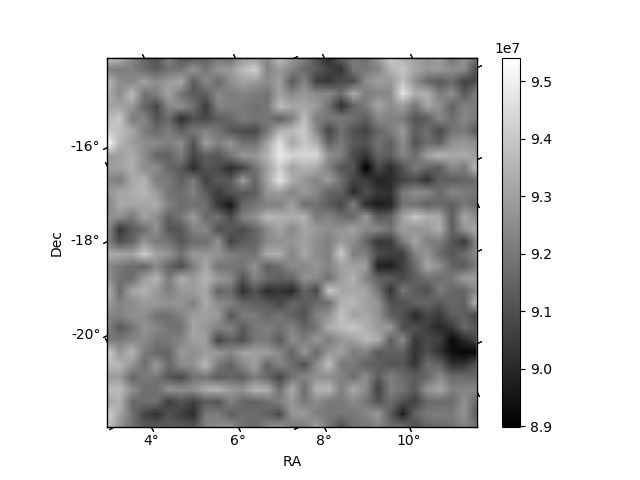
Quadrant B |
|---|---|---|---|
| Quadrant D | 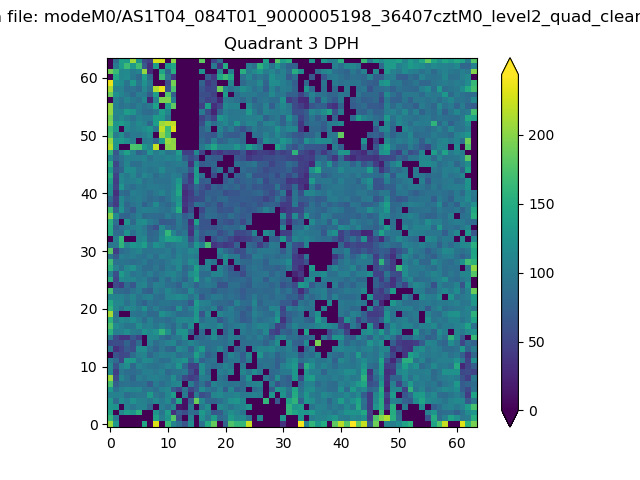 |
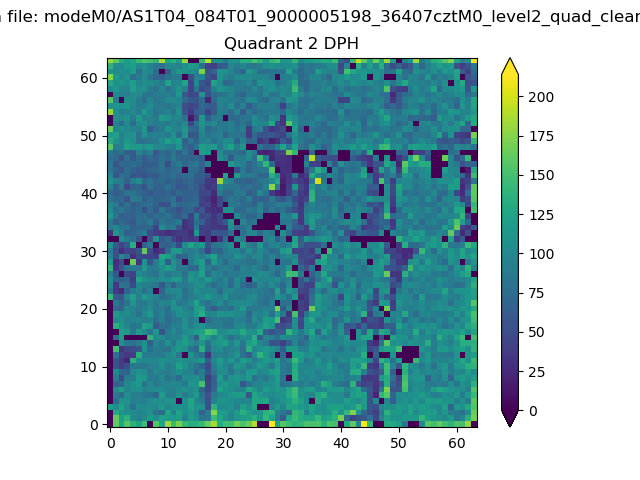 |
Quadrant C |
| Plot type | Count rate plots | Images |
|---|---|---|
| Comparison with Poisson distribution Blue bars denote a histogram of data divided into 1 sec bins. Red curve is a Poisson curve with rate = median count rate of data. |
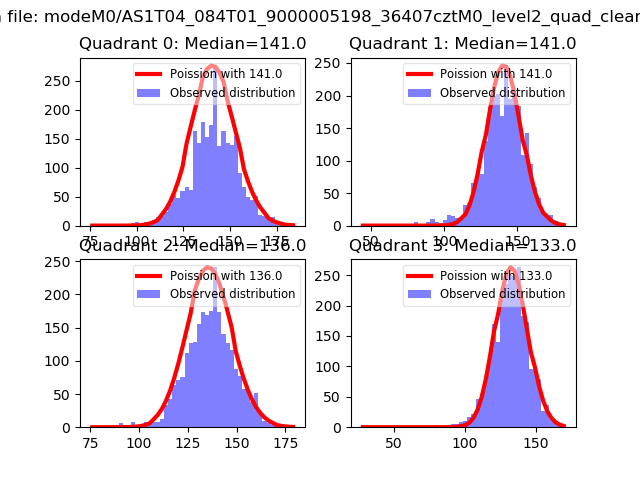 |
 |
| Quadrant-wise count rates Data is divided into 100 sec bins |
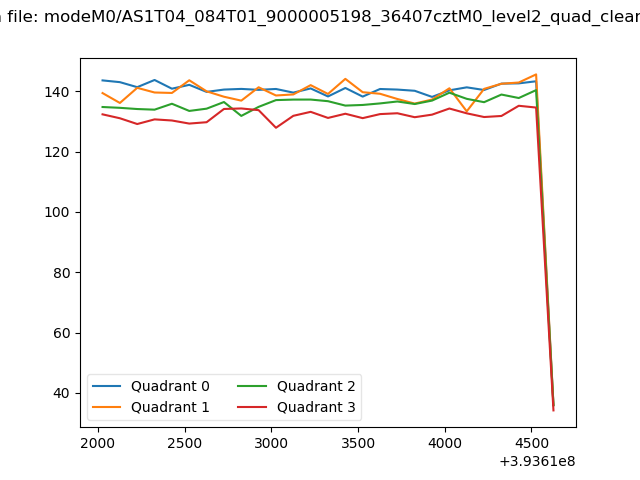 |
|
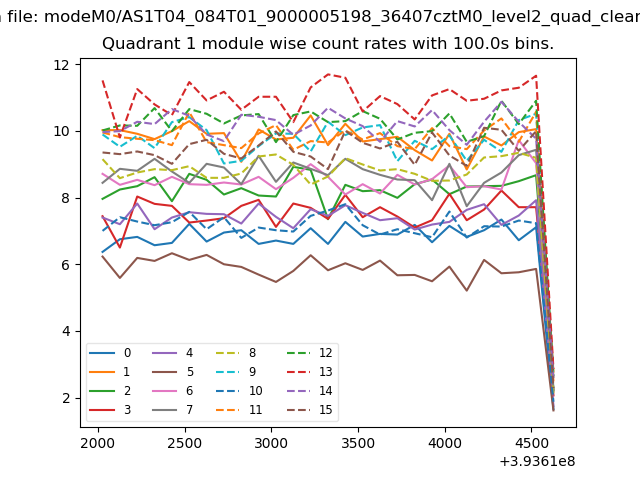
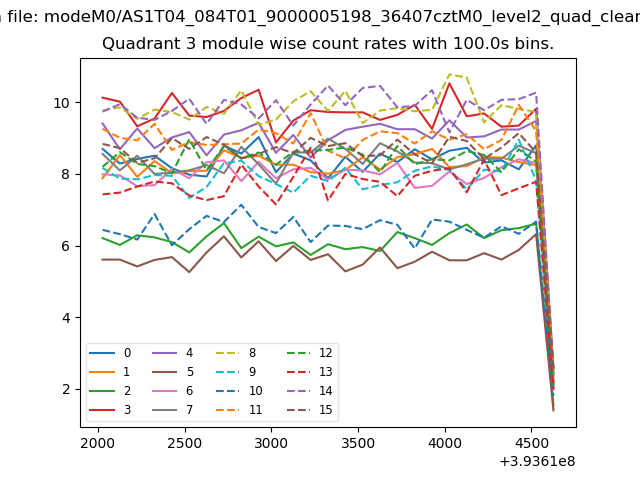
| Module-wise count rates for Quadrant A Data is divided into 100 sec bins |
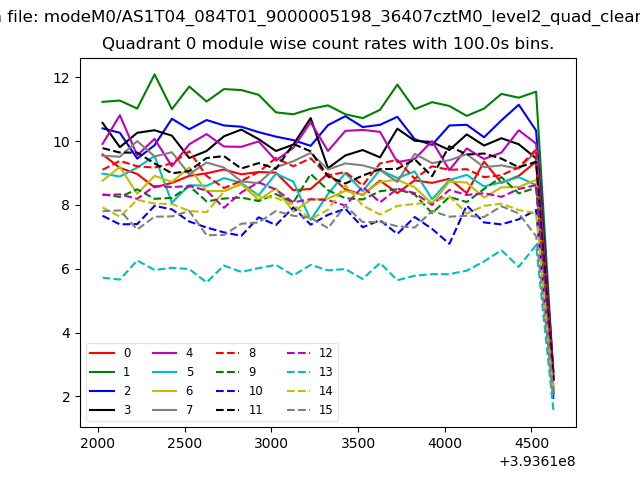 |
 |
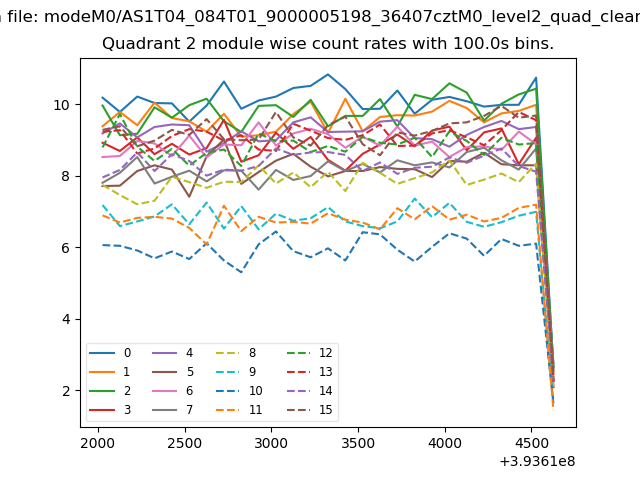
| Module-wise count rates for Quadrant B Data is divided into 100 sec bins |
 |
 |
| Module-wise count rates for Quadrant C Data is divided into 100 sec bins |
 |
 |
| Module-wise count rates for Quadrant D Data is divided into 100 sec bins |
 |
 |
| Parameter | Plot |
|---|---|
| CZT HV Monitor | 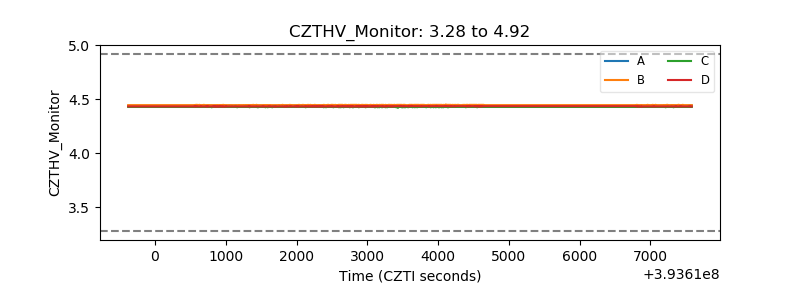 |
| D_VDD |  |
| Temperature 1 | 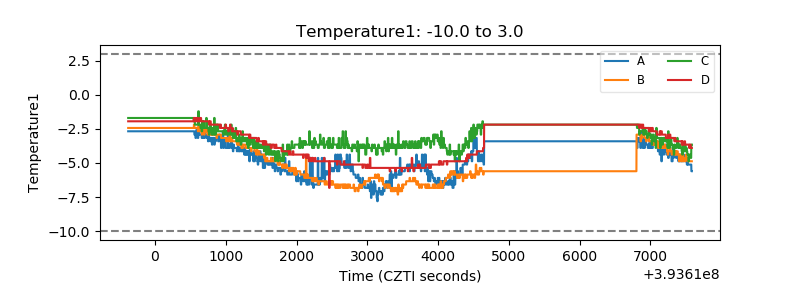 |
| Veto HV Monitor | 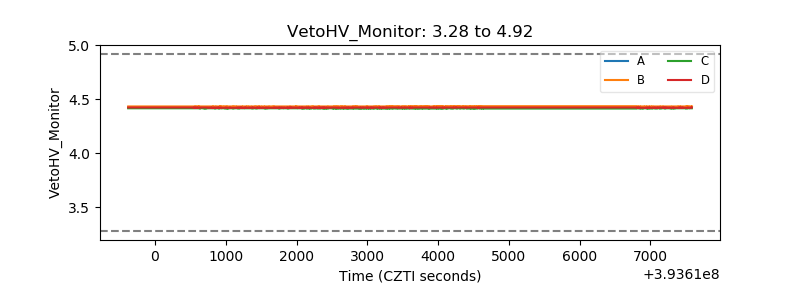 |
| Veto LLD | 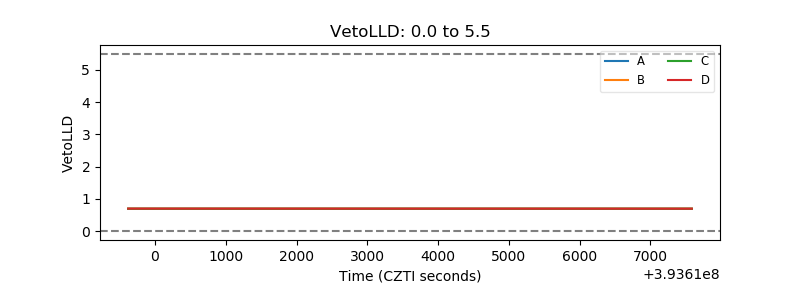 |
| Alpha Counter | 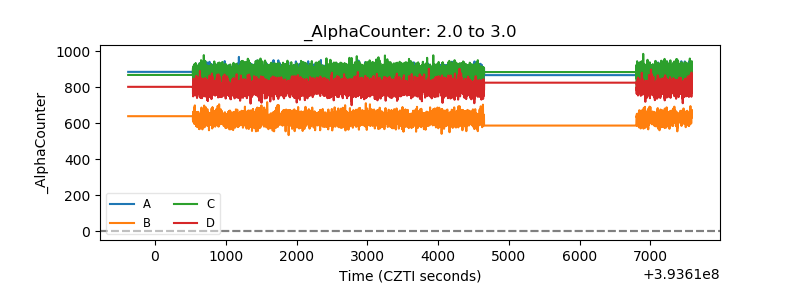 |
| _CPM_Rate | 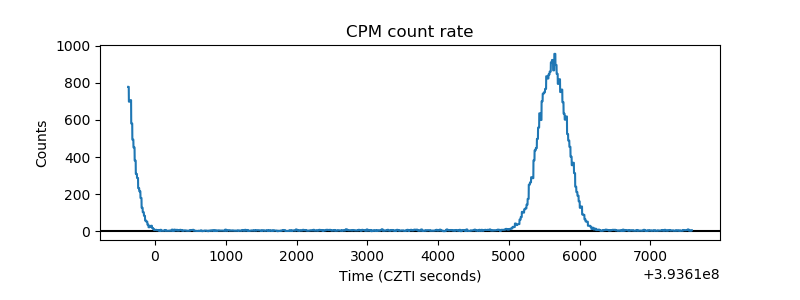 |
| CZT Counter | 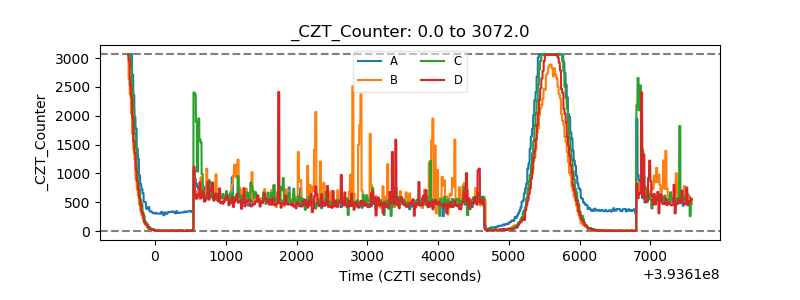 |
| +2.5 Volts monitor | 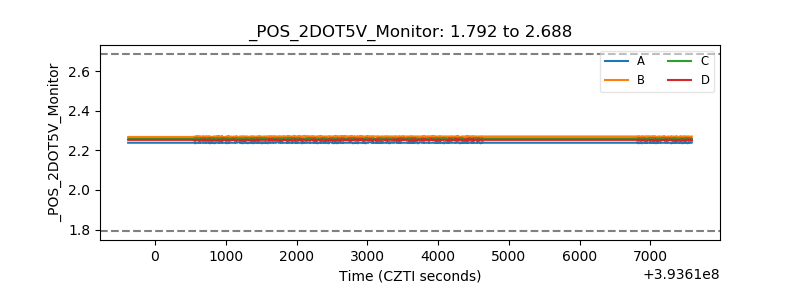 |
| +5 Volts monitor | 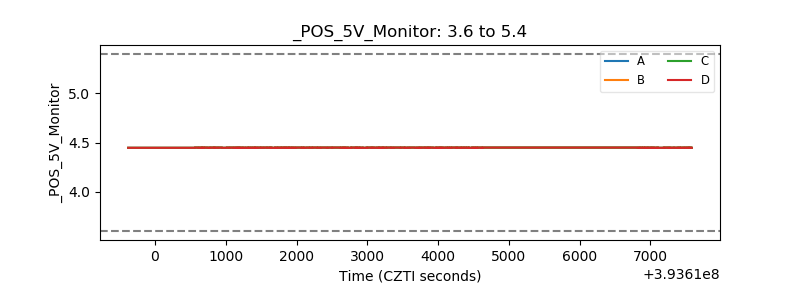 |
| _ROLL_ROT | 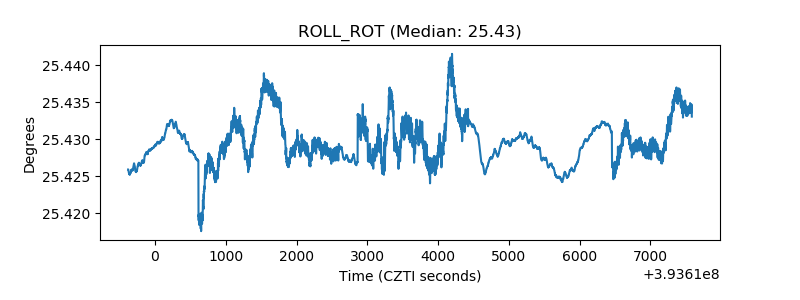 |
| _Roll_DEC | 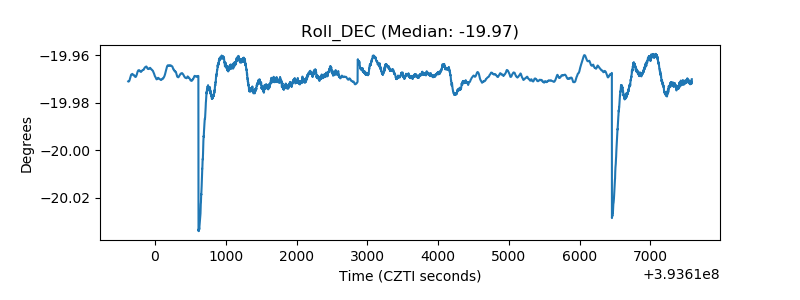 |
| _Roll_RA | 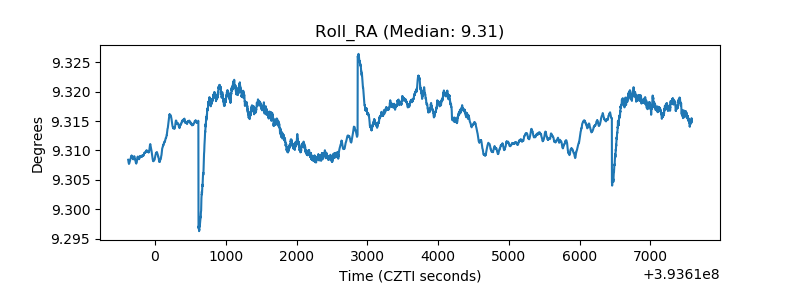 |
| Veto Counter | 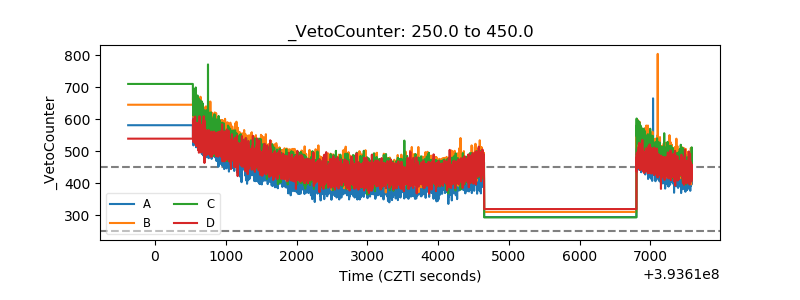 |