| Param | Original file | Final file |
|---|---|---|
| Filename | modeM0/AS1T04_084T01_9000005198_36406cztM0_level2.evt | modeM0/AS1T04_084T01_9000005198_36406cztM0_level2_quad_clean.evt |
| Size (bytes) | 425,782,080 | 52,335,360 |
| Size | 406.1 MB | 49.9 MB |
| Events in quadrant A | 2,766,774 | 320,177 |
| Events in quadrant B | 3,667,889 | 312,280 |
| Events in quadrant C | 2,938,519 | 308,261 |
| Events in quadrant D | 3,186,160 | 296,881 |
| Mode M0 | |||
|---|---|---|---|
| Quadrant | BADHDUFLAG | Total packets | Discarded packets |
| A | 0 | 11183 | 3 |
| B | 0 | 14054 | 2 |
| C | 0 | 11452 | 2 |
| D | 0 | 12528 | 2 |
| Mode SS | |||
|---|---|---|---|
| Quadrant | BADHDUFLAG | Total packets | Discarded packets |
| A | 0 | 98 | 0 |
| B | 0 | 98 | 0 |
| C | 0 | 98 | 0 |
| D | 0 | 98 | 0 |
| Mode M9 | |||
|---|---|---|---|
| Quadrant | BADHDUFLAG | Total packets | Discarded packets |
| A | 0 | 31 | 0 |
| B | 0 | 31 | 0 |
| C | 0 | 31 | 0 |
| D | 0 | 32 | 0 |
| Quadrant | Total seconds | Saturated seconds | Saturation percentage |
|---|---|---|---|
| A | 4952 | 11 | 0.222132% |
| B | 4952 | 298 | 6.017771% |
| C | 4952 | 89 | 1.797254% |
| D | 4952 | 103 | 2.079968% |
Noise dominated data is calculated using 1-second bins in cleaned event files. If a bin has >2000 counts, and if more than 50% of those come from <1% of pixels, then it is considered to be noise-dominated and hence unusable.
| Quadrant | # 1 sec bins | Bins with >0 counts | Bins with >2000 counts | High rate bins dominated by noise | Noise dominated (total time) | Noise dominated (detector-on time) | Marked lightcurve |
|---|---|---|---|---|---|---|---|
| A | 7075 | 4953 | 0 | 0 | 0.00% | 0.00% | 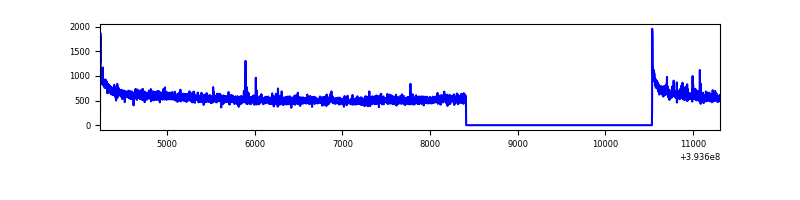 |
| B | 7075 | 4953 | 175 | 175 | 2.47% | 3.53% | 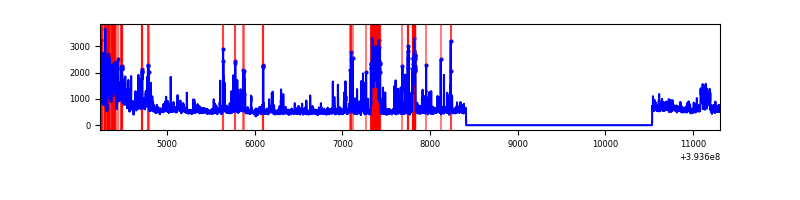 |
| C | 7075 | 4953 | 68 | 68 | 0.96% | 1.37% | 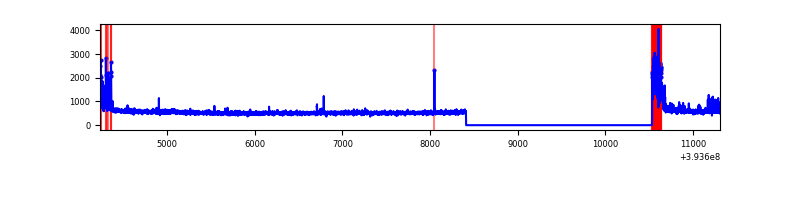 |
| D | 7075 | 4953 | 76 | 76 | 1.07% | 1.53% | 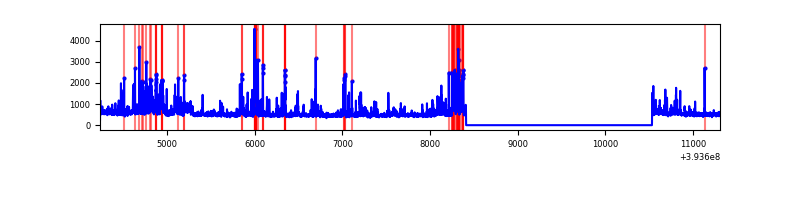 |
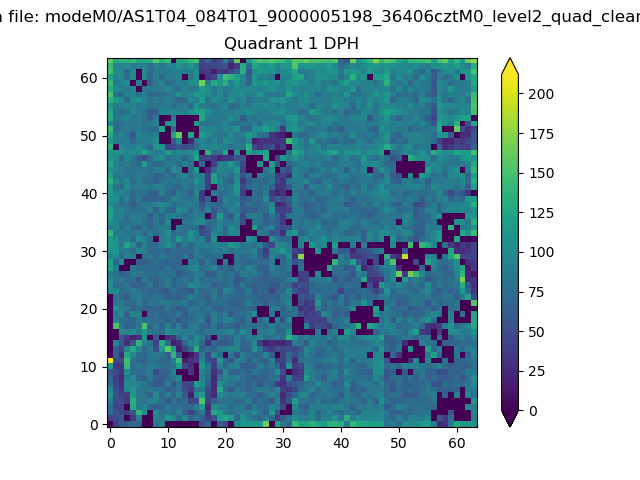
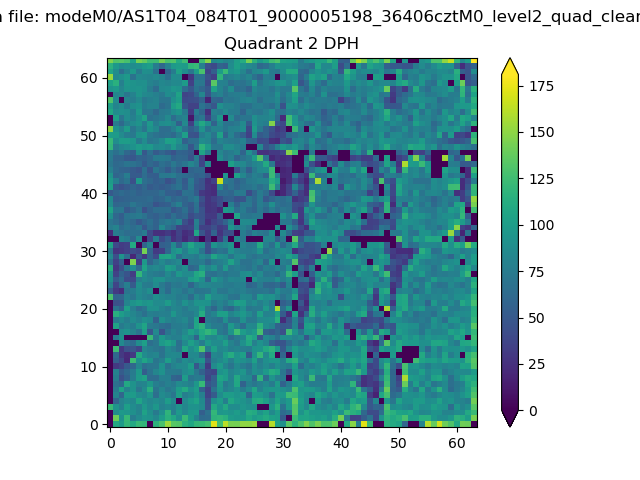
Top three noisy pixels from each quadrant. If the there are fewer than three noisy pixels in the level2.evt file, extra rows are filled as -1
| Pixel properties | Quadrant properties | ||||||
|---|---|---|---|---|---|---|---|
| Quadrant | DetID | PixID | Counts | Sigma | Mean | Median | Sigma |
| A | 10 | 83 | 182624 | 1401.44 | 646 | 636 | 129.9 |
| A | 15 | 223 | 67679 | 516.28 | 646 | 636 | 129.9 |
| A | 7 | 16 | 10773 | 78.06 | 646 | 636 | 129.9 |
| B | 5 | 172 | 708480 | 5988.32 | 629 | 615 | 118.2 |
| B | 0 | 189 | 163451 | 1377.54 | 629 | 615 | 118.2 |
| B | 5 | 255 | 124722 | 1049.91 | 629 | 615 | 118.2 |
| C | 0 | 10 | 315583 | 2217.73 | 616 | 621 | 142.0 |
| C | 15 | 214 | 212336 | 1490.74 | 616 | 621 | 142.0 |
| C | 15 | 159 | 8285 | 53.96 | 616 | 621 | 142.0 |
| D | 13 | 171 | 230112 | 1525.52 | 622 | 607 | 150.4 |
| D | 2 | 250 | 148631 | 983.92 | 622 | 607 | 150.4 |
| D | 2 | 249 | 100361 | 663.06 | 622 | 607 | 150.4 |
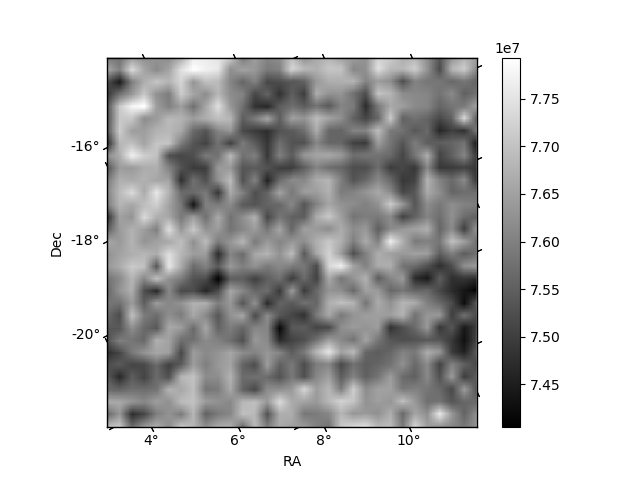
Histogram calculated using DETX and DETY for each event in the final _common_clean file
| Quadrant A | 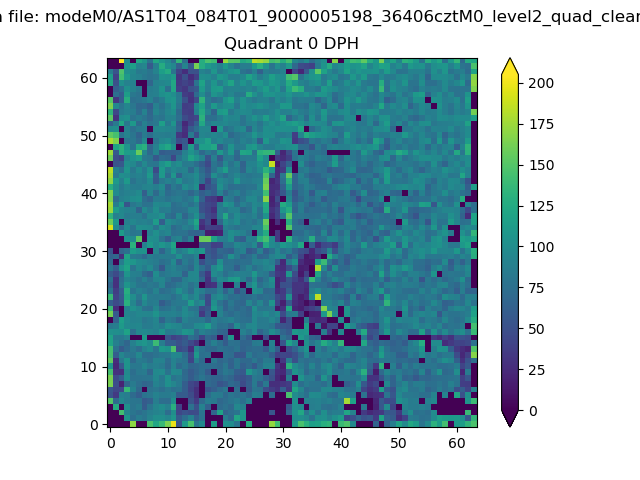 |
 |
Quadrant B |
|---|---|---|---|
| Quadrant D | 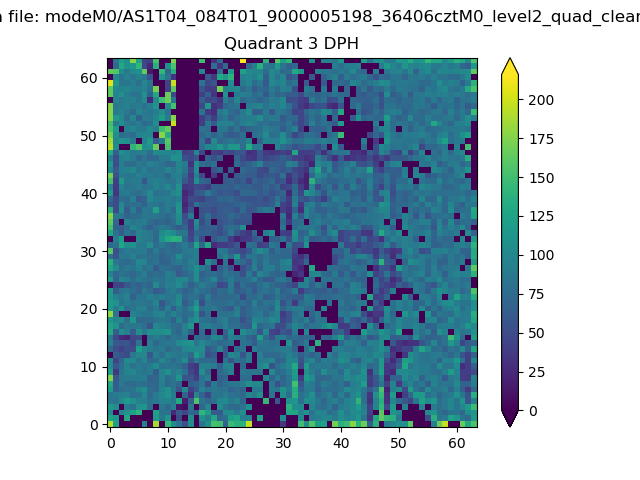 |
 |
Quadrant C |
| Plot type | Count rate plots | Images |
|---|---|---|
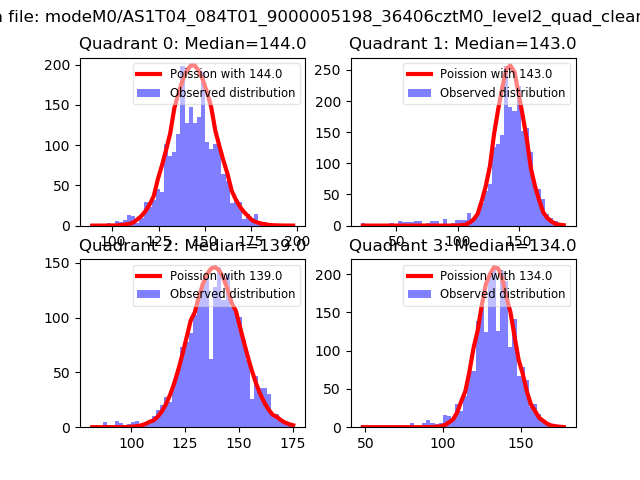
| Comparison with Poisson distribution Blue bars denote a histogram of data divided into 1 sec bins. Red curve is a Poisson curve with rate = median count rate of data. |
 |
 |
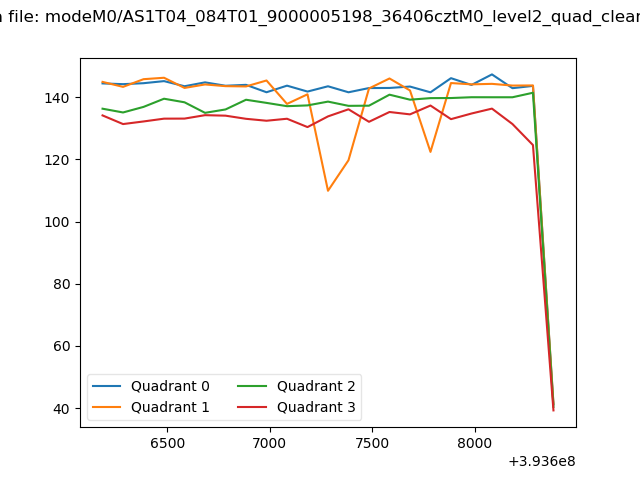
| Quadrant-wise count rates Data is divided into 100 sec bins |
 |
|
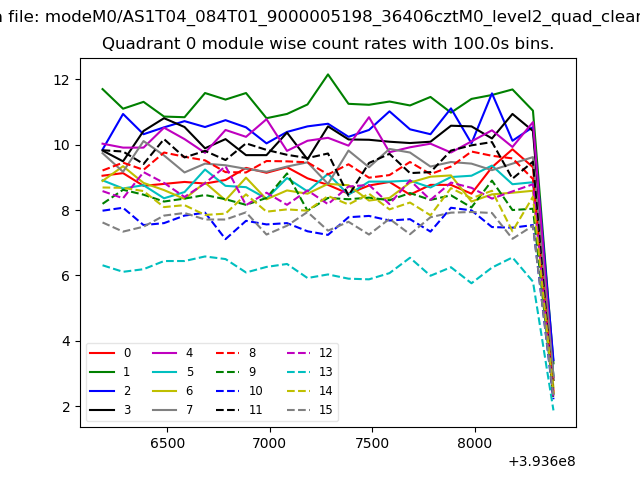
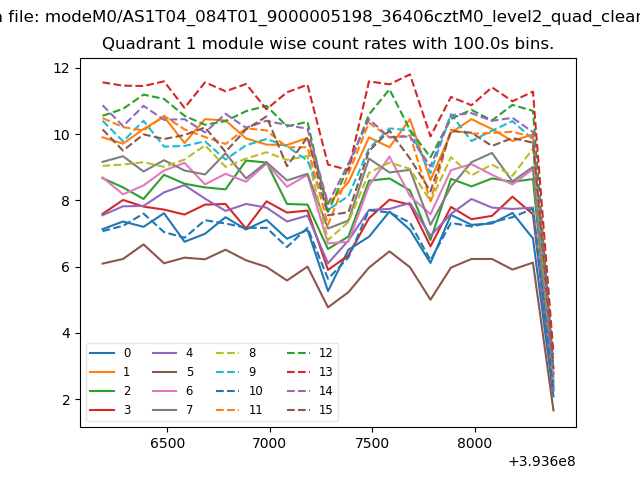
| Module-wise count rates for Quadrant A Data is divided into 100 sec bins |
 |
 |
| Module-wise count rates for Quadrant B Data is divided into 100 sec bins |
 |
 |
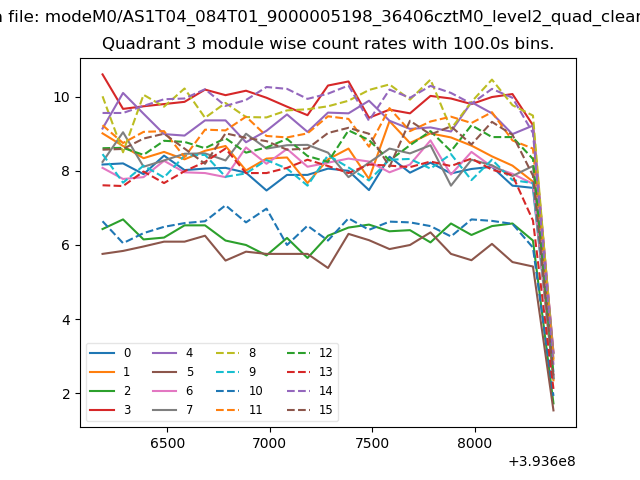
| Module-wise count rates for Quadrant C Data is divided into 100 sec bins |
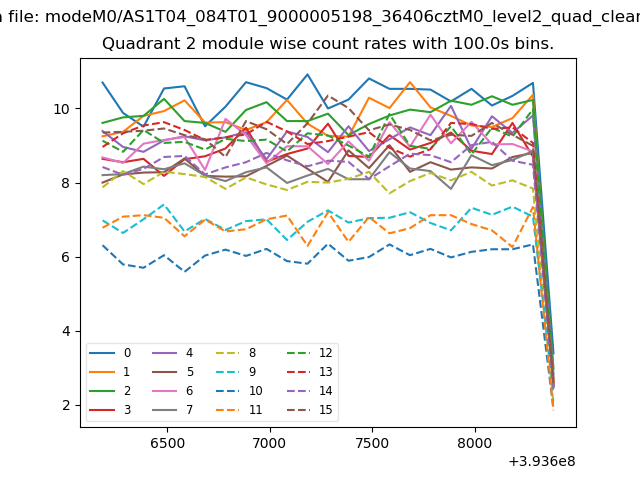 |
 |
| Module-wise count rates for Quadrant D Data is divided into 100 sec bins |
 |
 |
| Parameter | Plot |
|---|---|
| CZT HV Monitor | 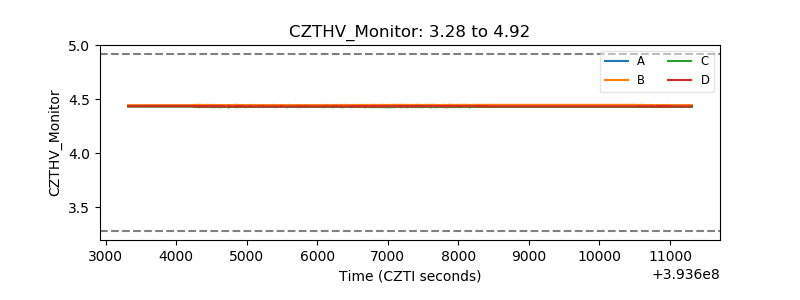 |
| D_VDD | 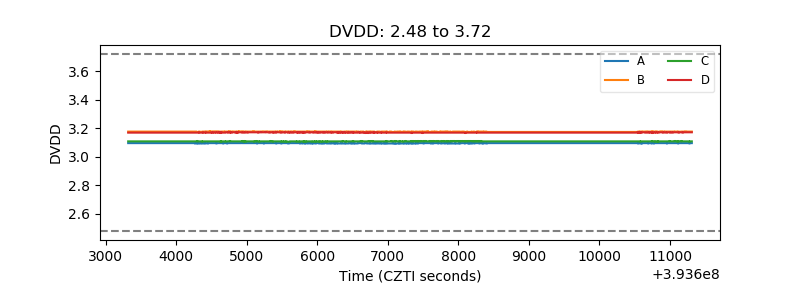 |
| Temperature 1 | 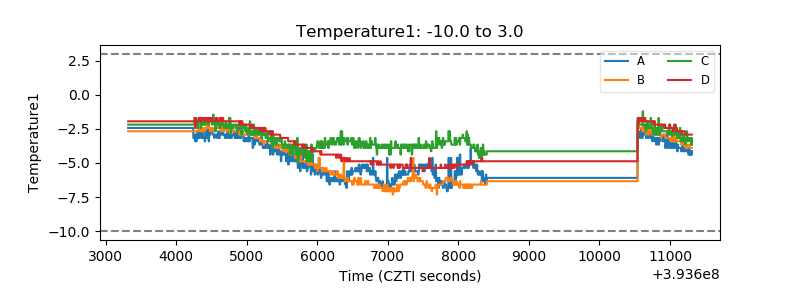 |
| Veto HV Monitor | 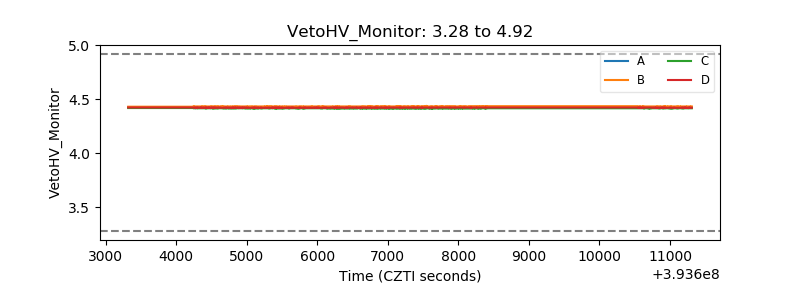 |
| Veto LLD | 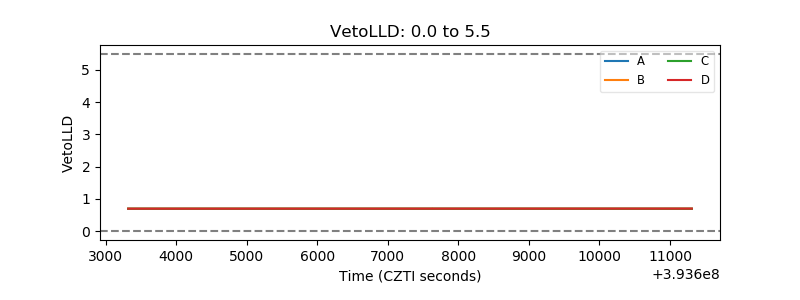 |
| Alpha Counter | 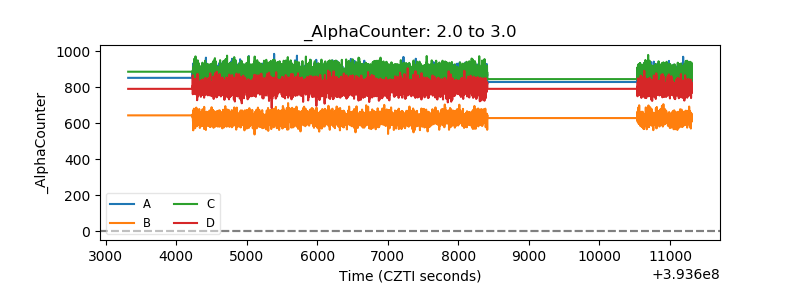 |
| _CPM_Rate | 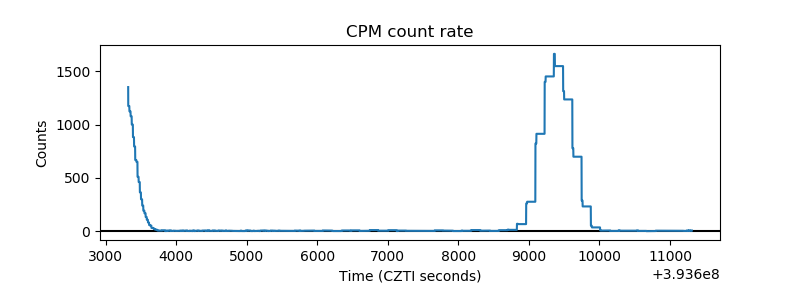 |
| CZT Counter | 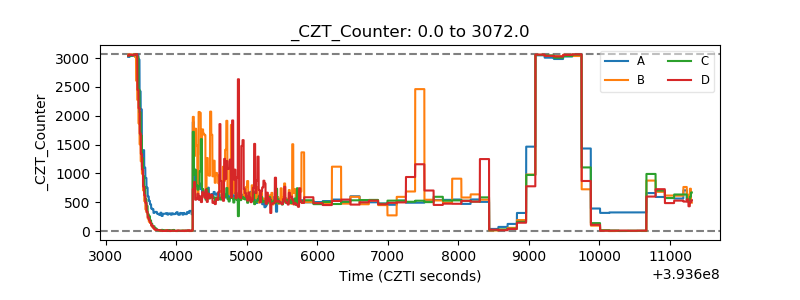 |
| +2.5 Volts monitor | 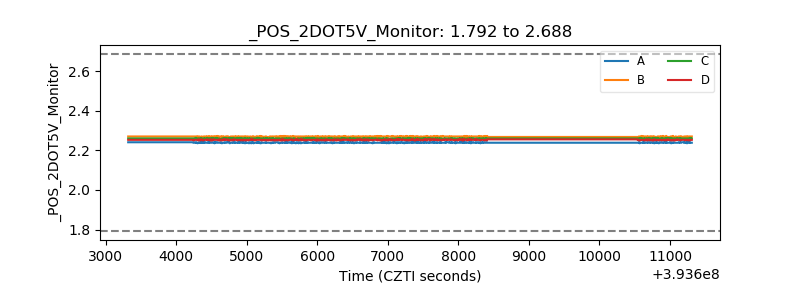 |
| +5 Volts monitor | 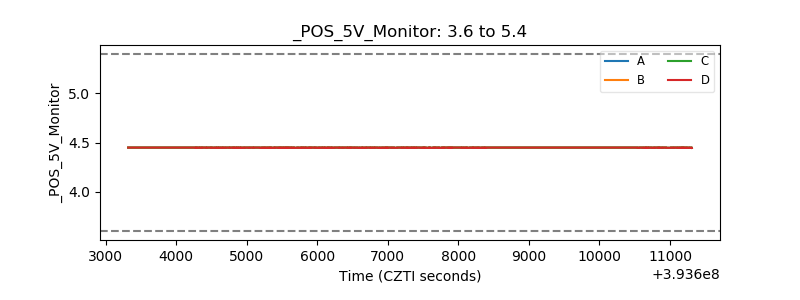 |
| _ROLL_ROT | 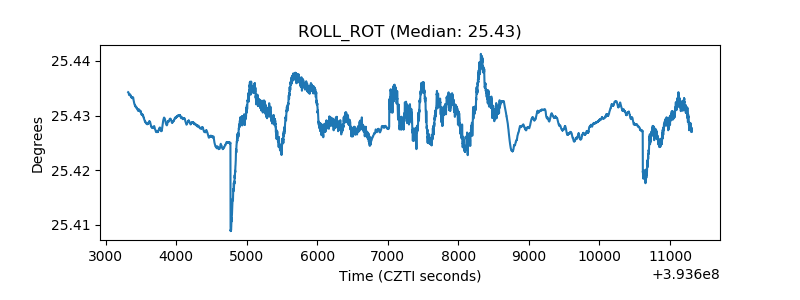 |
| _Roll_DEC | 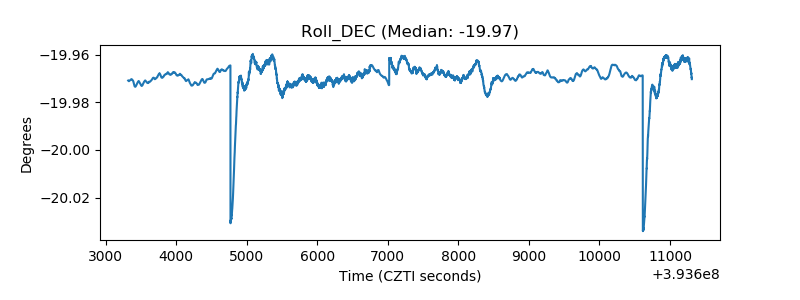 |
| _Roll_RA | 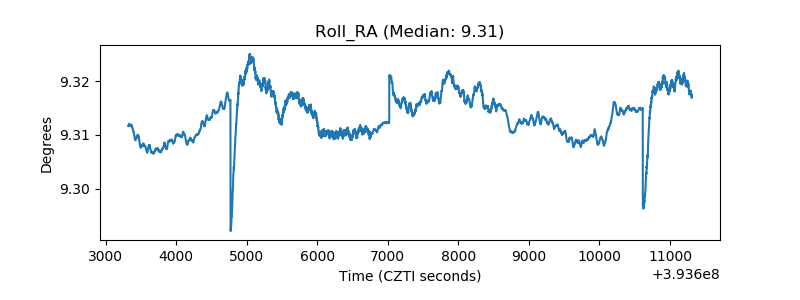 |
| Veto Counter | 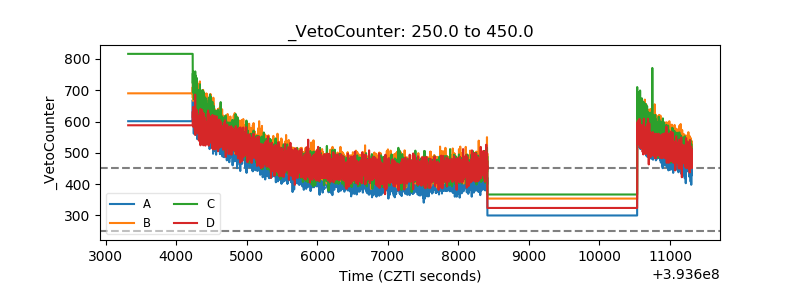 |