| Param | Original file | Final file |
|---|---|---|
| Filename | modeM0/AS1T04_084T01_9000005198_36404cztM0_level2.evt | modeM0/AS1T04_084T01_9000005198_36404cztM0_level2_quad_clean.evt |
| Size (bytes) | 459,146,880 | 51,459,840 |
| Size | 437.9 MB | 49.1 MB |
| Events in quadrant A | 2,952,254 | 307,018 |
| Events in quadrant B | 3,589,095 | 308,055 |
| Events in quadrant C | 3,130,549 | 290,887 |
| Events in quadrant D | 3,870,032 | 276,765 |
| Mode M0 | |||
|---|---|---|---|
| Quadrant | BADHDUFLAG | Total packets | Discarded packets |
| A | 0 | 12002 | 3 |
| B | 0 | 14049 | 2 |
| C | 0 | 12273 | 2 |
| D | 0 | 14909 | 2 |
| Mode SS | |||
|---|---|---|---|
| Quadrant | BADHDUFLAG | Total packets | Discarded packets |
| A | 0 | 108 | 0 |
| B | 0 | 108 | 0 |
| C | 0 | 108 | 0 |
| D | 0 | 108 | 0 |
| Mode M9 | |||
|---|---|---|---|
| Quadrant | BADHDUFLAG | Total packets | Discarded packets |
| A | 0 | 26 | 0 |
| B | 0 | 26 | 0 |
| C | 0 | 26 | 0 |
| D | 0 | 27 | 0 |
| Quadrant | Total seconds | Saturated seconds | Saturation percentage |
|---|---|---|---|
| A | 5359 | 12 | 0.223922% |
| B | 5359 | 184 | 3.433476% |
| C | 5359 | 124 | 2.313865% |
| D | 5359 | 272 | 5.075574% |
Noise dominated data is calculated using 1-second bins in cleaned event files. If a bin has >2000 counts, and if more than 50% of those come from <1% of pixels, then it is considered to be noise-dominated and hence unusable.
| Quadrant | # 1 sec bins | Bins with >0 counts | Bins with >2000 counts | High rate bins dominated by noise | Noise dominated (total time) | Noise dominated (detector-on time) | Marked lightcurve |
|---|---|---|---|---|---|---|---|
| A | 7273 | 5360 | 0 | 0 | 0.00% | 0.00% | 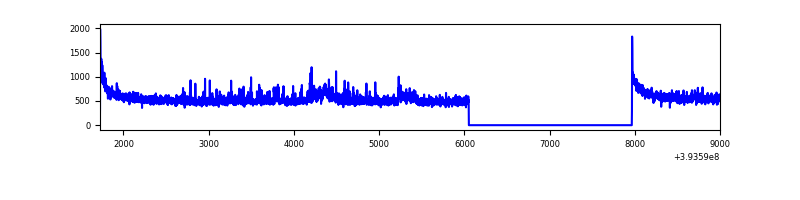 |
| B | 7273 | 5360 | 115 | 115 | 1.58% | 2.15% | 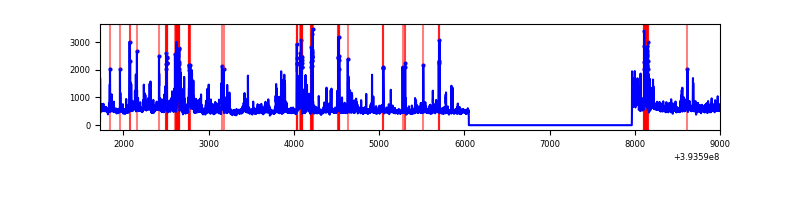 |
| C | 7273 | 5360 | 92 | 92 | 1.26% | 1.72% | 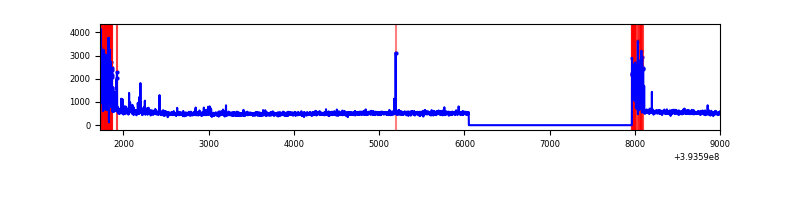 |
| D | 7273 | 5360 | 241 | 241 | 3.31% | 4.50% | 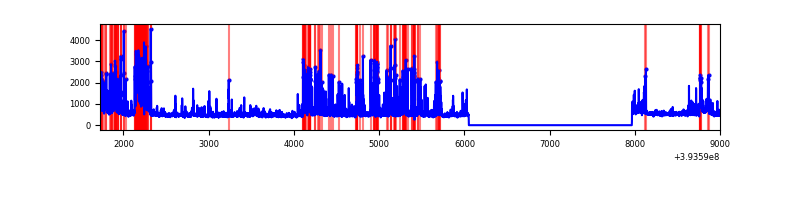 |
Top three noisy pixels from each quadrant. If the there are fewer than three noisy pixels in the level2.evt file, extra rows are filled as -1
| Pixel properties | Quadrant properties | ||||||
|---|---|---|---|---|---|---|---|
| Quadrant | DetID | PixID | Counts | Sigma | Mean | Median | Sigma |
| A | 10 | 83 | 190188 | 1388.14 | 677 | 666 | 136.5 |
| A | 15 | 223 | 111269 | 810.11 | 677 | 666 | 136.5 |
| A | 12 | 189 | 22239 | 158.01 | 677 | 666 | 136.5 |
| B | 5 | 172 | 523935 | 4179.41 | 658 | 642 | 125.2 |
| B | 0 | 189 | 181593 | 1445.21 | 658 | 642 | 125.2 |
| B | 0 | 245 | 99121 | 786.53 | 658 | 642 | 125.2 |
| C | 0 | 10 | 404725 | 2747.68 | 638 | 643 | 147.1 |
| C | 15 | 214 | 226448 | 1535.43 | 638 | 643 | 147.1 |
| C | 1 | 241 | 6876 | 42.38 | 638 | 643 | 147.1 |
| D | 12 | 6 | 898512 | 5719.12 | 645 | 629 | 157.0 |
| D | 2 | 250 | 139059 | 881.74 | 645 | 629 | 157.0 |
| D | 13 | 249 | 65068 | 410.45 | 645 | 629 | 157.0 |
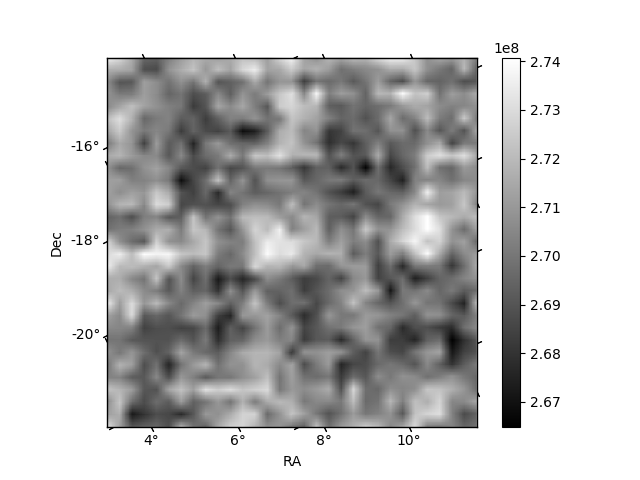
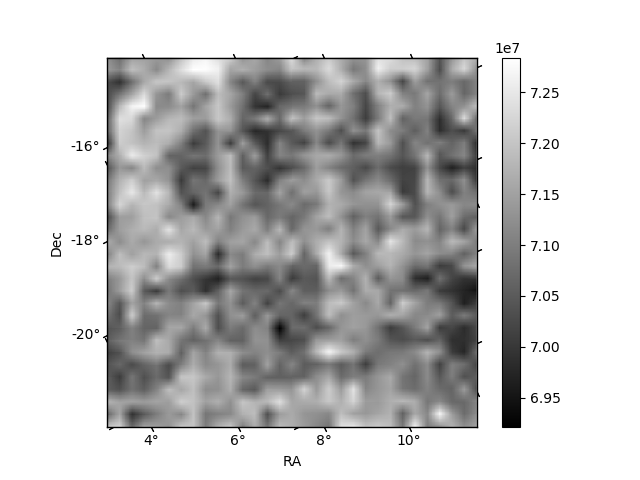
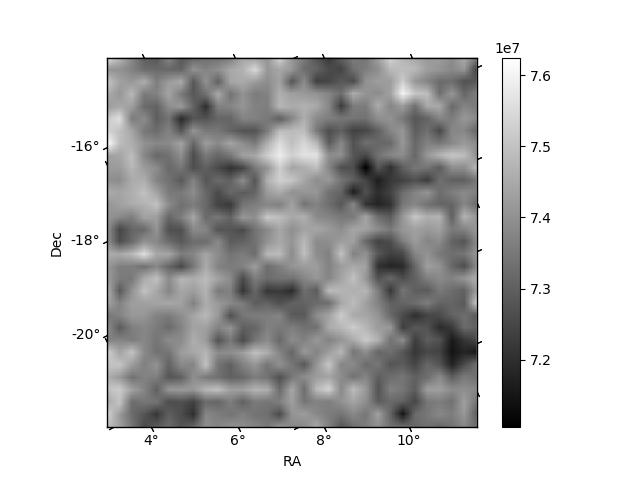
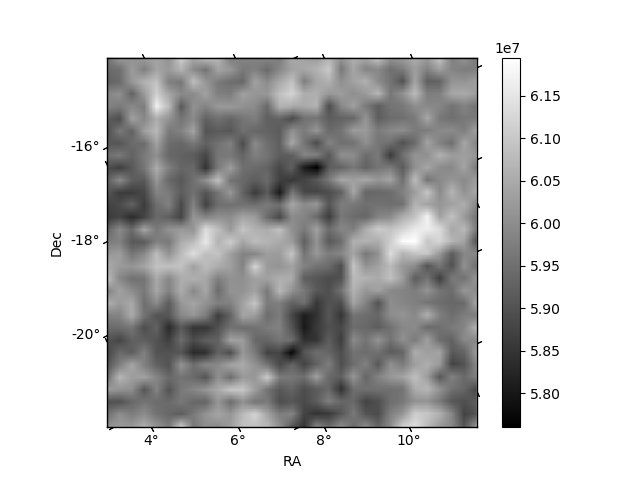
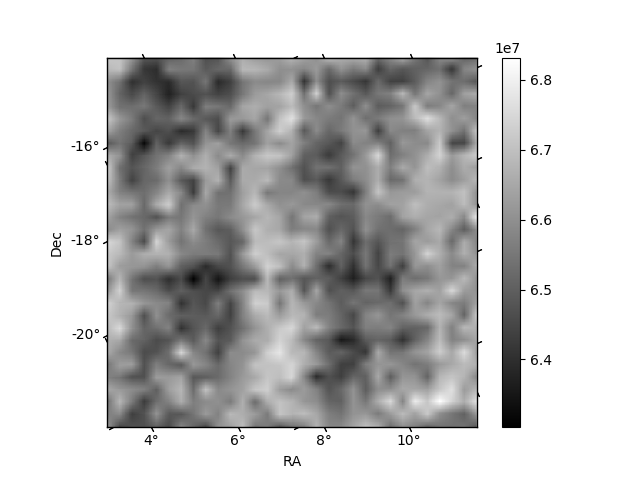
Histogram calculated using DETX and DETY for each event in the final _common_clean file
| Quadrant A | 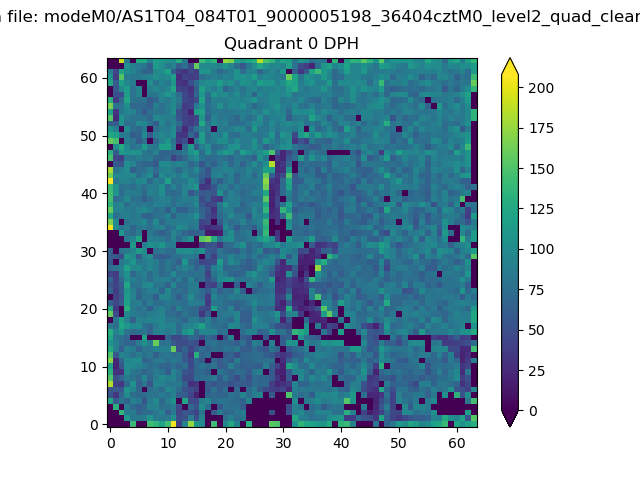 |
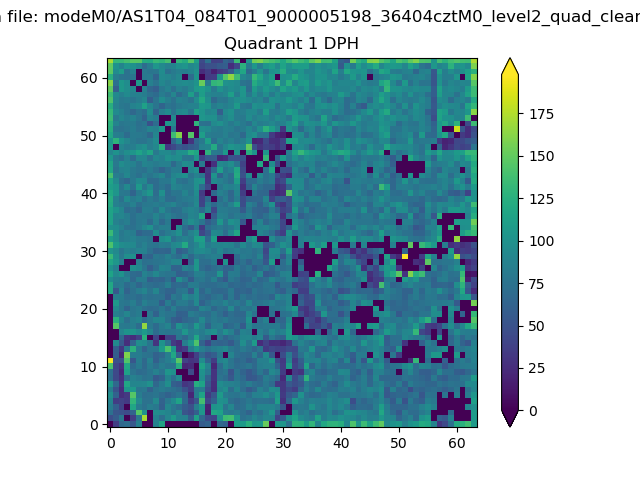 |
Quadrant B |
|---|---|---|---|
| Quadrant D | 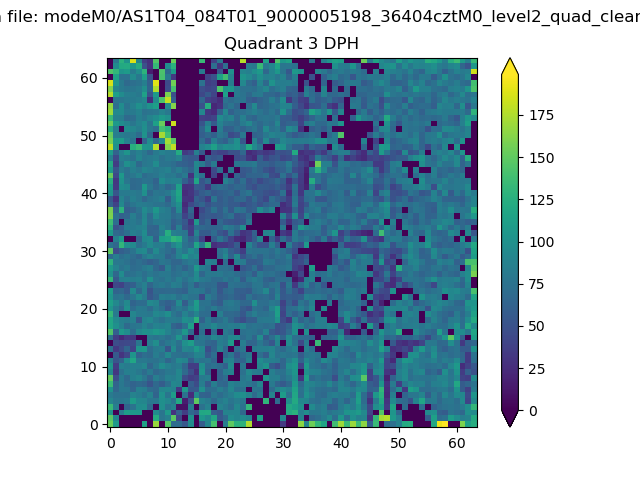 |
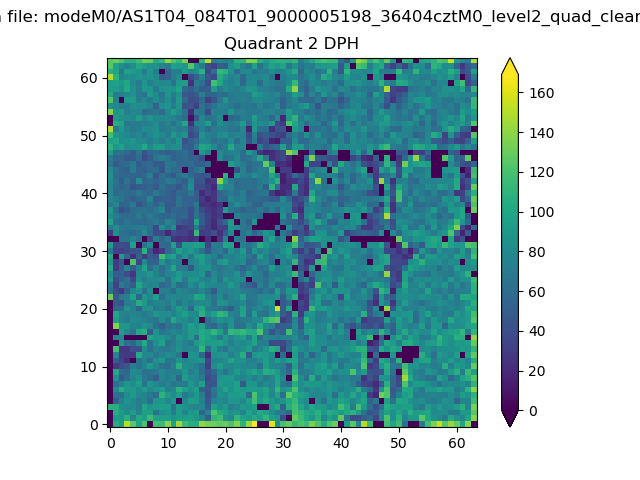 |
Quadrant C |
| Plot type | Count rate plots | Images |
|---|---|---|
| Comparison with Poisson distribution Blue bars denote a histogram of data divided into 1 sec bins. Red curve is a Poisson curve with rate = median count rate of data. |
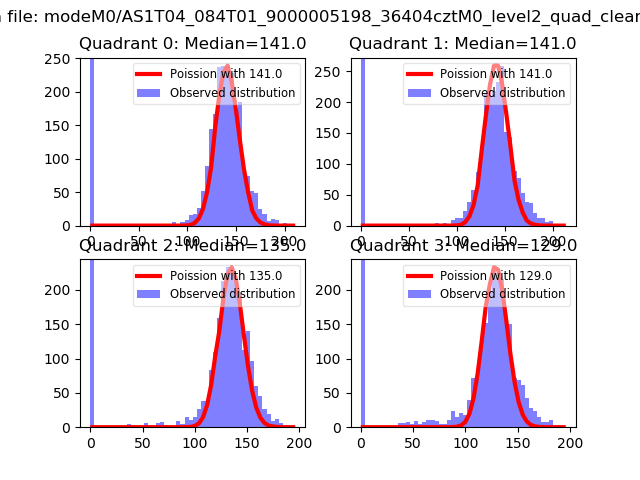 |
 |
| Quadrant-wise count rates Data is divided into 100 sec bins |
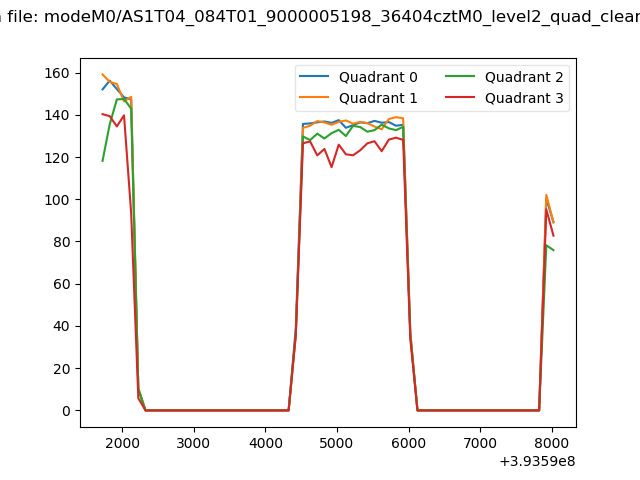 |
|
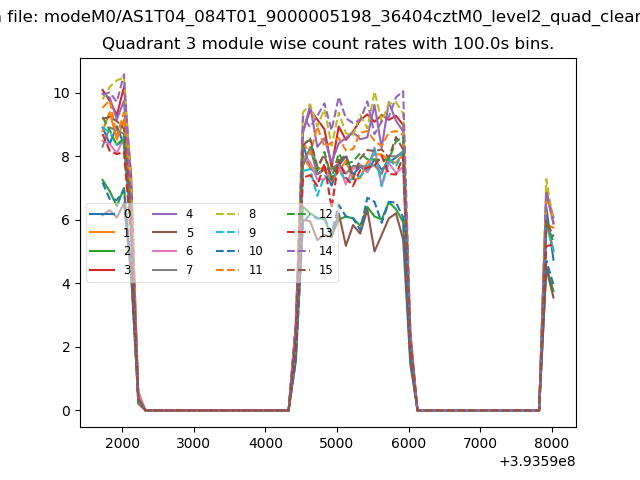
| Module-wise count rates for Quadrant A Data is divided into 100 sec bins |
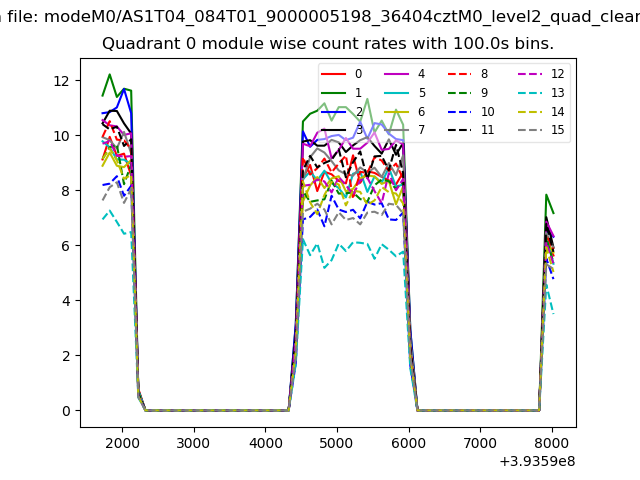 |
 |
| Module-wise count rates for Quadrant B Data is divided into 100 sec bins |
 |
 |
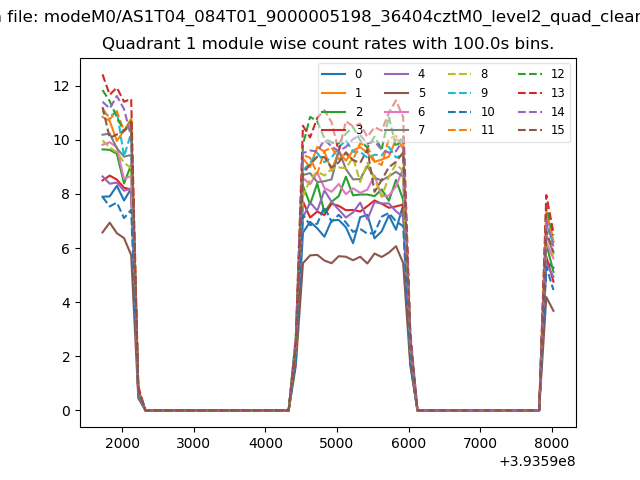
| Module-wise count rates for Quadrant C Data is divided into 100 sec bins |
 |
 |
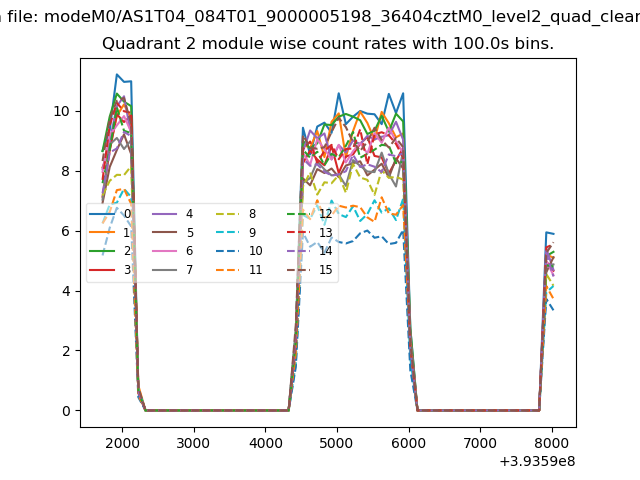
| Module-wise count rates for Quadrant D Data is divided into 100 sec bins |
 |
 |
| Parameter | Plot |
|---|---|
| CZT HV Monitor | 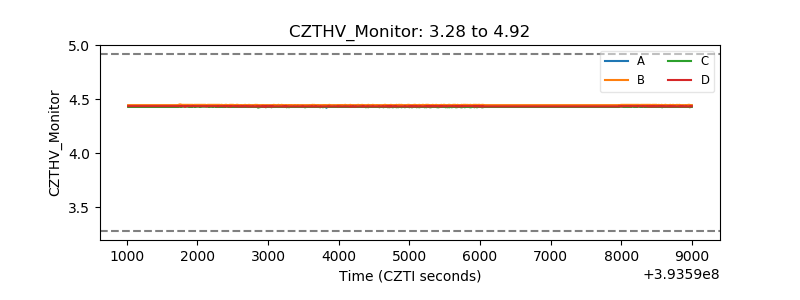 |
| D_VDD | 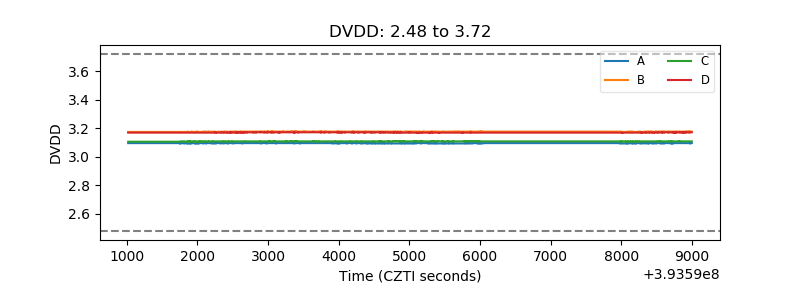 |
| Temperature 1 | 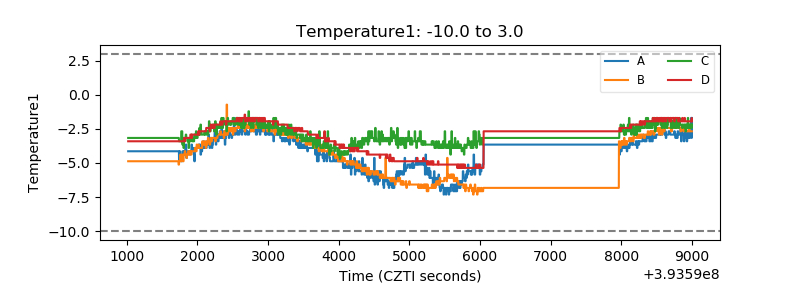 |
| Veto HV Monitor |  |
| Veto LLD | 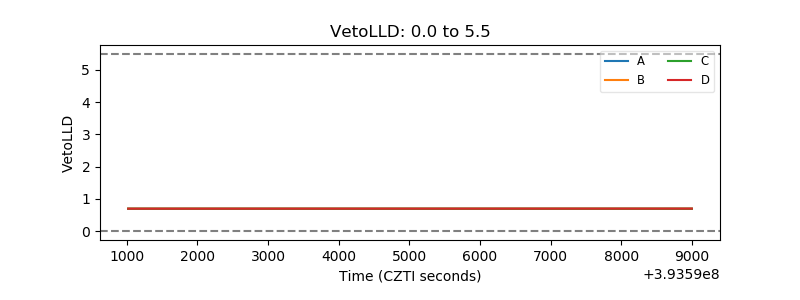 |
| Alpha Counter | 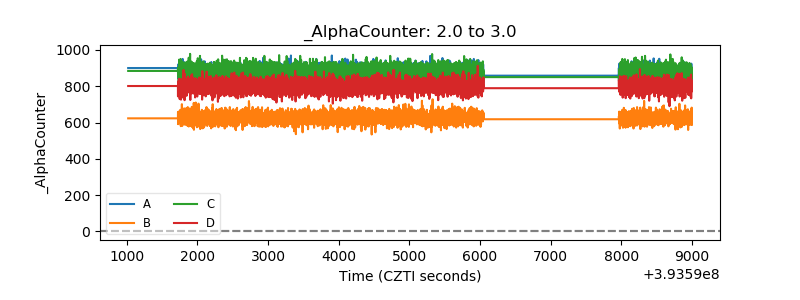 |
| _CPM_Rate | 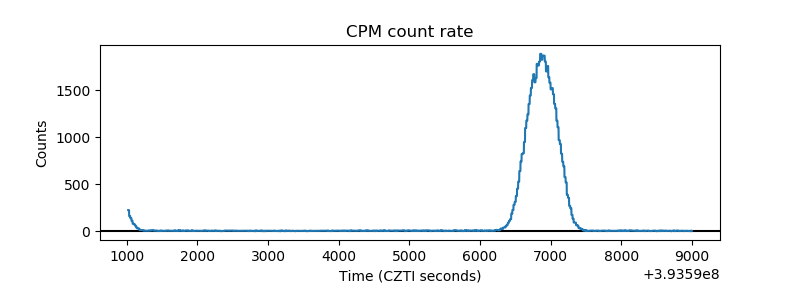 |
| CZT Counter | 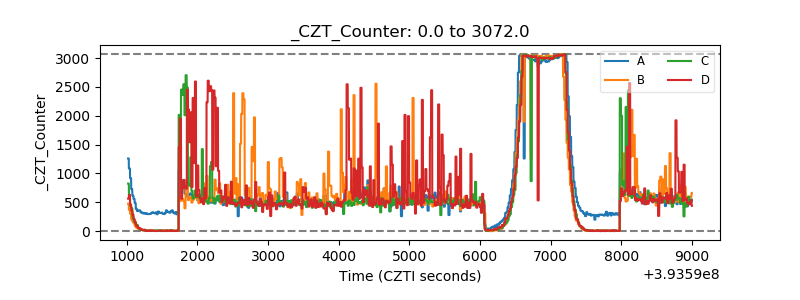 |
| +2.5 Volts monitor | 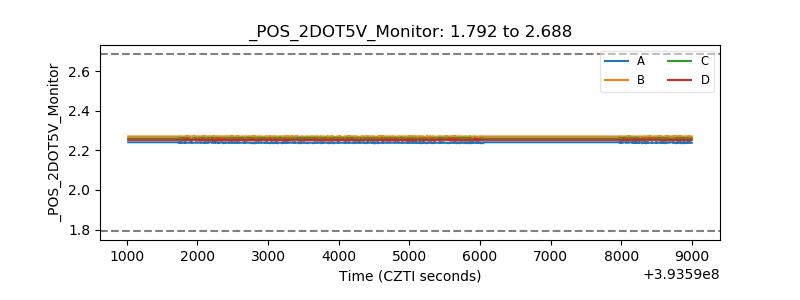 |
| +5 Volts monitor | 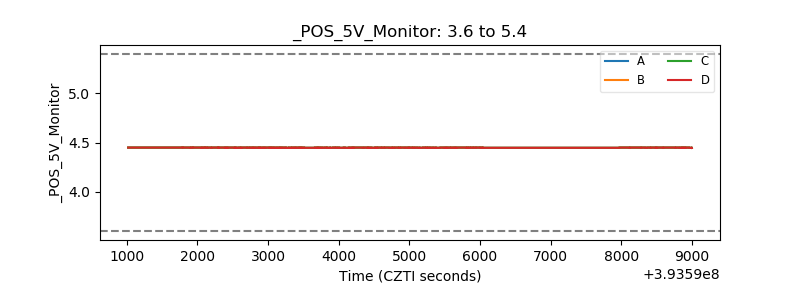 |
| _ROLL_ROT | 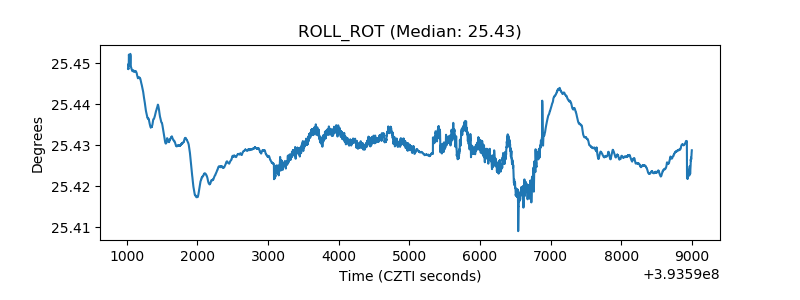 |
| _Roll_DEC | 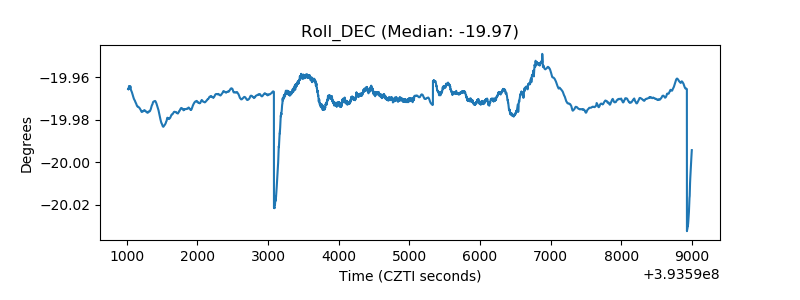 |
| _Roll_RA | 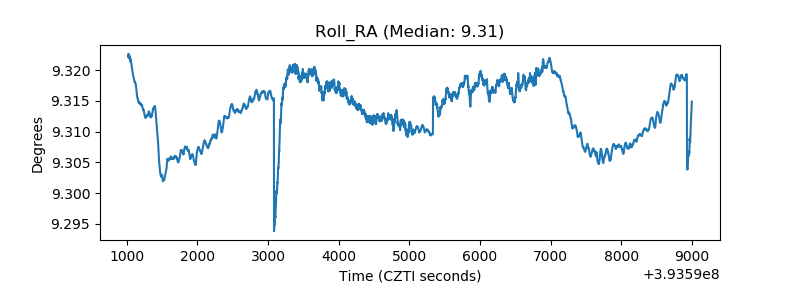 |
| Veto Counter | 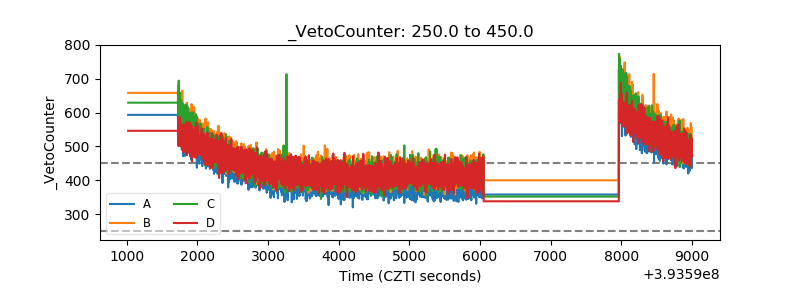 |