| Param | Original file | Final file |
|---|---|---|
| Filename | modeM0/AS1T04_084T01_9000005198_36401cztM0_level2.evt | modeM0/AS1T04_084T01_9000005198_36401cztM0_level2_quad_clean.evt |
| Size (bytes) | 439,318,080 | 62,565,120 |
| Size | 419.0 MB | 59.7 MB |
| Events in quadrant A | 2,626,036 | 386,156 |
| Events in quadrant B | 3,846,398 | 388,560 |
| Events in quadrant C | 2,705,237 | 385,799 |
| Events in quadrant D | 3,765,255 | 360,538 |
| Mode M0 | |||
|---|---|---|---|
| Quadrant | BADHDUFLAG | Total packets | Discarded packets |
| A | 0 | 11025 | 2 |
| B | 0 | 14893 | 1 |
| C | 0 | 11149 | 1 |
| D | 0 | 14745 | 1 |
| Mode SS | |||
|---|---|---|---|
| Quadrant | BADHDUFLAG | Total packets | Discarded packets |
| A | 0 | 108 | 0 |
| B | 0 | 108 | 0 |
| C | 0 | 108 | 0 |
| D | 0 | 108 | 0 |
| Mode M9 | |||
|---|---|---|---|
| Quadrant | BADHDUFLAG | Total packets | Discarded packets |
| A | 0 | 17 | 0 |
| B | 0 | 17 | 0 |
| C | 0 | 17 | 0 |
| D | 0 | 17 | 0 |
| Quadrant | Total seconds | Saturated seconds | Saturation percentage |
|---|---|---|---|
| A | 5331 | 5 | 0.093791% |
| B | 5331 | 299 | 5.608704% |
| C | 5331 | 38 | 0.712812% |
| D | 5331 | 279 | 5.233540% |
Noise dominated data is calculated using 1-second bins in cleaned event files. If a bin has >2000 counts, and if more than 50% of those come from <1% of pixels, then it is considered to be noise-dominated and hence unusable.
| Quadrant | # 1 sec bins | Bins with >0 counts | Bins with >2000 counts | High rate bins dominated by noise | Noise dominated (total time) | Noise dominated (detector-on time) | Marked lightcurve |
|---|---|---|---|---|---|---|---|
| A | 7005 | 5332 | 0 | 0 | 0.00% | 0.00% | 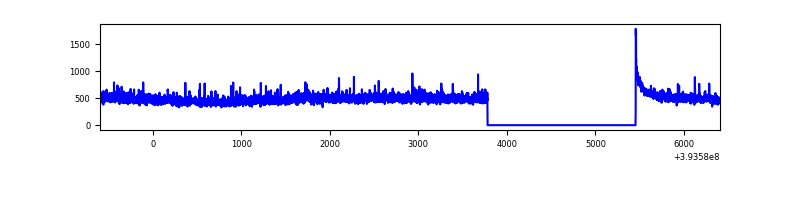 |
| B | 7005 | 5332 | 186 | 186 | 2.66% | 3.49% | 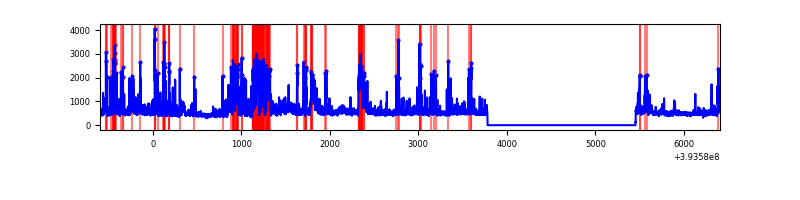 |
| C | 7005 | 5332 | 22 | 22 | 0.31% | 0.41% | 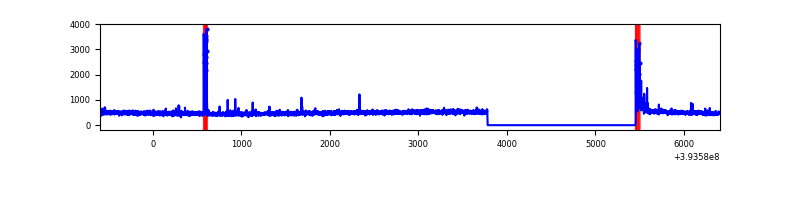 |
| D | 7005 | 5332 | 252 | 252 | 3.60% | 4.73% | 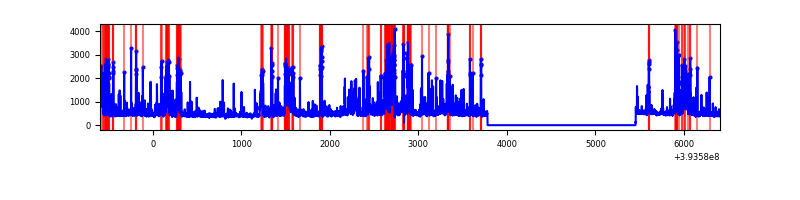 |
Top three noisy pixels from each quadrant. If the there are fewer than three noisy pixels in the level2.evt file, extra rows are filled as -1
| Pixel properties | Quadrant properties | ||||||
|---|---|---|---|---|---|---|---|
| Quadrant | DetID | PixID | Counts | Sigma | Mean | Median | Sigma |
| A | 10 | 83 | 150083 | 1182.04 | 624 | 609 | 126.5 |
| A | 15 | 223 | 42143 | 328.45 | 624 | 609 | 126.5 |
| A | 12 | 189 | 12454 | 93.67 | 624 | 609 | 126.5 |
| B | 5 | 172 | 682069 | 5787.83 | 607 | 591 | 117.7 |
| B | 5 | 255 | 427543 | 3626.13 | 607 | 591 | 117.7 |
| B | 0 | 189 | 174753 | 1479.17 | 607 | 591 | 117.7 |
| C | 15 | 214 | 225297 | 1605.03 | 600 | 605 | 140.0 |
| C | 0 | 10 | 73554 | 521.09 | 600 | 605 | 140.0 |
| C | 0 | 207 | 64933 | 459.51 | 600 | 605 | 140.0 |
| D | 12 | 6 | 639261 | 4359.31 | 596 | 578 | 146.5 |
| D | 12 | 227 | 182266 | 1240.11 | 596 | 578 | 146.5 |
| D | 13 | 171 | 123036 | 835.83 | 596 | 578 | 146.5 |
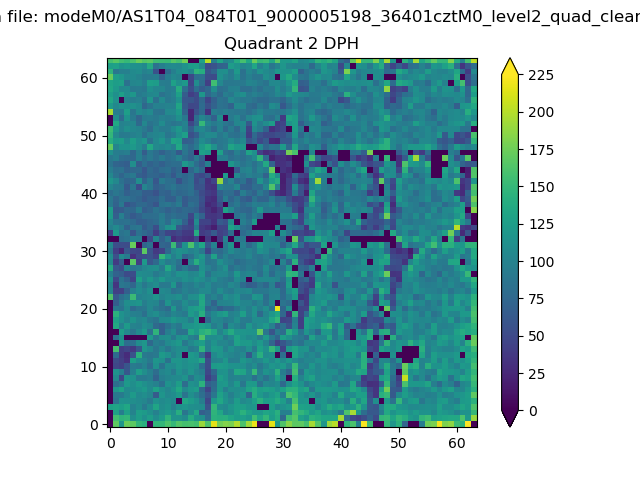
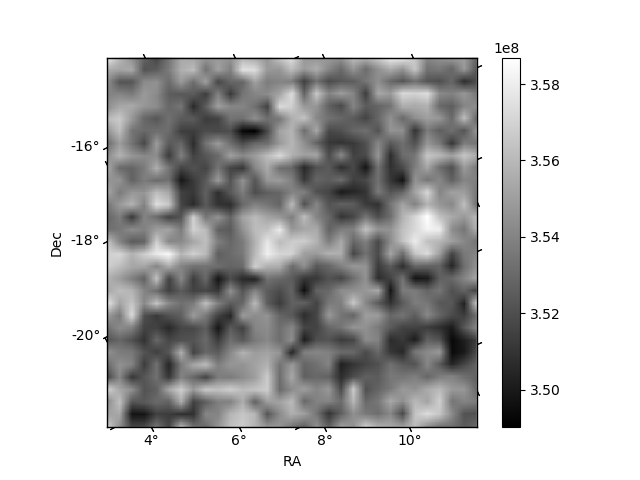
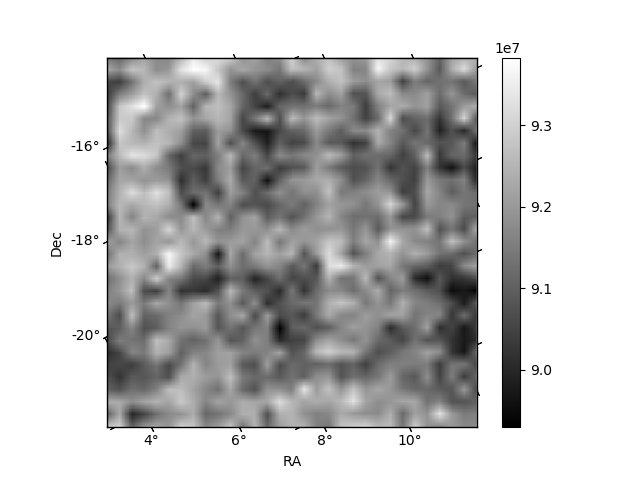
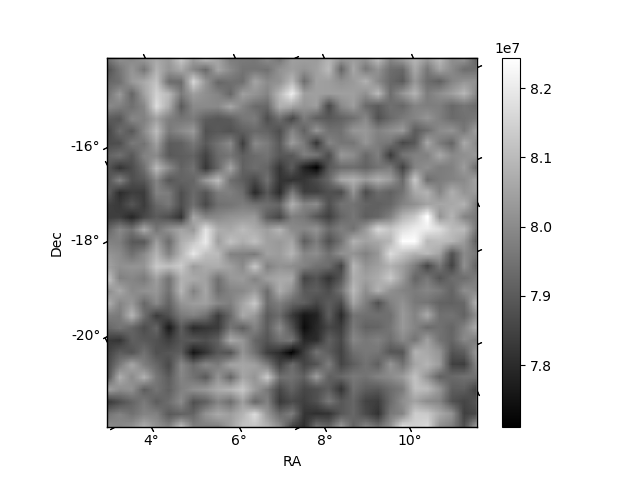
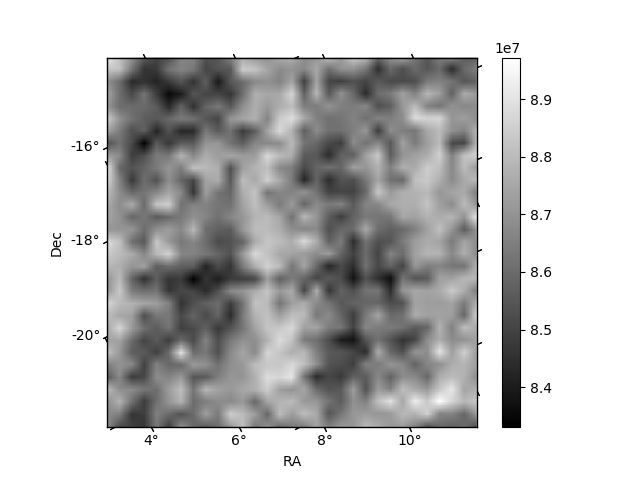
Histogram calculated using DETX and DETY for each event in the final _common_clean file
| Quadrant A | 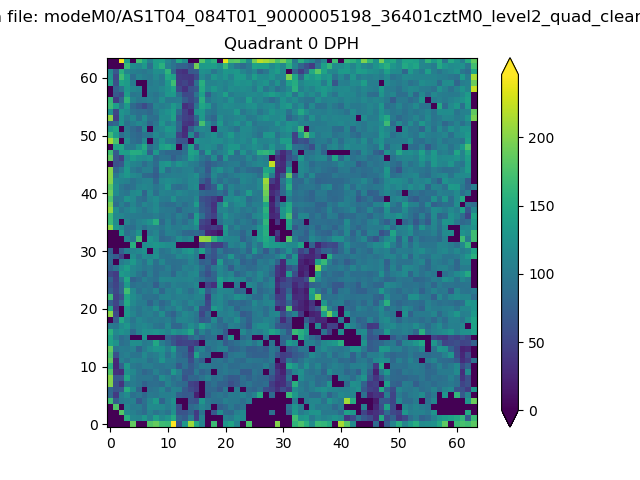 |
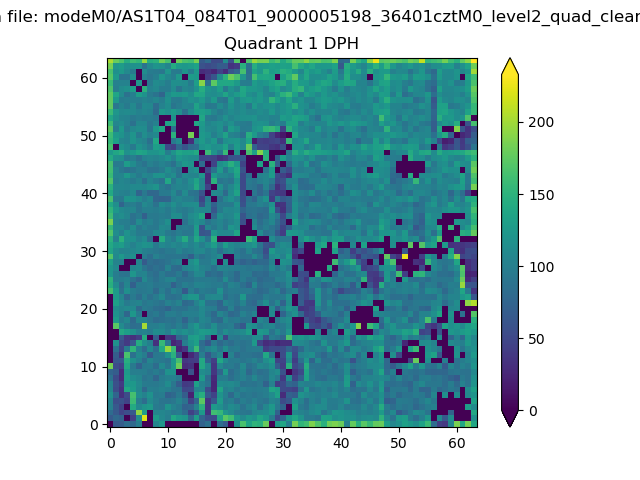 |
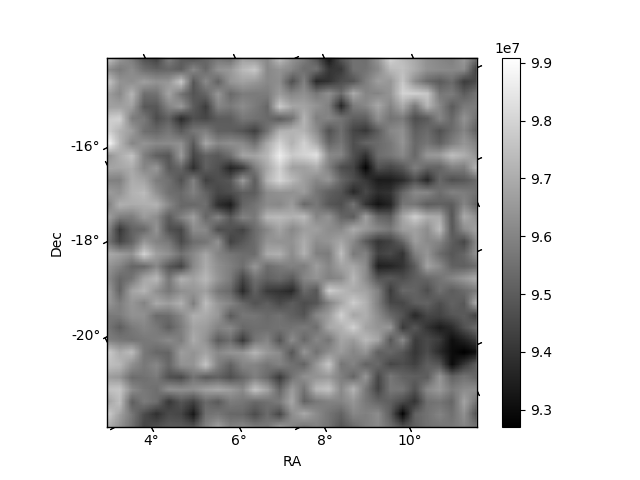
Quadrant B |
|---|---|---|---|
| Quadrant D | 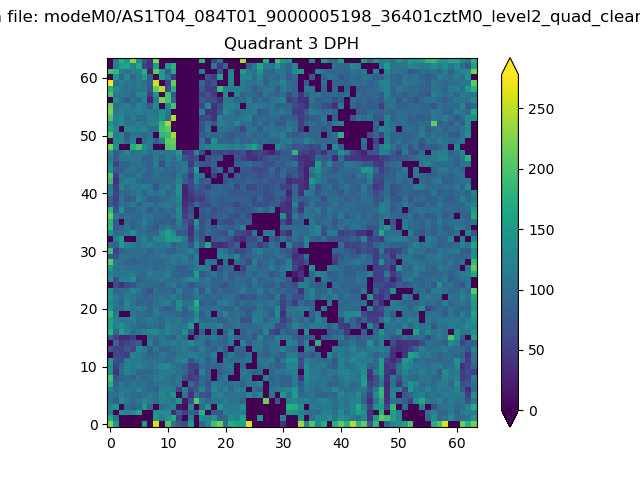 |
 |
Quadrant C |
| Plot type | Count rate plots | Images |
|---|---|---|
| Comparison with Poisson distribution Blue bars denote a histogram of data divided into 1 sec bins. Red curve is a Poisson curve with rate = median count rate of data. |
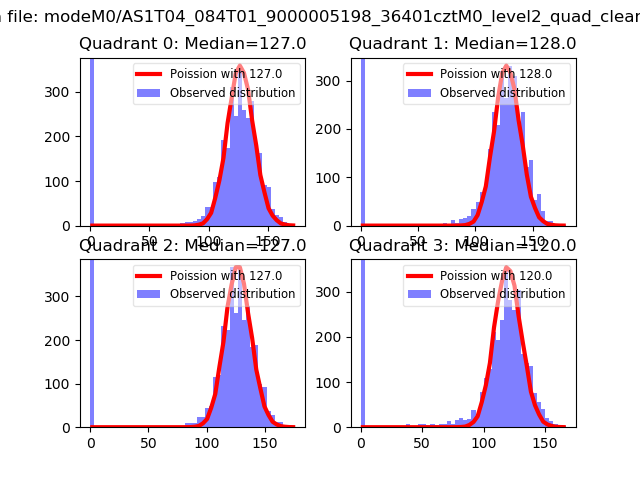 |
 |
| Quadrant-wise count rates Data is divided into 100 sec bins |
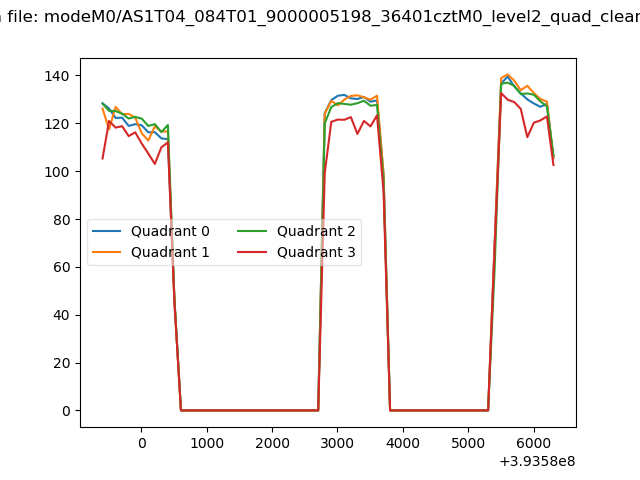 |
|
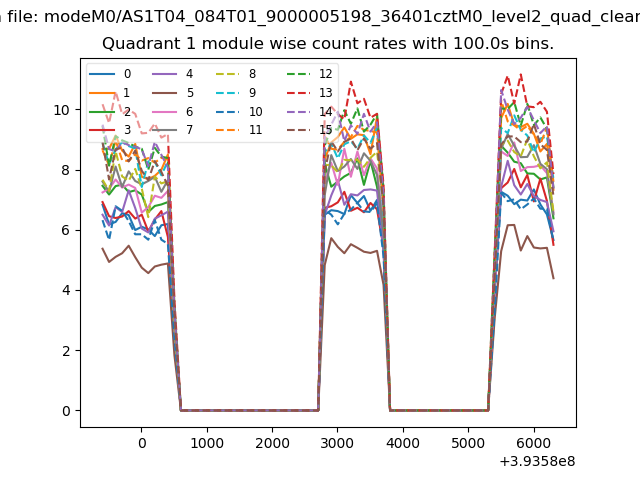
| Module-wise count rates for Quadrant A Data is divided into 100 sec bins |
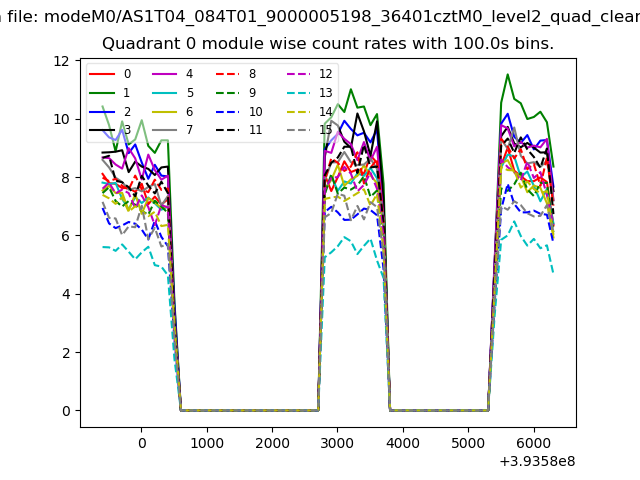 |
 |
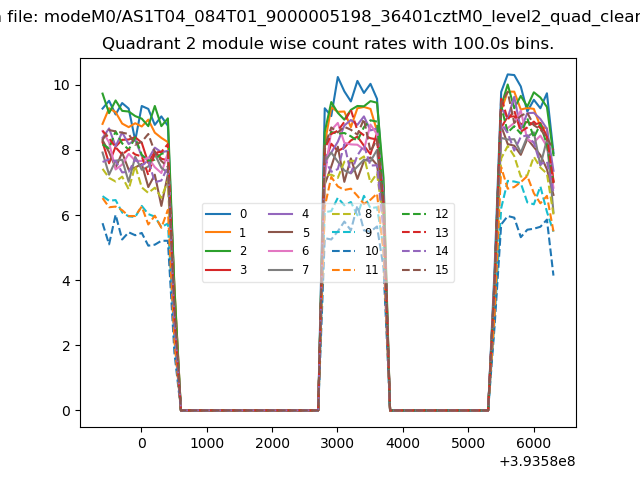
| Module-wise count rates for Quadrant B Data is divided into 100 sec bins |
 |
 |
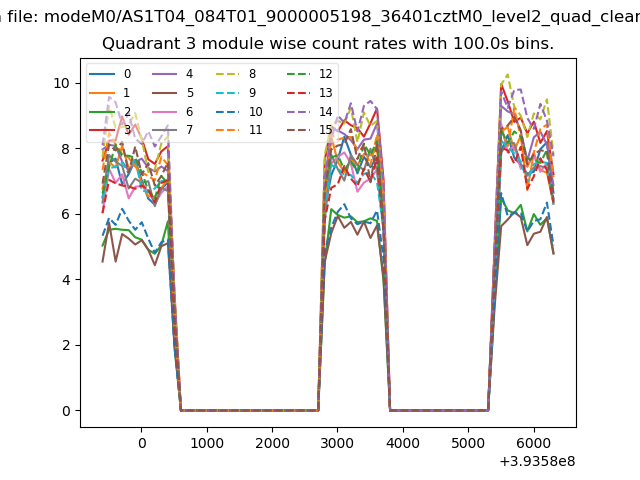
| Module-wise count rates for Quadrant C Data is divided into 100 sec bins |
 |
 |
| Module-wise count rates for Quadrant D Data is divided into 100 sec bins |
 |
 |
| Parameter | Plot |
|---|---|
| CZT HV Monitor | 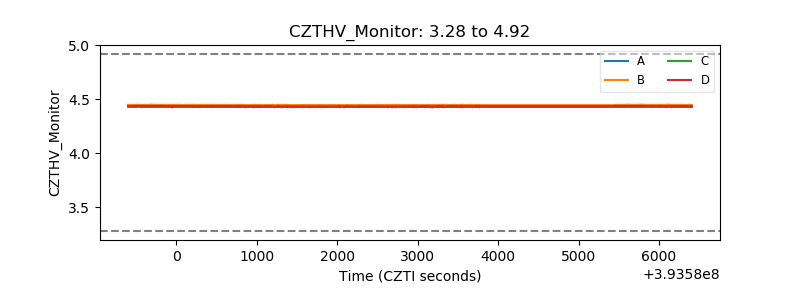 |
| D_VDD | 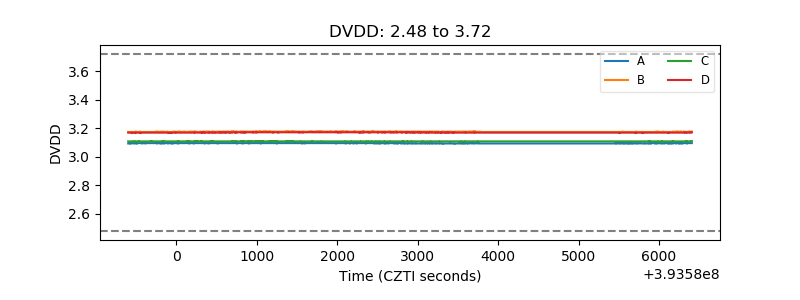 |
| Temperature 1 | 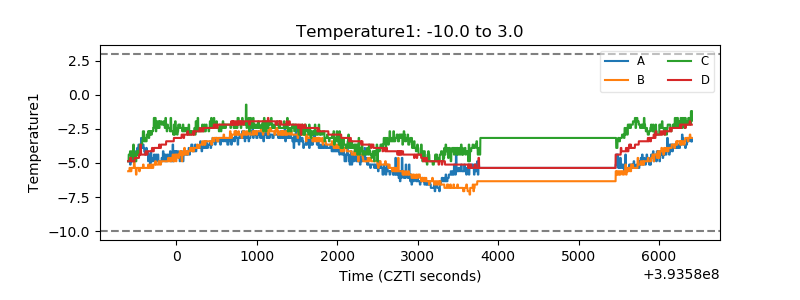 |
| Veto HV Monitor |  |
| Veto LLD | 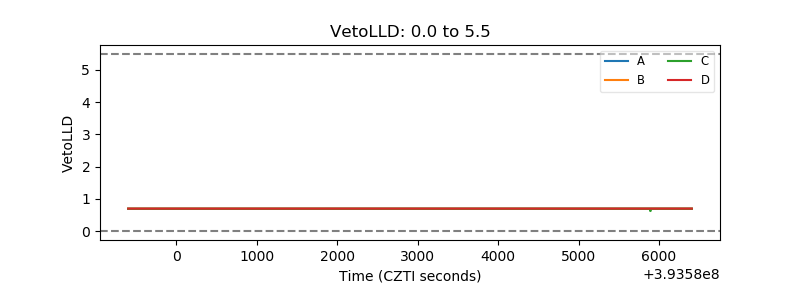 |
| Alpha Counter | 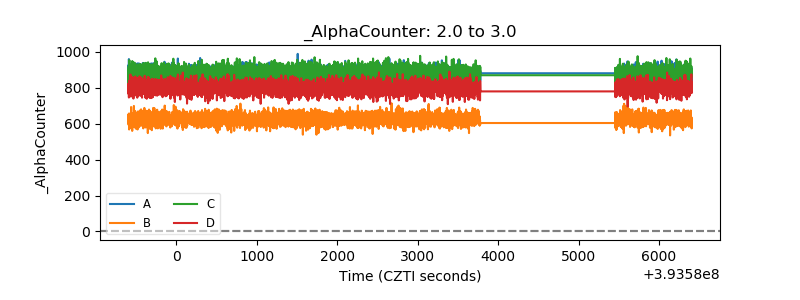 |
| _CPM_Rate |  |
| CZT Counter | 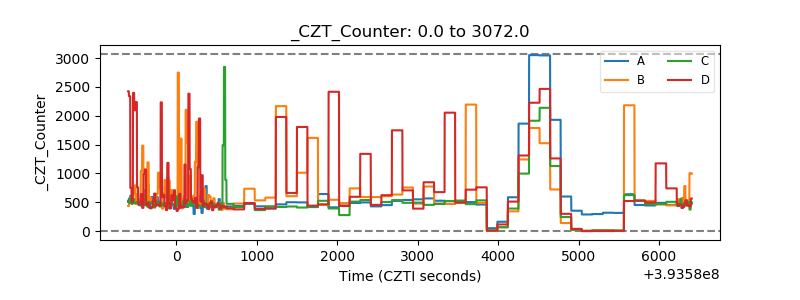 |
| +2.5 Volts monitor | 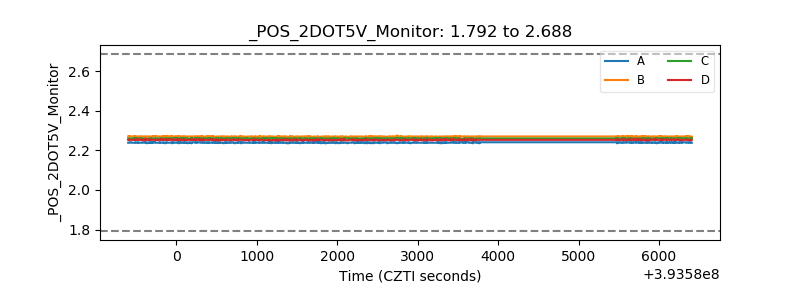 |
| +5 Volts monitor | 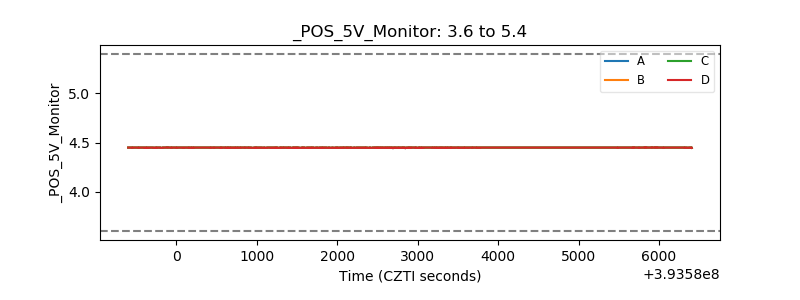 |
| _ROLL_ROT | 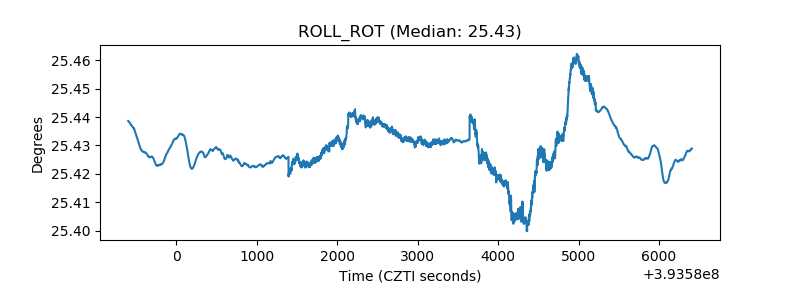 |
| _Roll_DEC | 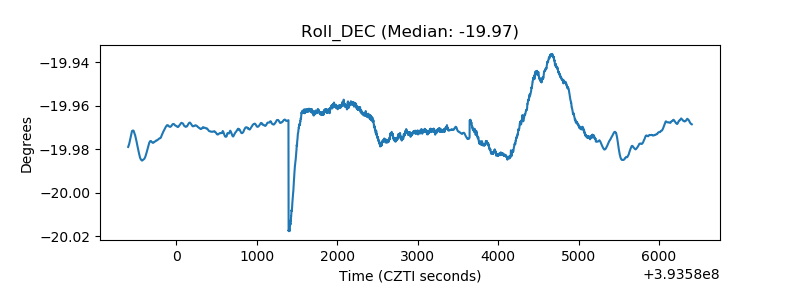 |
| _Roll_RA | 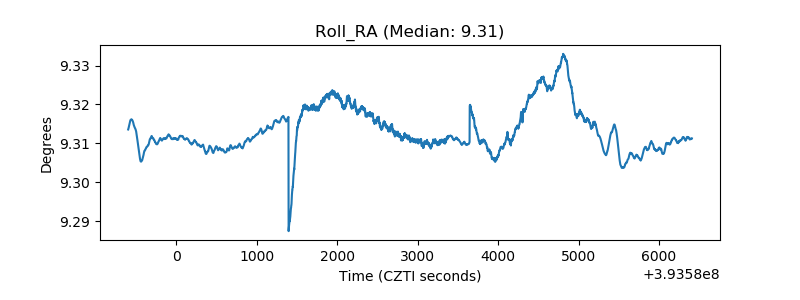 |
| Veto Counter | 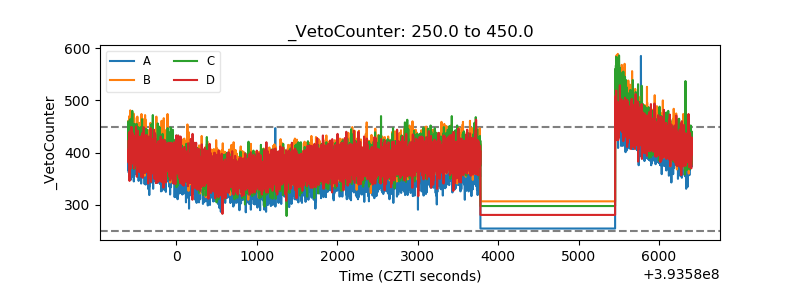 |