| Param | Original file | Final file |
|---|---|---|
| Filename | modeM0/AS1T04_084T01_9000005198_36400cztM0_level2.evt | modeM0/AS1T04_084T01_9000005198_36400cztM0_level2_quad_clean.evt |
| Size (bytes) | 511,922,880 | 68,132,160 |
| Size | 488.2 MB | 65.0 MB |
| Events in quadrant A | 2,796,619 | 428,429 |
| Events in quadrant B | 4,497,041 | 400,863 |
| Events in quadrant C | 2,857,119 | 430,457 |
| Events in quadrant D | 4,959,971 | 398,178 |
| Mode M0 | |||
|---|---|---|---|
| Quadrant | BADHDUFLAG | Total packets | Discarded packets |
| A | 0 | 11916 | 3 |
| B | 0 | 17123 | 2 |
| C | 0 | 11940 | 2 |
| D | 0 | 18665 | 2 |
| Mode SS | |||
|---|---|---|---|
| Quadrant | BADHDUFLAG | Total packets | Discarded packets |
| A | 0 | 120 | 0 |
| B | 0 | 120 | 0 |
| C | 0 | 120 | 0 |
| D | 0 | 120 | 0 |
| Mode M9 | |||
|---|---|---|---|
| Quadrant | BADHDUFLAG | Total packets | Discarded packets |
| A | 0 | 27 | 0 |
| B | 0 | 27 | 0 |
| C | 0 | 27 | 0 |
| D | 0 | 28 | 0 |
| Quadrant | Total seconds | Saturated seconds | Saturation percentage |
|---|---|---|---|
| A | 5780 | 5 | 0.086505% |
| B | 5780 | 562 | 9.723183% |
| C | 5780 | 20 | 0.346021% |
| D | 5780 | 691 | 11.955017% |
Noise dominated data is calculated using 1-second bins in cleaned event files. If a bin has >2000 counts, and if more than 50% of those come from <1% of pixels, then it is considered to be noise-dominated and hence unusable.
| Quadrant | # 1 sec bins | Bins with >0 counts | Bins with >2000 counts | High rate bins dominated by noise | Noise dominated (total time) | Noise dominated (detector-on time) | Marked lightcurve |
|---|---|---|---|---|---|---|---|
| A | 7332 | 5781 | 0 | 0 | 0.00% | 0.00% | 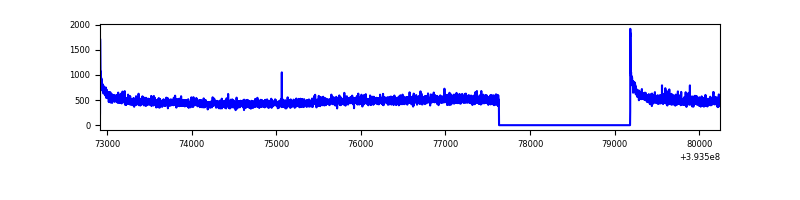 |
| B | 7332 | 5781 | 400 | 400 | 5.46% | 6.92% | 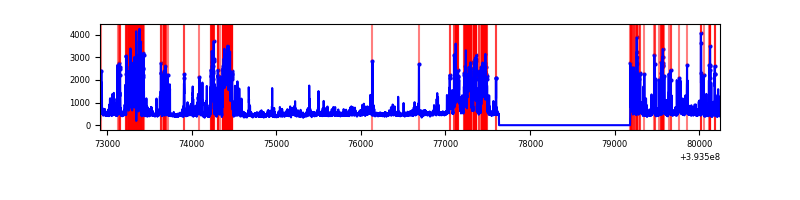 |
| C | 7332 | 5781 | 12 | 12 | 0.16% | 0.21% | 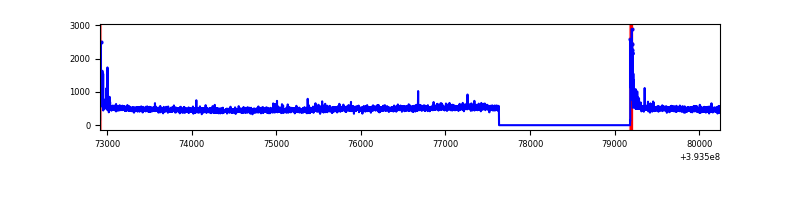 |
| D | 7332 | 5781 | 639 | 639 | 8.72% | 11.05% | 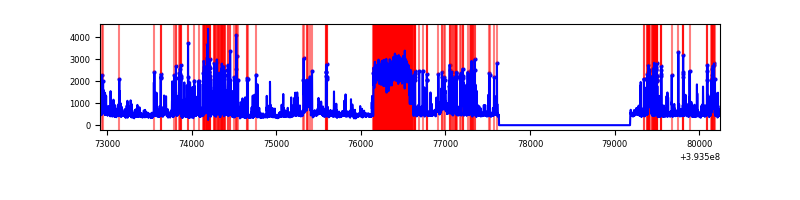 |
Top three noisy pixels from each quadrant. If the there are fewer than three noisy pixels in the level2.evt file, extra rows are filled as -1
| Pixel properties | Quadrant properties | ||||||
|---|---|---|---|---|---|---|---|
| Quadrant | DetID | PixID | Counts | Sigma | Mean | Median | Sigma |
| A | 10 | 83 | 191595 | 1405.49 | 666 | 650 | 135.9 |
| A | 15 | 223 | 18664 | 132.6 | 666 | 650 | 135.9 |
| A | 13 | 254 | 9269 | 63.44 | 666 | 650 | 135.9 |
| B | 5 | 172 | 1335046 | 10736.72 | 632 | 615 | 124.3 |
| B | 5 | 255 | 460945 | 3703.78 | 632 | 615 | 124.3 |
| B | 0 | 189 | 135847 | 1088.07 | 632 | 615 | 124.3 |
| C | 15 | 214 | 247303 | 1621.32 | 645 | 649 | 152.1 |
| C | 0 | 10 | 78325 | 510.58 | 645 | 649 | 152.1 |
| C | 0 | 207 | 10165 | 62.55 | 645 | 649 | 152.1 |
| D | 12 | 227 | 1227641 | 8063.11 | 619 | 603 | 152.2 |
| D | 12 | 6 | 818435 | 5374.13 | 619 | 603 | 152.2 |
| D | 13 | 171 | 147429 | 964.82 | 619 | 603 | 152.2 |
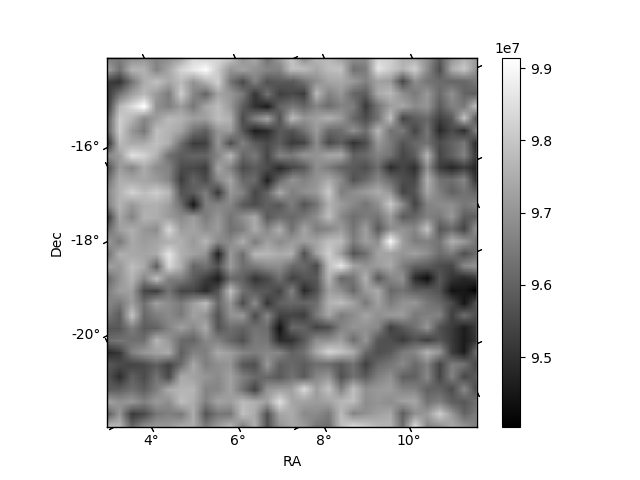
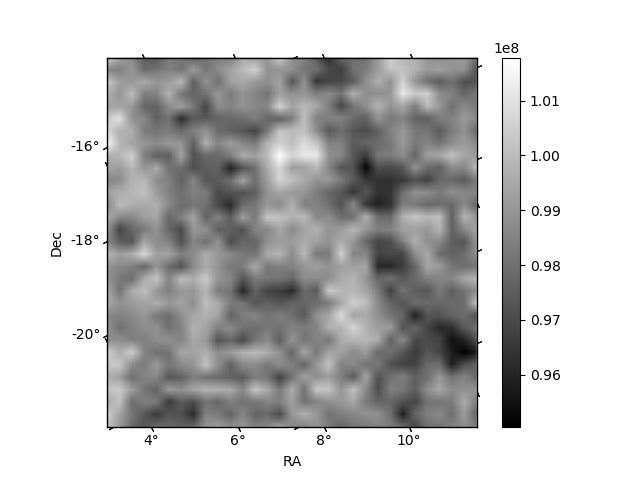
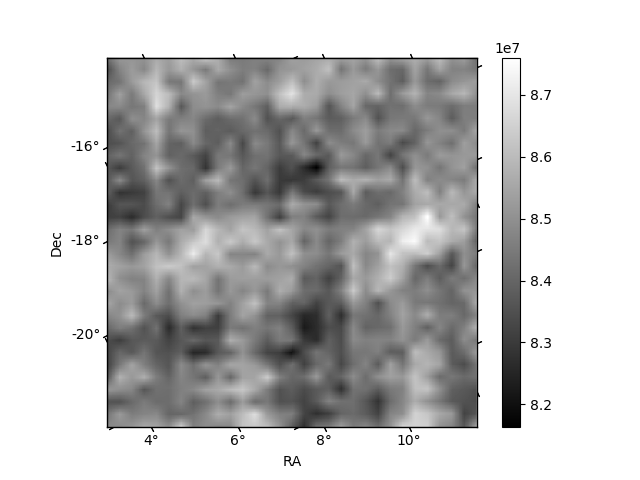
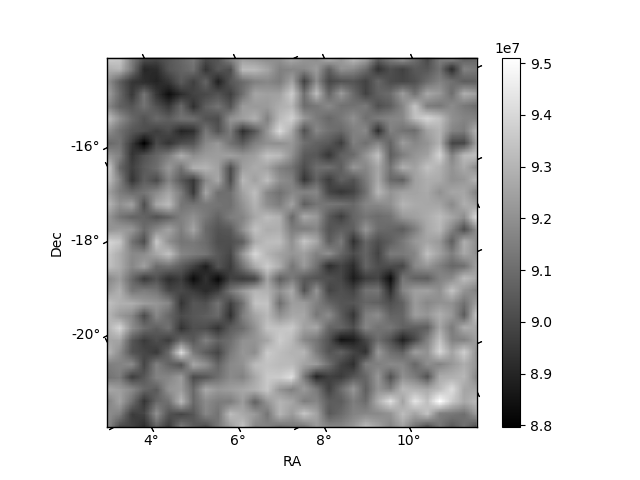
Histogram calculated using DETX and DETY for each event in the final _common_clean file
| Quadrant A | 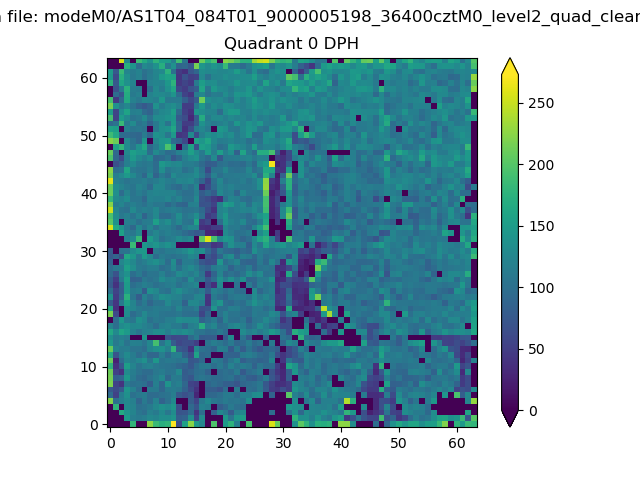 |
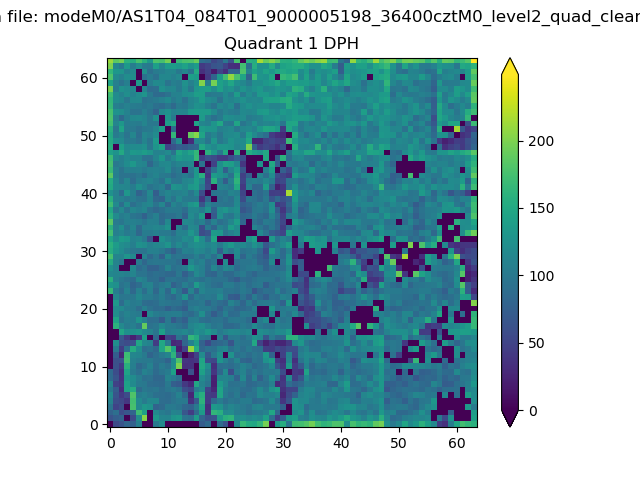 |
Quadrant B |
|---|---|---|---|
| Quadrant D | 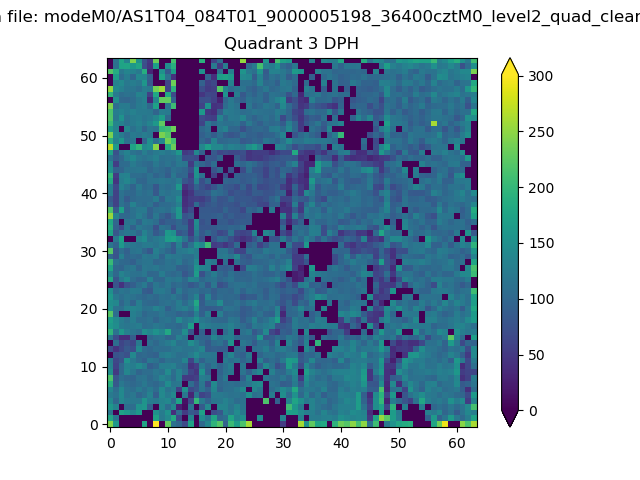 |
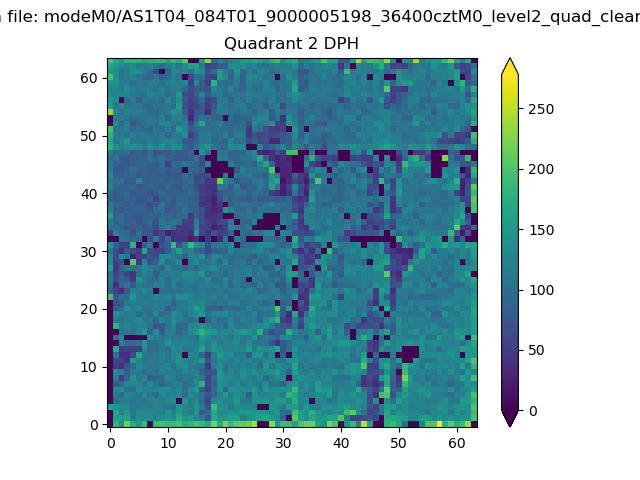 |
Quadrant C |
| Plot type | Count rate plots | Images |
|---|---|---|
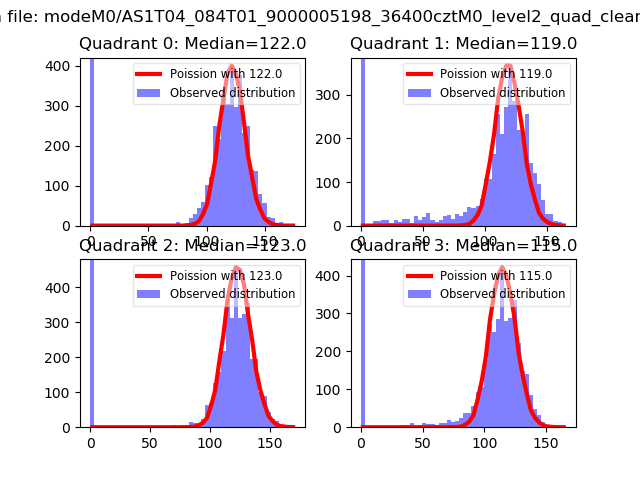
| Comparison with Poisson distribution Blue bars denote a histogram of data divided into 1 sec bins. Red curve is a Poisson curve with rate = median count rate of data. |
 |
 |
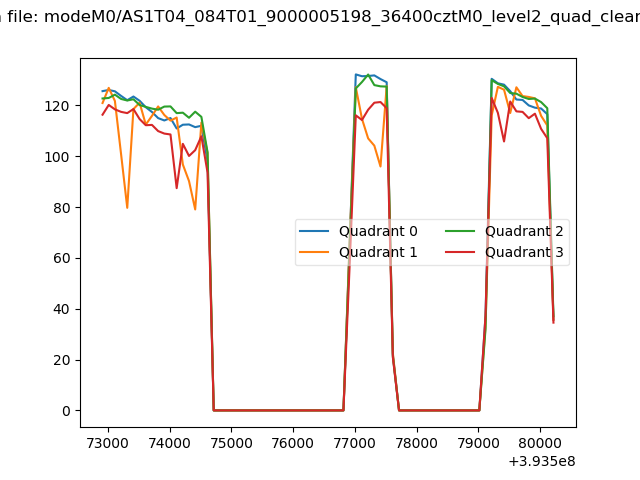
| Quadrant-wise count rates Data is divided into 100 sec bins |
 |
|
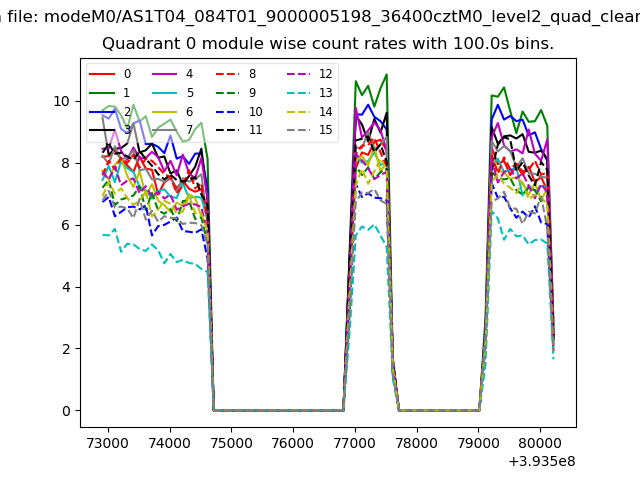
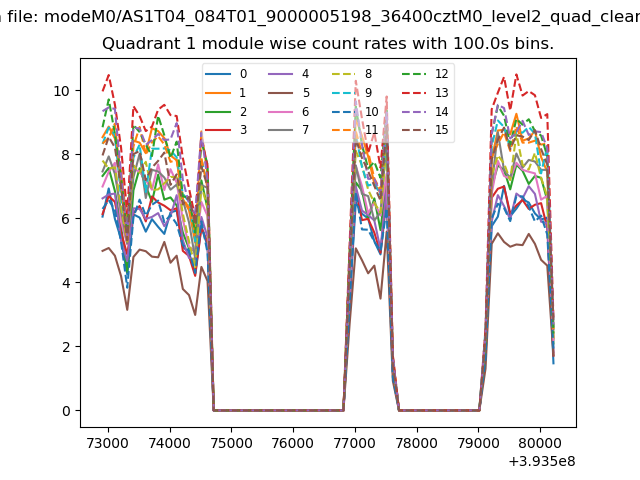
| Module-wise count rates for Quadrant A Data is divided into 100 sec bins |
 |
 |
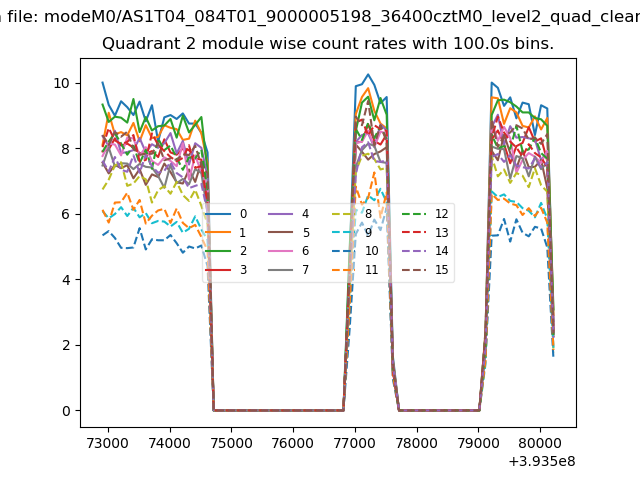
| Module-wise count rates for Quadrant B Data is divided into 100 sec bins |
 |
 |
| Module-wise count rates for Quadrant C Data is divided into 100 sec bins |
 |
 |
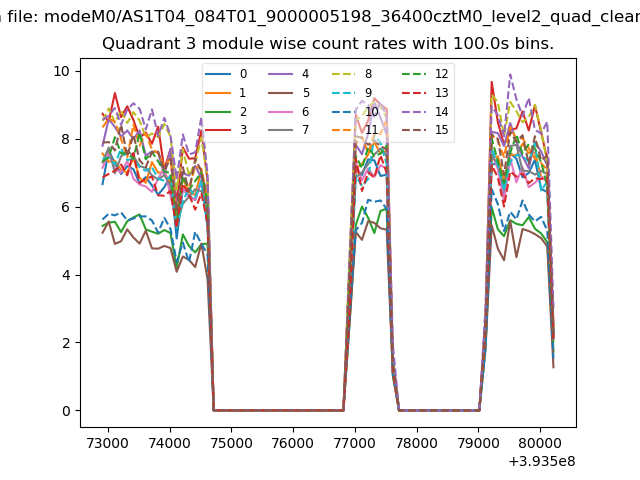
| Module-wise count rates for Quadrant D Data is divided into 100 sec bins |
 |
 |
| Parameter | Plot |
|---|---|
| CZT HV Monitor | 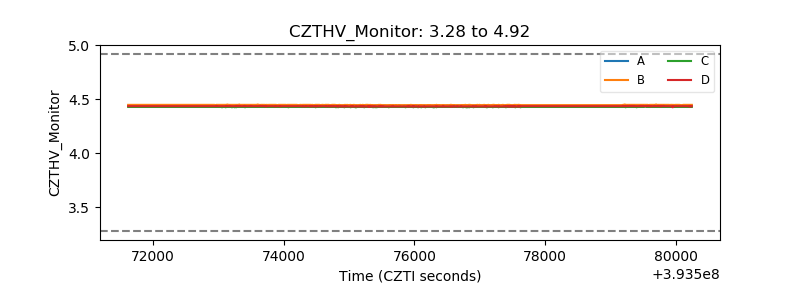 |
| D_VDD | 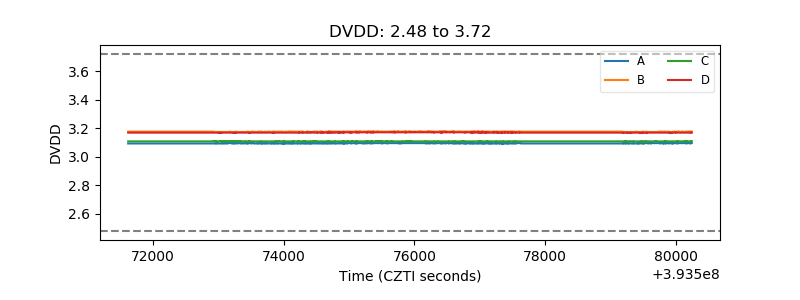 |
| Temperature 1 | 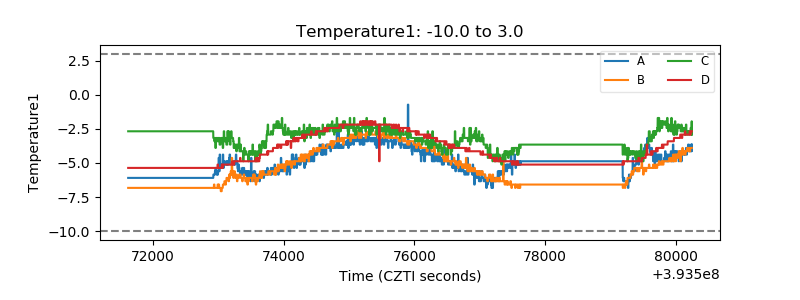 |
| Veto HV Monitor | 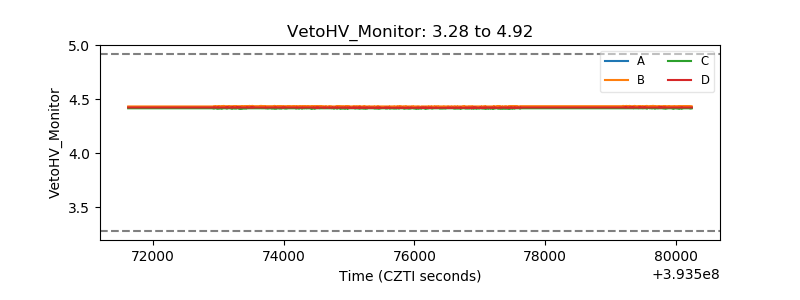 |
| Veto LLD | 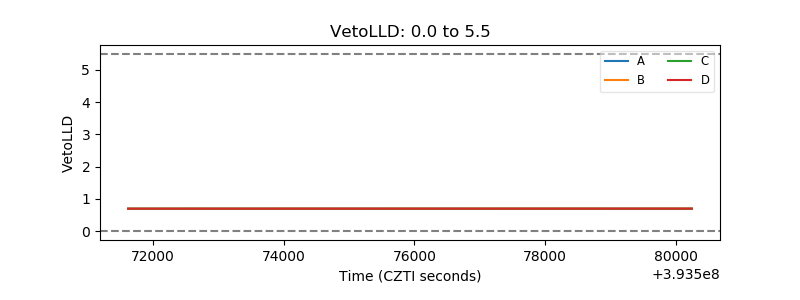 |
| Alpha Counter | 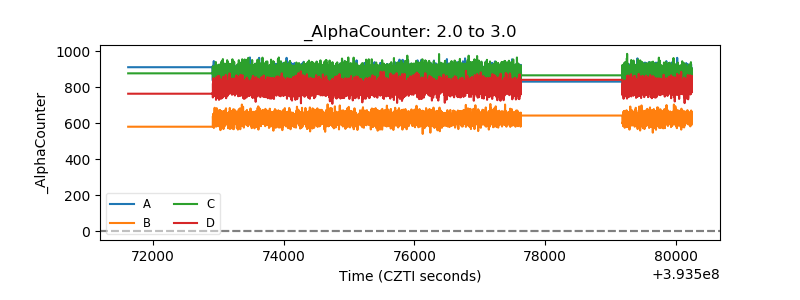 |
| _CPM_Rate | 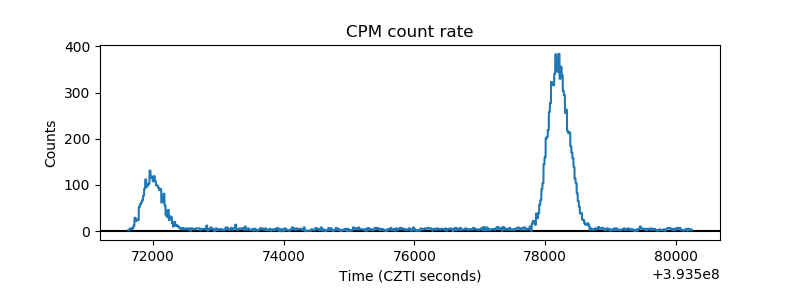 |
| CZT Counter | 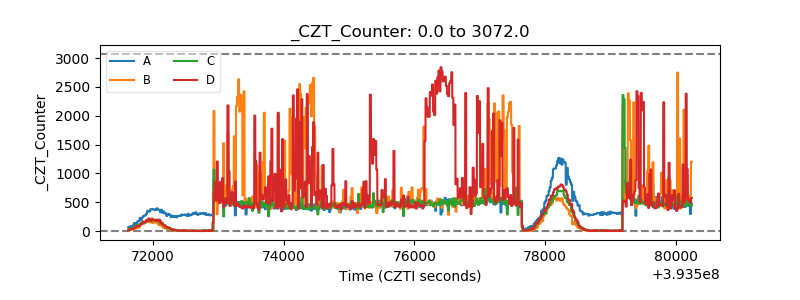 |
| +2.5 Volts monitor |  |
| +5 Volts monitor | 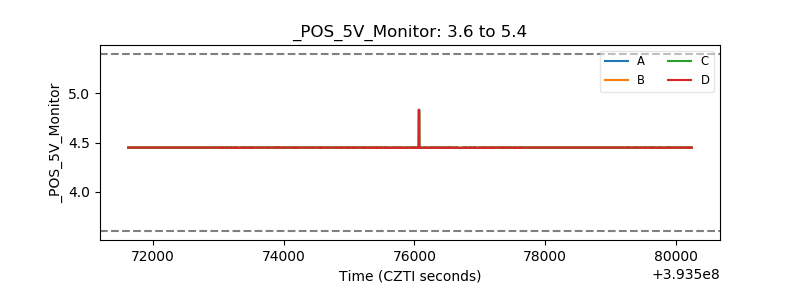 |
| _ROLL_ROT | 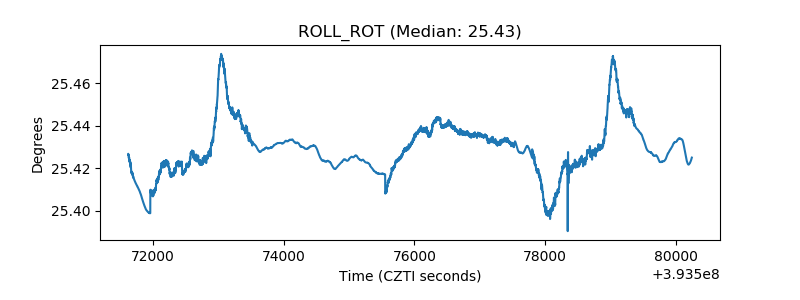 |
| _Roll_DEC | 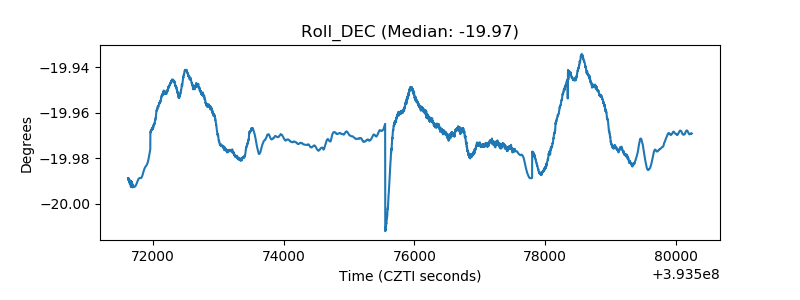 |
| _Roll_RA | 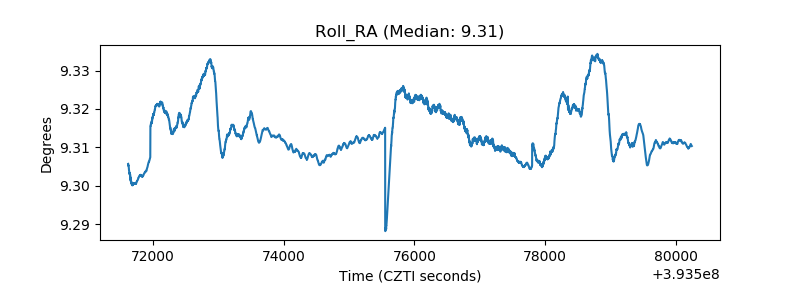 |
| Veto Counter | 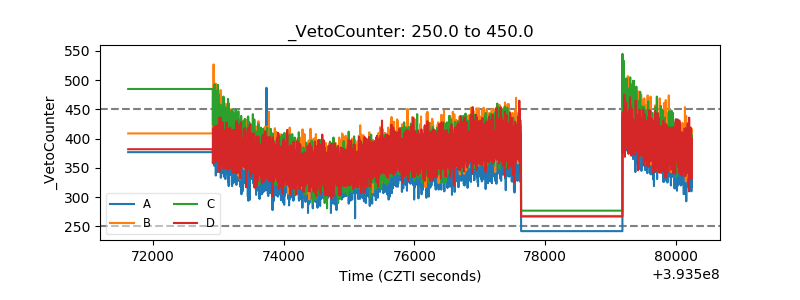 |