| Param | Original file | Final file |
|---|---|---|
| Filename | modeM0/AS1T04_084T01_9000005198_36399cztM0_level2.evt | modeM0/AS1T04_084T01_9000005198_36399cztM0_level2_quad_clean.evt |
| Size (bytes) | 843,122,880 | 121,610,880 |
| Size | 804.1 MB | 116.0 MB |
| Events in quadrant A | 5,291,133 | 746,145 |
| Events in quadrant B | 7,287,254 | 733,333 |
| Events in quadrant C | 5,373,707 | 749,047 |
| Events in quadrant D | 6,851,202 | 705,978 |
| Mode M0 | |||
|---|---|---|---|
| Quadrant | BADHDUFLAG | Total packets | Discarded packets |
| A | 0 | 22700 | 4 |
| B | 0 | 28706 | 3 |
| C | 0 | 22478 | 3 |
| D | 0 | 27759 | 3 |
| Mode SS | |||
|---|---|---|---|
| Quadrant | BADHDUFLAG | Total packets | Discarded packets |
| A | 0 | 220 | 0 |
| B | 0 | 220 | 0 |
| C | 0 | 220 | 0 |
| D | 0 | 220 | 0 |
| Mode M9 | |||
|---|---|---|---|
| Quadrant | BADHDUFLAG | Total packets | Discarded packets |
| A | 0 | 40 | 0 |
| B | 0 | 40 | 0 |
| C | 0 | 40 | 0 |
| D | 0 | 40 | 0 |
| Quadrant | Total seconds | Saturated seconds | Saturation percentage |
|---|---|---|---|
| A | 10806 | 20 | 0.185082% |
| B | 10806 | 571 | 5.284101% |
| C | 10806 | 39 | 0.360911% |
| D | 10806 | 349 | 3.229687% |
Noise dominated data is calculated using 1-second bins in cleaned event files. If a bin has >2000 counts, and if more than 50% of those come from <1% of pixels, then it is considered to be noise-dominated and hence unusable.
| Quadrant | # 1 sec bins | Bins with >0 counts | Bins with >2000 counts | High rate bins dominated by noise | Noise dominated (total time) | Noise dominated (detector-on time) | Marked lightcurve |
|---|---|---|---|---|---|---|---|
| A | 13580 | 10808 | 0 | 0 | 0.00% | 0.00% | 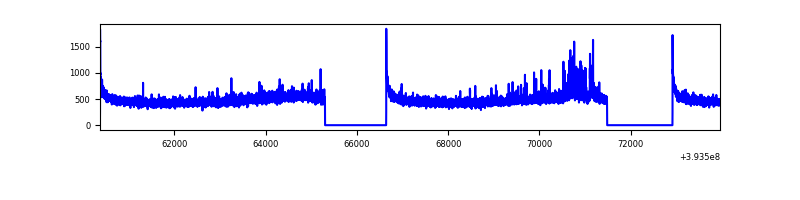 |
| B | 13580 | 10808 | 432 | 432 | 3.18% | 4.00% | 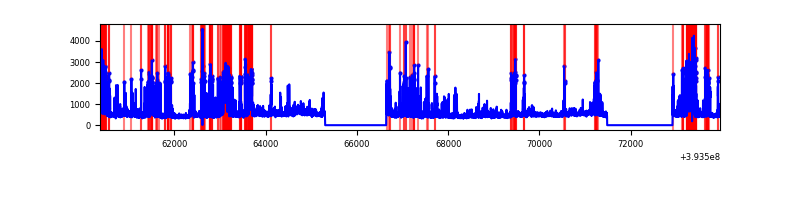 |
| C | 13580 | 10808 | 20 | 20 | 0.15% | 0.19% | 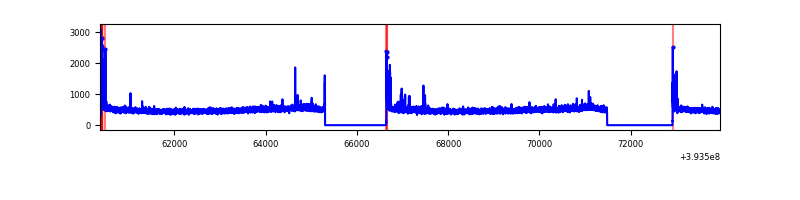 |
| D | 13580 | 10808 | 306 | 306 | 2.25% | 2.83% | 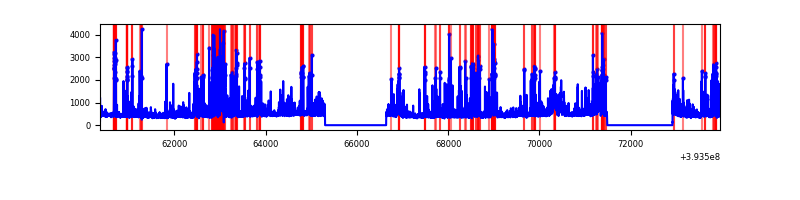 |
Top three noisy pixels from each quadrant. If the there are fewer than three noisy pixels in the level2.evt file, extra rows are filled as -1
| Pixel properties | Quadrant properties | ||||||
|---|---|---|---|---|---|---|---|
| Quadrant | DetID | PixID | Counts | Sigma | Mean | Median | Sigma |
| A | 10 | 83 | 330532 | 1317.36 | 1242 | 1215 | 250.0 |
| A | 15 | 223 | 145276 | 576.28 | 1242 | 1215 | 250.0 |
| A | 13 | 254 | 16782 | 62.27 | 1242 | 1215 | 250.0 |
| B | 5 | 172 | 1514969 | 6458.71 | 1207 | 1174 | 234.4 |
| B | 5 | 255 | 446968 | 1902.01 | 1207 | 1174 | 234.4 |
| B | 0 | 189 | 174592 | 739.9 | 1207 | 1174 | 234.4 |
| C | 15 | 214 | 457137 | 1627.98 | 1205 | 1211 | 280.1 |
| C | 0 | 10 | 173244 | 614.28 | 1205 | 1211 | 280.1 |
| C | 0 | 207 | 24877 | 84.5 | 1205 | 1211 | 280.1 |
| D | 12 | 6 | 997488 | 3404.84 | 1197 | 1162 | 292.6 |
| D | 12 | 227 | 242620 | 825.16 | 1197 | 1162 | 292.6 |
| D | 12 | 16 | 231065 | 785.67 | 1197 | 1162 | 292.6 |
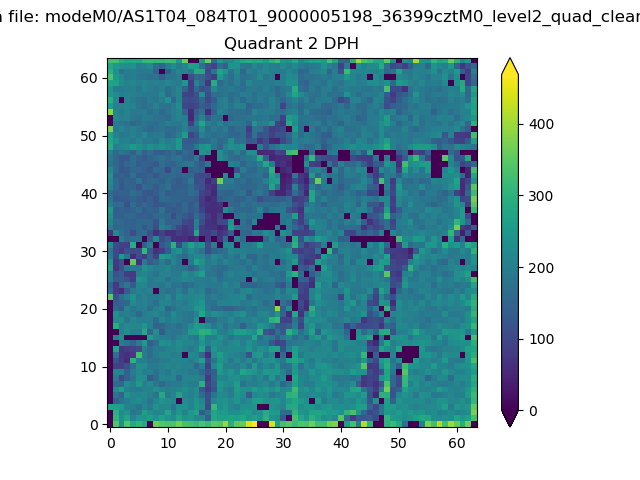
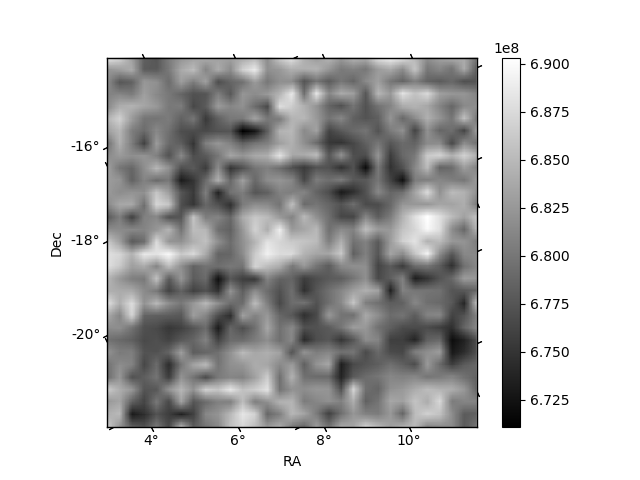
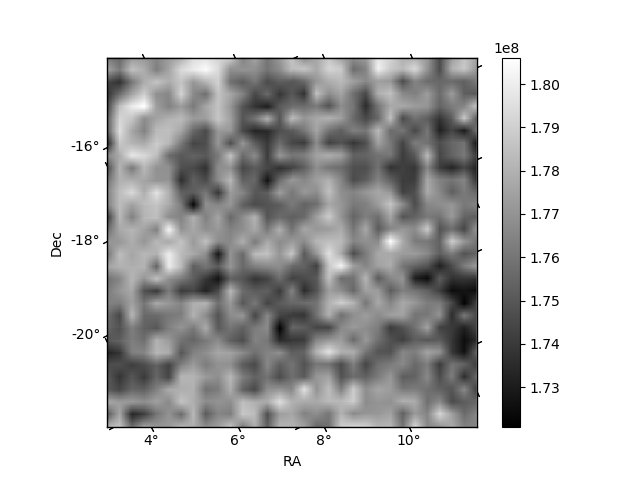
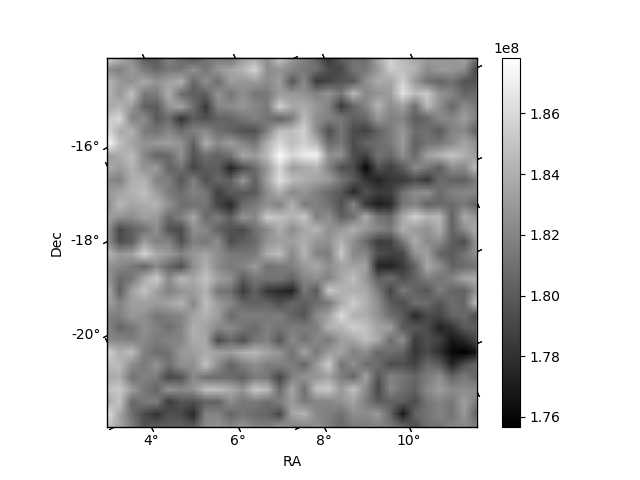
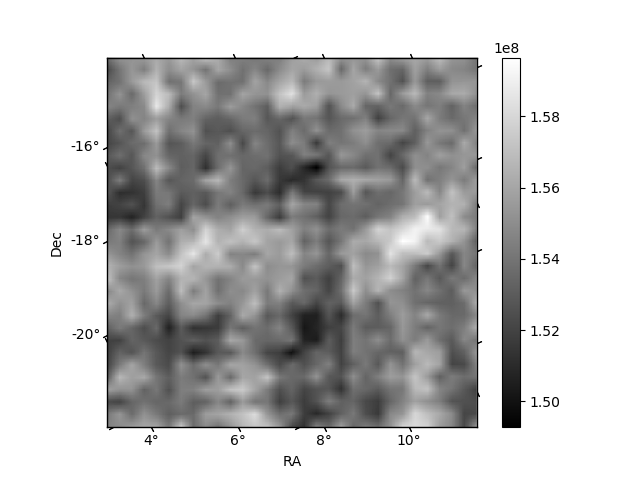
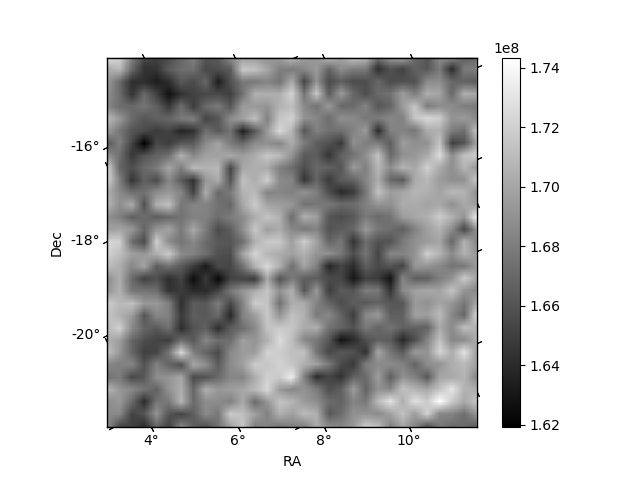
Histogram calculated using DETX and DETY for each event in the final _common_clean file
| Quadrant A | 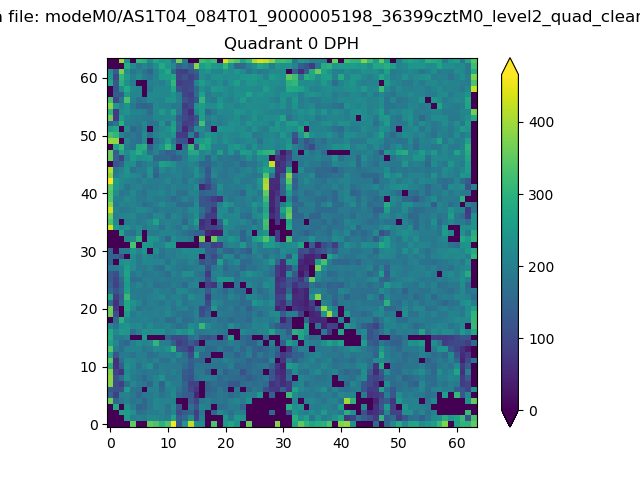 |
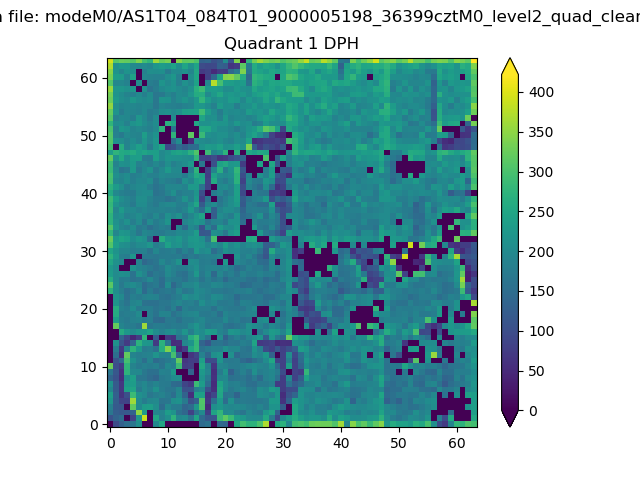 |
Quadrant B |
|---|---|---|---|
| Quadrant D | 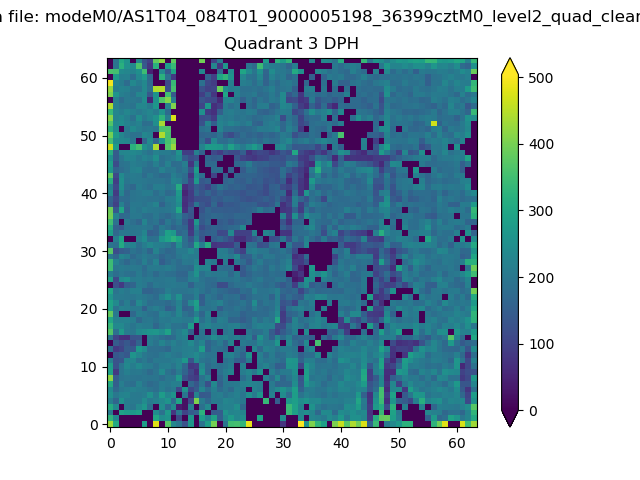 |
 |
Quadrant C |
| Plot type | Count rate plots | Images |
|---|---|---|
| Comparison with Poisson distribution Blue bars denote a histogram of data divided into 1 sec bins. Red curve is a Poisson curve with rate = median count rate of data. |
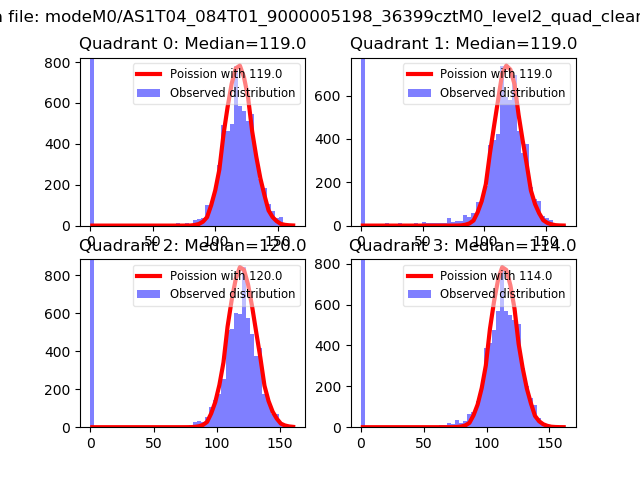 |
 |
| Quadrant-wise count rates Data is divided into 100 sec bins |
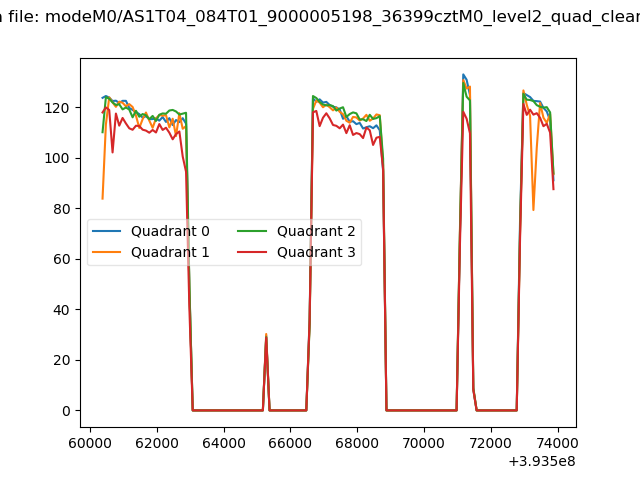 |
|
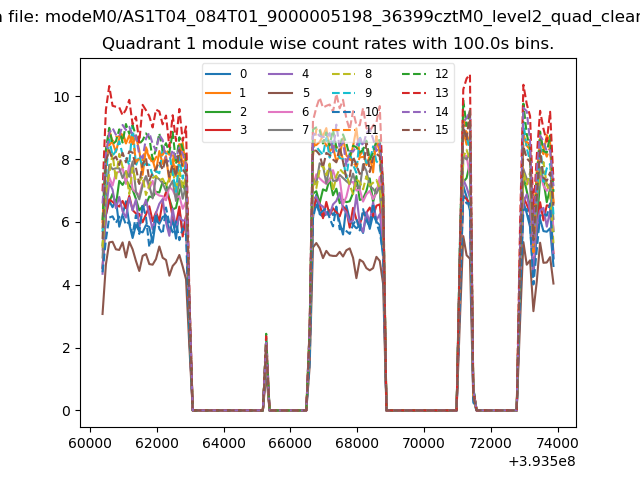
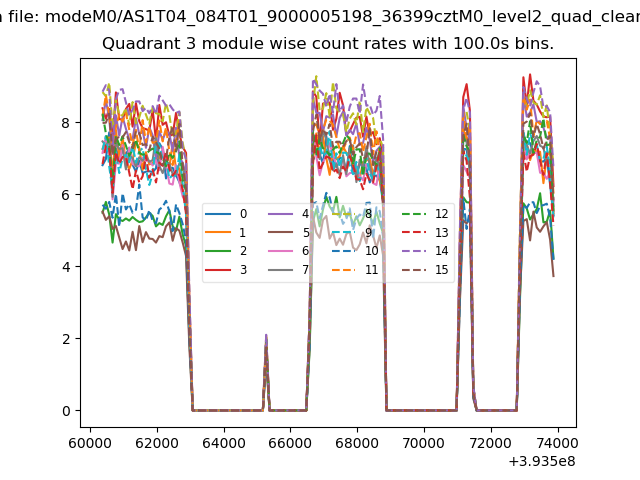
| Module-wise count rates for Quadrant A Data is divided into 100 sec bins |
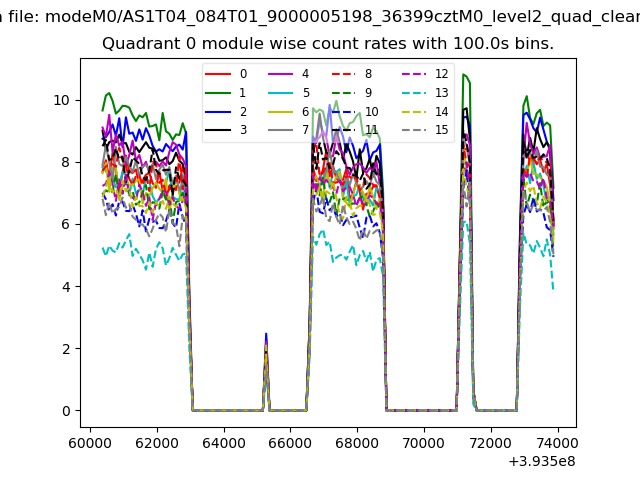 |
 |
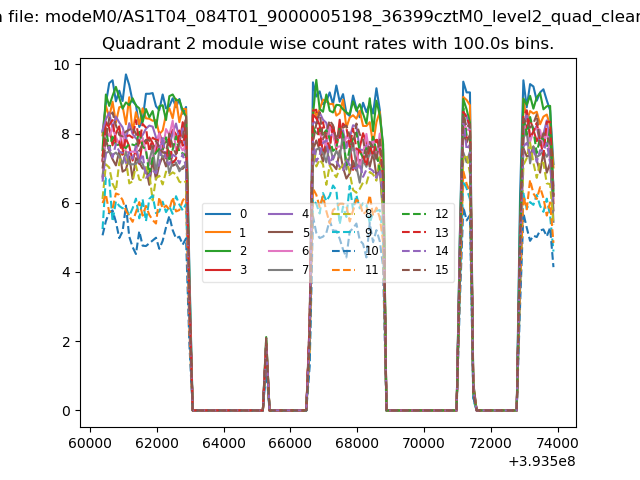
| Module-wise count rates for Quadrant B Data is divided into 100 sec bins |
 |
 |
| Module-wise count rates for Quadrant C Data is divided into 100 sec bins |
 |
 |
| Module-wise count rates for Quadrant D Data is divided into 100 sec bins |
 |
 |
| Parameter | Plot |
|---|---|
| CZT HV Monitor | 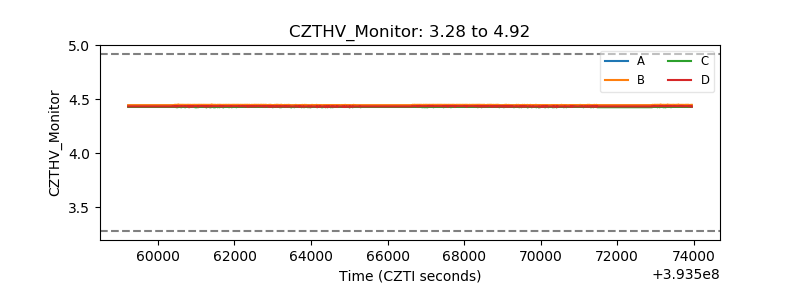 |
| D_VDD | 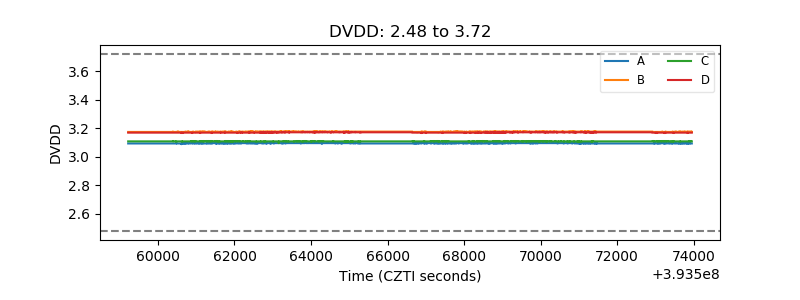 |
| Temperature 1 | 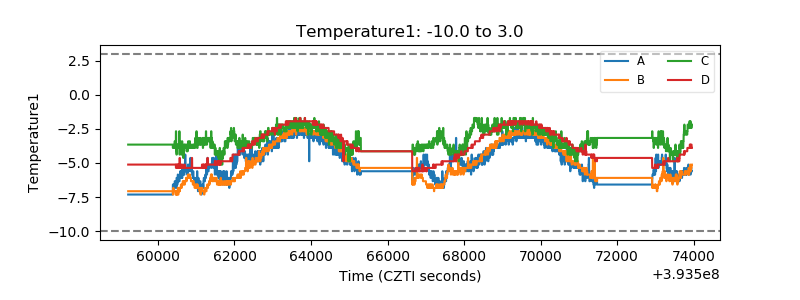 |
| Veto HV Monitor | 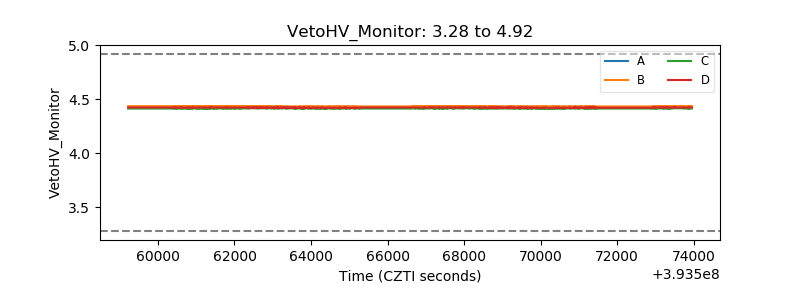 |
| Veto LLD | 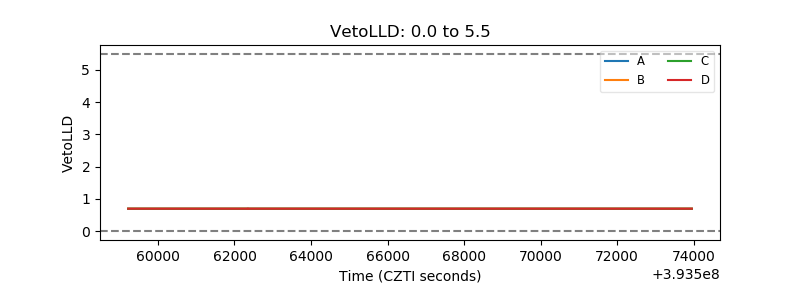 |
| Alpha Counter | 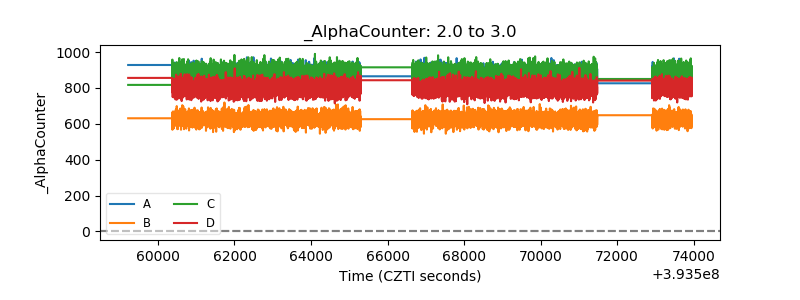 |
| _CPM_Rate | 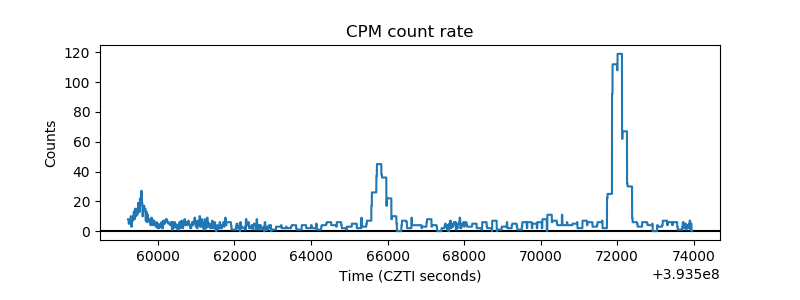 |
| CZT Counter | 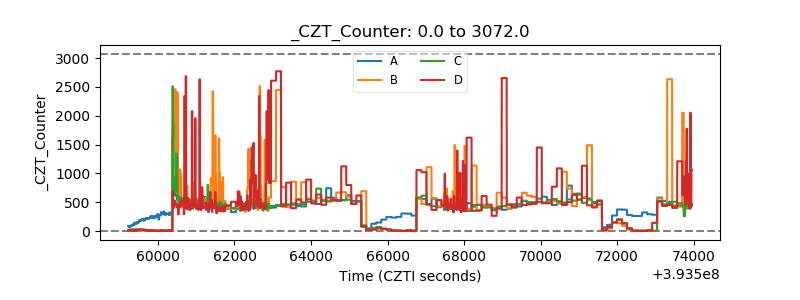 |
| +2.5 Volts monitor | 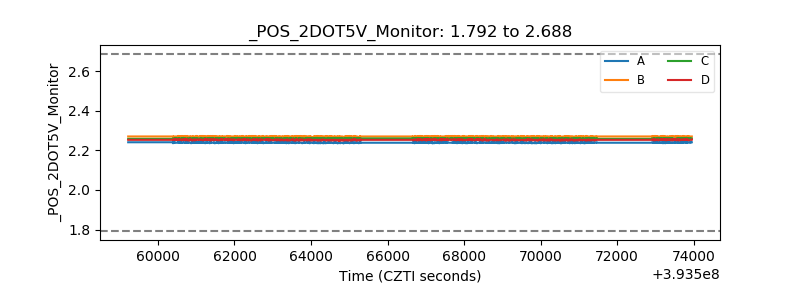 |
| +5 Volts monitor | 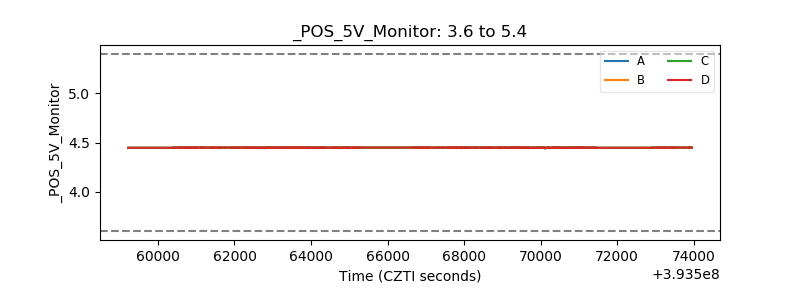 |
| _ROLL_ROT | 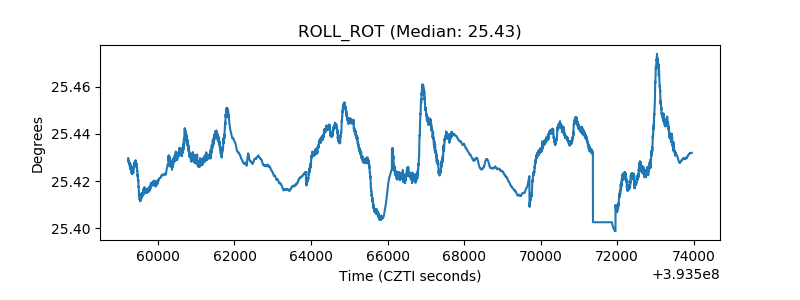 |
| _Roll_DEC | 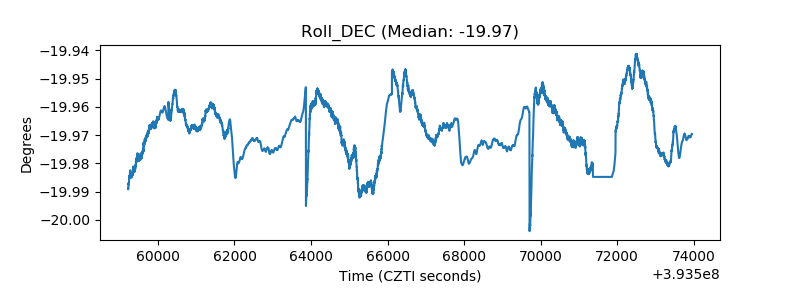 |
| _Roll_RA | 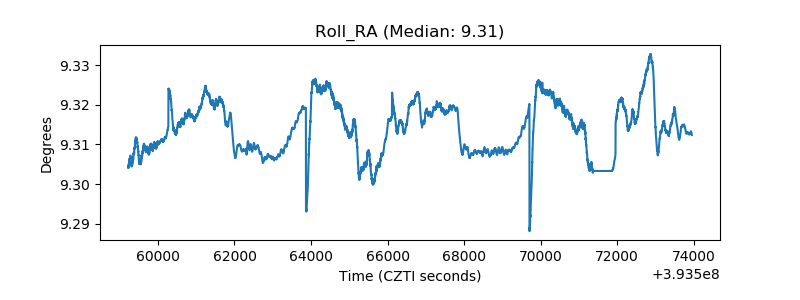 |
| Veto Counter | 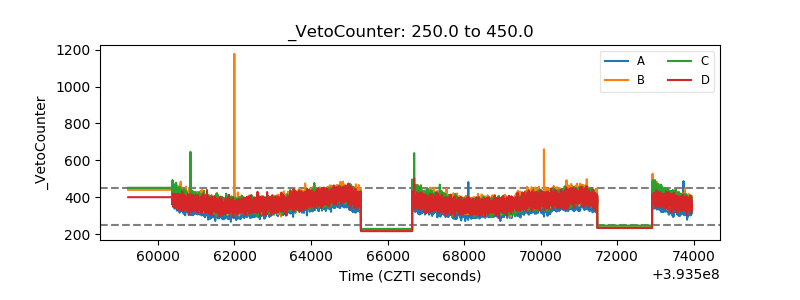 |