| Param | Original file | Final file |
|---|---|---|
| Filename | modeM0/AS1T04_084T01_9000005198_36397cztM0_level2.evt | modeM0/AS1T04_084T01_9000005198_36397cztM0_level2_quad_clean.evt |
| Size (bytes) | 480,280,320 | 76,291,200 |
| Size | 458.0 MB | 72.8 MB |
| Events in quadrant A | 3,012,764 | 485,892 |
| Events in quadrant B | 4,619,142 | 466,879 |
| Events in quadrant C | 3,021,741 | 482,329 |
| Events in quadrant D | 3,488,705 | 460,106 |
| Mode M0 | |||
|---|---|---|---|
| Quadrant | BADHDUFLAG | Total packets | Discarded packets |
| A | 0 | 12839 | 3 |
| B | 0 | 17700 | 2 |
| C | 0 | 12506 | 2 |
| D | 0 | 14362 | 2 |
| Mode SS | |||
|---|---|---|---|
| Quadrant | BADHDUFLAG | Total packets | Discarded packets |
| A | 0 | 122 | 0 |
| B | 0 | 122 | 0 |
| C | 0 | 122 | 0 |
| D | 0 | 122 | 0 |
| Mode M9 | |||
|---|---|---|---|
| Quadrant | BADHDUFLAG | Total packets | Discarded packets |
| A | 0 | 24 | 0 |
| B | 0 | 24 | 0 |
| C | 0 | 24 | 0 |
| D | 0 | 25 | 0 |
| Quadrant | Total seconds | Saturated seconds | Saturation percentage |
|---|---|---|---|
| A | 5932 | 20 | 0.337154% |
| B | 5932 | 437 | 7.366824% |
| C | 5932 | 38 | 0.640593% |
| D | 5932 | 139 | 2.343223% |
Noise dominated data is calculated using 1-second bins in cleaned event files. If a bin has >2000 counts, and if more than 50% of those come from <1% of pixels, then it is considered to be noise-dominated and hence unusable.
| Quadrant | # 1 sec bins | Bins with >0 counts | Bins with >2000 counts | High rate bins dominated by noise | Noise dominated (total time) | Noise dominated (detector-on time) | Marked lightcurve |
|---|---|---|---|---|---|---|---|
| A | 7245 | 5933 | 0 | 0 | 0.00% | 0.00% | 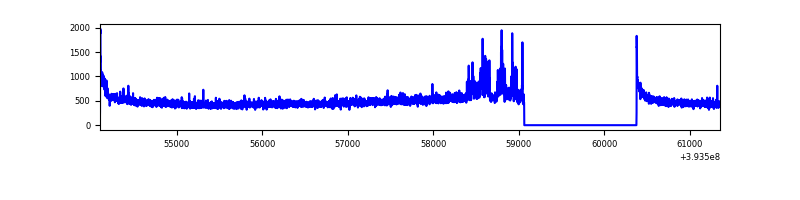 |
| B | 7245 | 5933 | 343 | 343 | 4.73% | 5.78% | 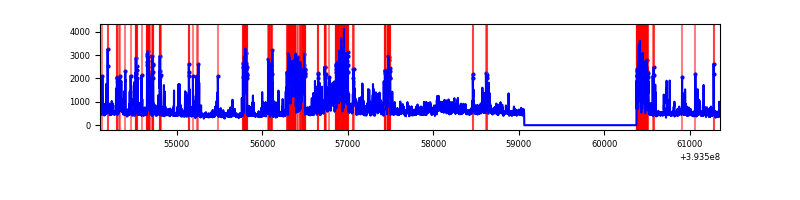 |
| C | 7245 | 5933 | 25 | 25 | 0.35% | 0.42% | 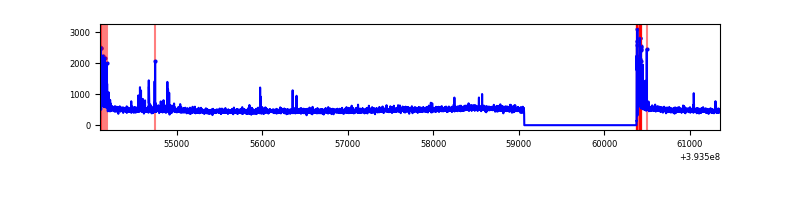 |
| D | 7245 | 5933 | 119 | 119 | 1.64% | 2.01% | 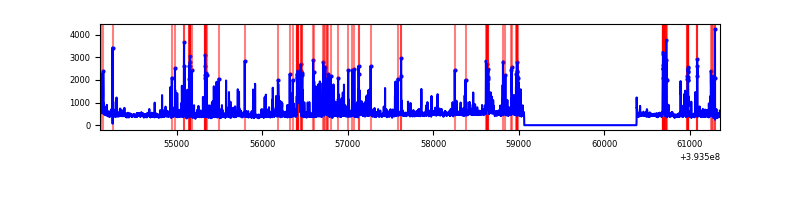 |
Top three noisy pixels from each quadrant. If the there are fewer than three noisy pixels in the level2.evt file, extra rows are filled as -1
| Pixel properties | Quadrant properties | ||||||
|---|---|---|---|---|---|---|---|
| Quadrant | DetID | PixID | Counts | Sigma | Mean | Median | Sigma |
| A | 10 | 83 | 194317 | 1418.33 | 679 | 665 | 136.5 |
| A | 15 | 223 | 168722 | 1230.87 | 679 | 665 | 136.5 |
| A | 2 | 79 | 11495 | 79.32 | 679 | 665 | 136.5 |
| B | 5 | 236 | 872501 | 6811.5 | 657 | 640 | 128.0 |
| B | 5 | 172 | 710422 | 5545.25 | 657 | 640 | 128.0 |
| B | 0 | 189 | 156794 | 1219.97 | 657 | 640 | 128.0 |
| C | 15 | 214 | 252403 | 1628.81 | 662 | 666 | 154.6 |
| C | 0 | 10 | 178974 | 1153.7 | 662 | 666 | 154.6 |
| C | 13 | 61 | 4486 | 24.72 | 662 | 666 | 154.6 |
| D | 12 | 6 | 288072 | 1783.46 | 658 | 640 | 161.2 |
| D | 13 | 171 | 105865 | 652.9 | 658 | 640 | 161.2 |
| D | 2 | 249 | 104809 | 646.35 | 658 | 640 | 161.2 |
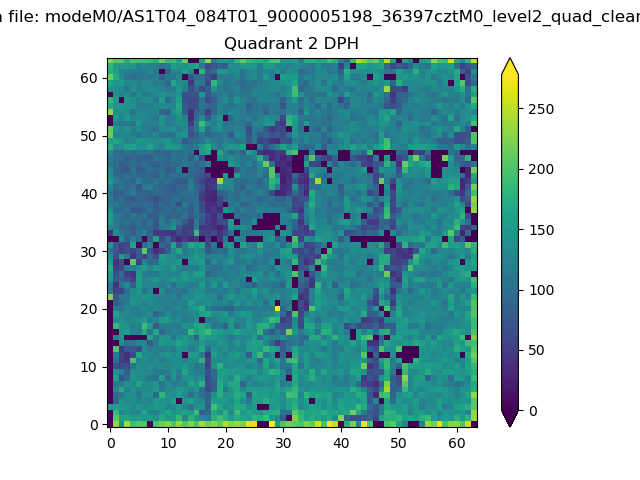
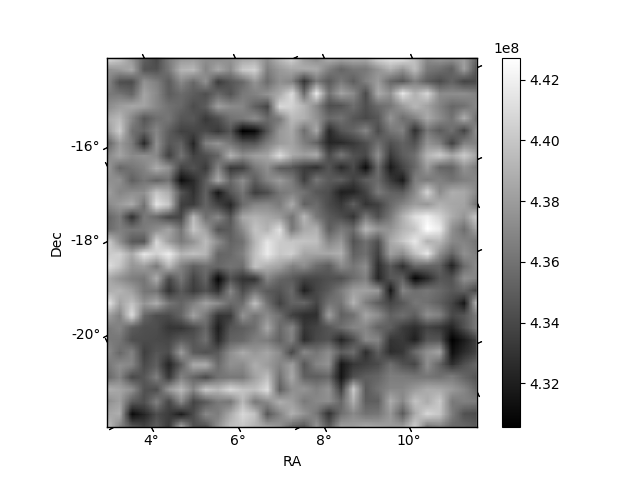
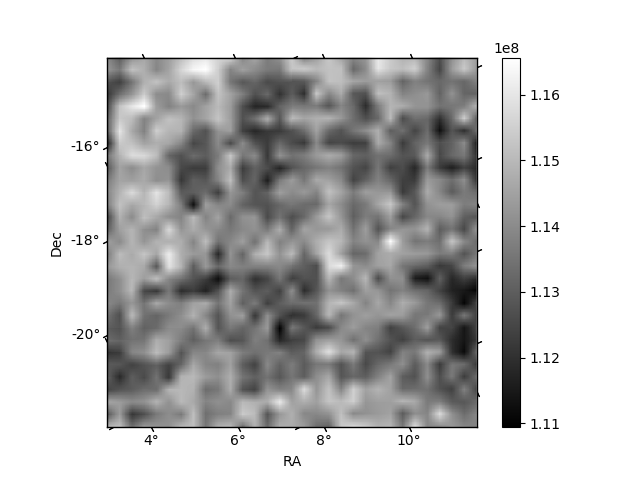
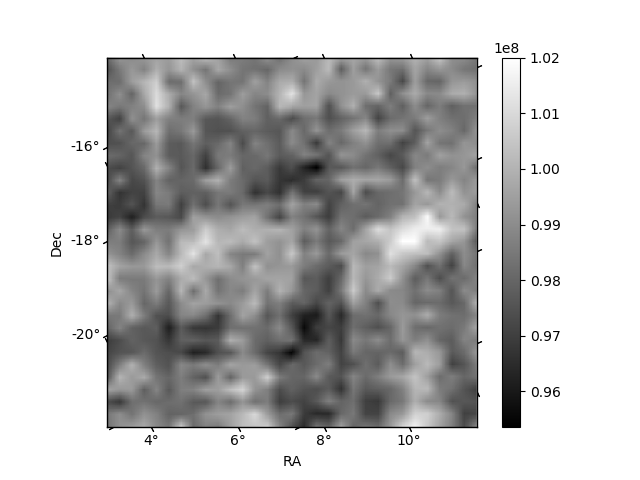
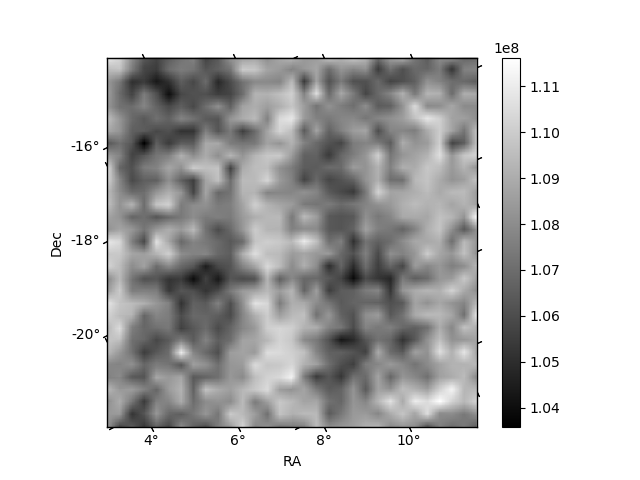
Histogram calculated using DETX and DETY for each event in the final _common_clean file
| Quadrant A | 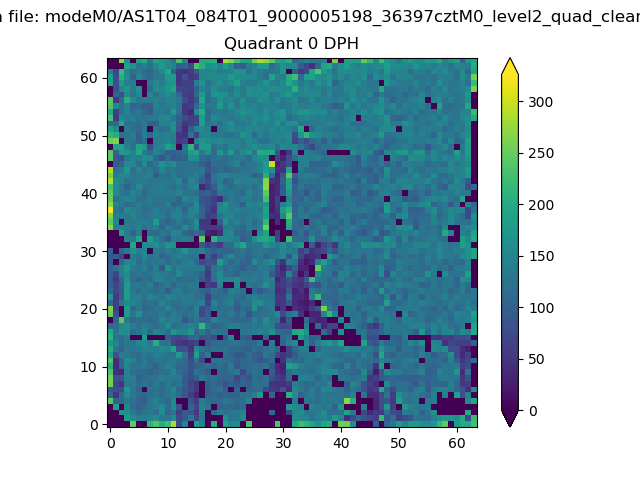 |
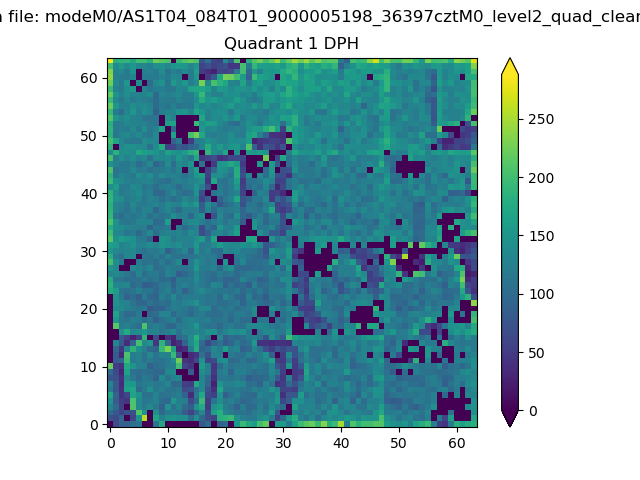 |
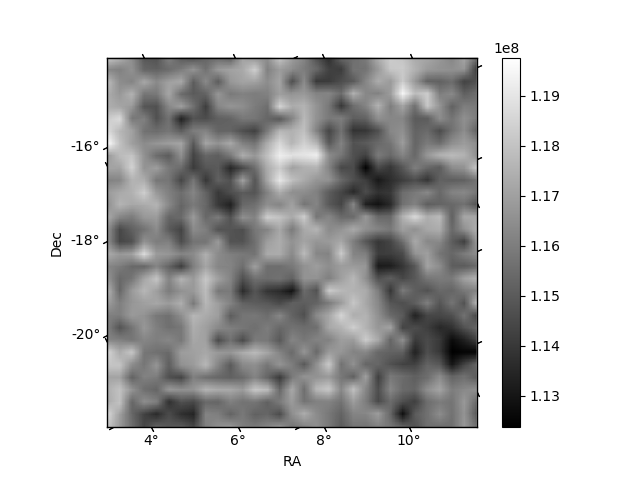
Quadrant B |
|---|---|---|---|
| Quadrant D | 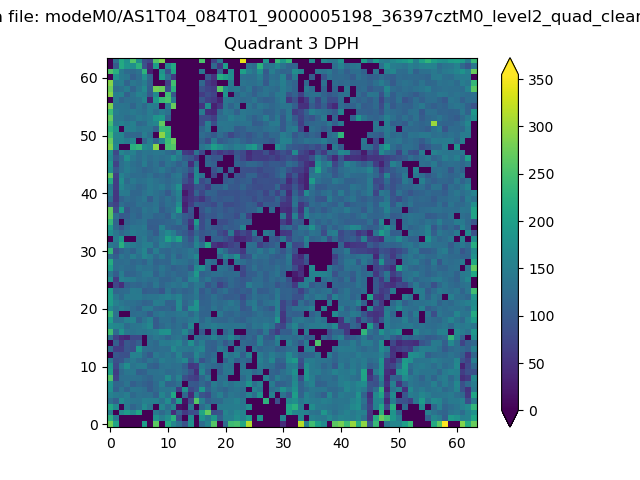 |
 |
Quadrant C |
| Plot type | Count rate plots | Images |
|---|---|---|
| Comparison with Poisson distribution Blue bars denote a histogram of data divided into 1 sec bins. Red curve is a Poisson curve with rate = median count rate of data. |
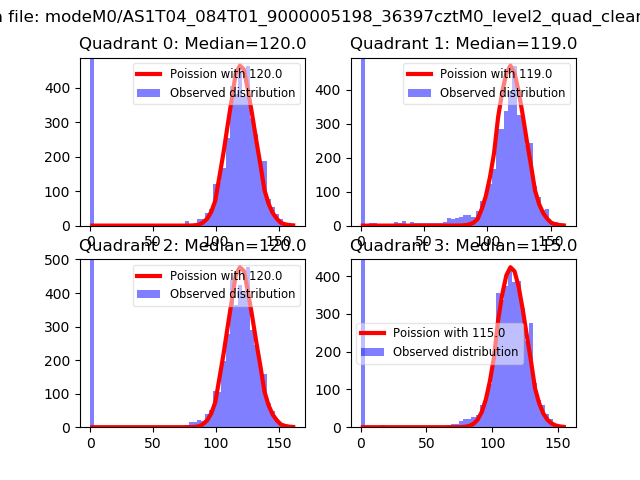 |
 |
| Quadrant-wise count rates Data is divided into 100 sec bins |
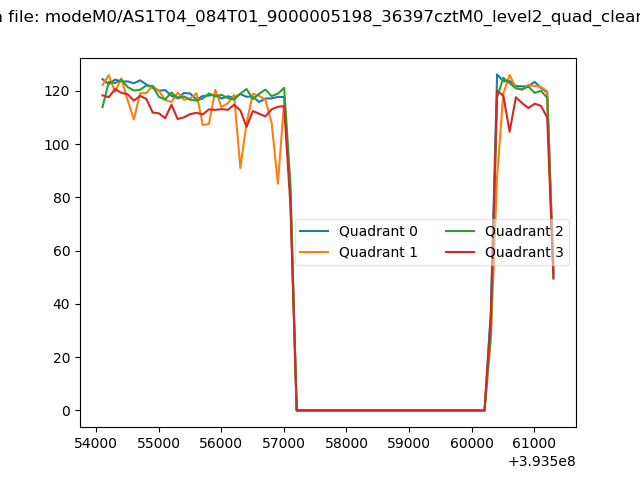 |
|
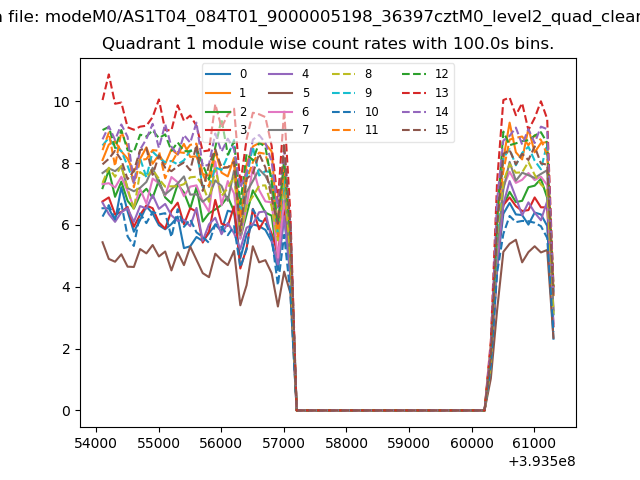
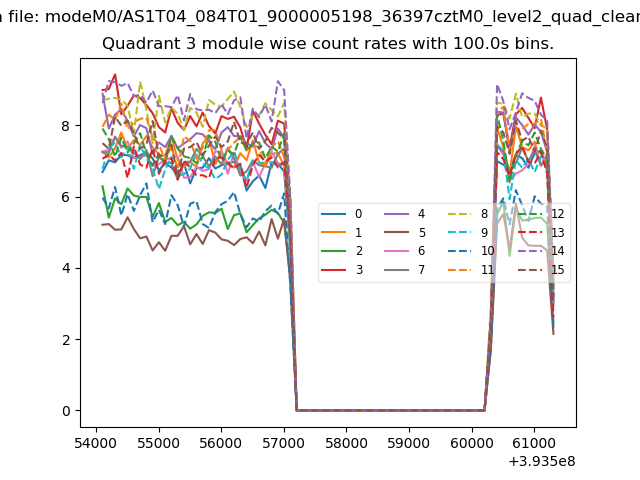
| Module-wise count rates for Quadrant A Data is divided into 100 sec bins |
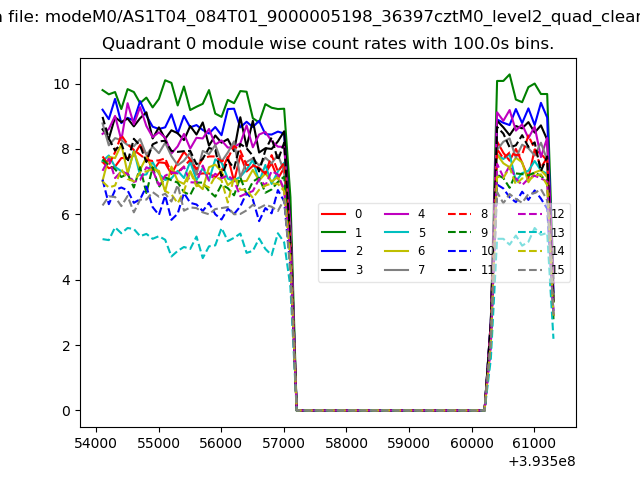 |
 |
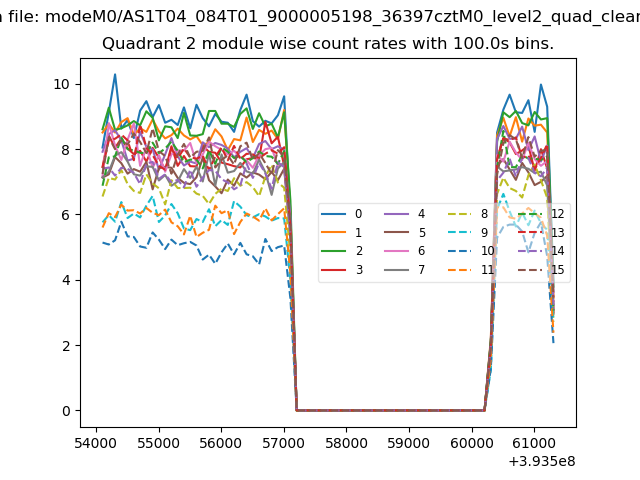
| Module-wise count rates for Quadrant B Data is divided into 100 sec bins |
 |
 |
| Module-wise count rates for Quadrant C Data is divided into 100 sec bins |
 |
 |
| Module-wise count rates for Quadrant D Data is divided into 100 sec bins |
 |
 |
| Parameter | Plot |
|---|---|
| CZT HV Monitor | 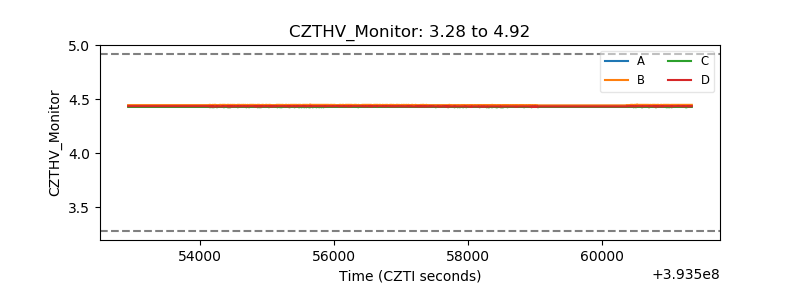 |
| D_VDD | 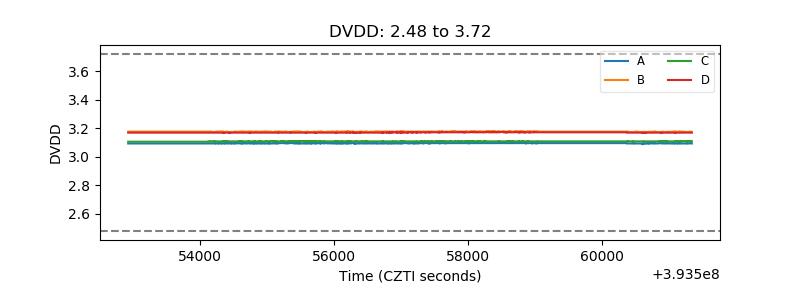 |
| Temperature 1 | 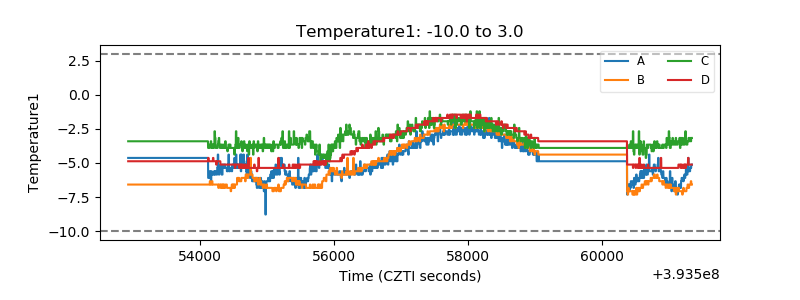 |
| Veto HV Monitor | 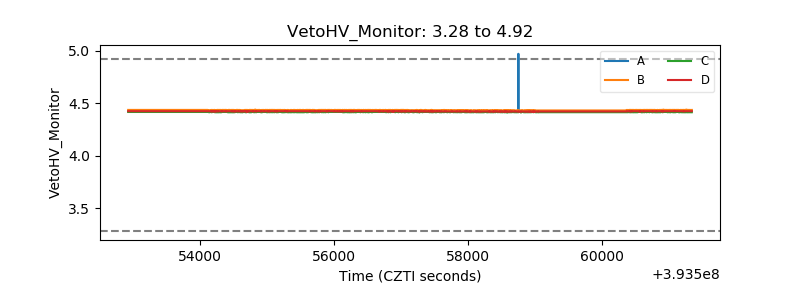 |
| Veto LLD | 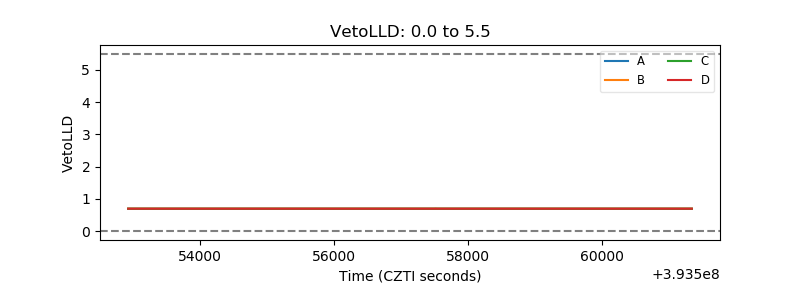 |
| Alpha Counter | 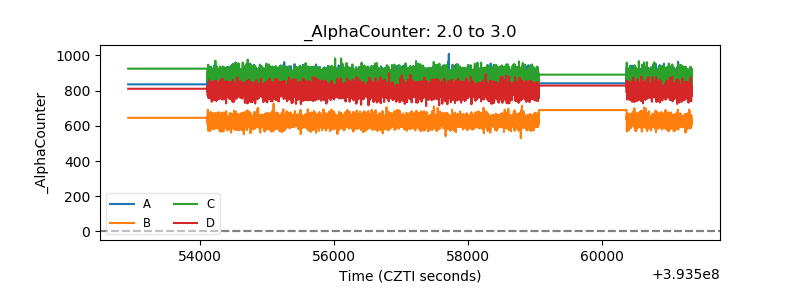 |
| _CPM_Rate | 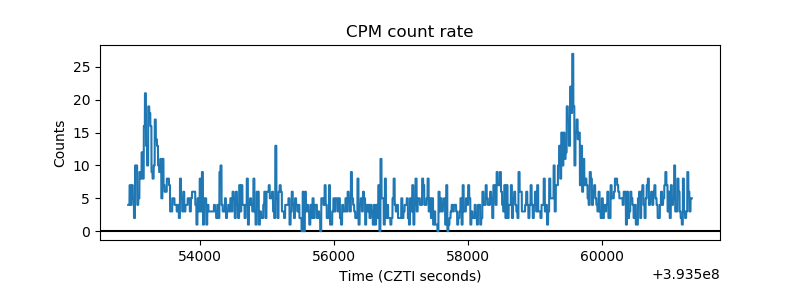 |
| CZT Counter | 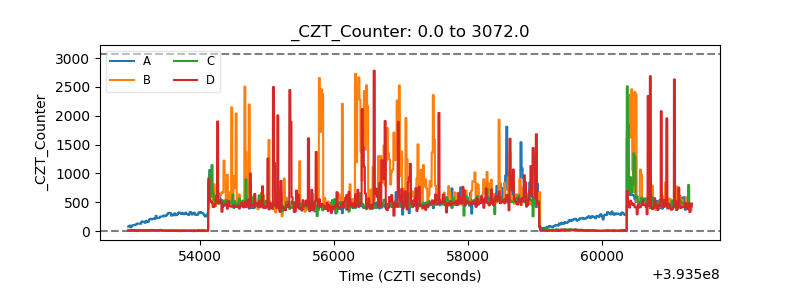 |
| +2.5 Volts monitor | 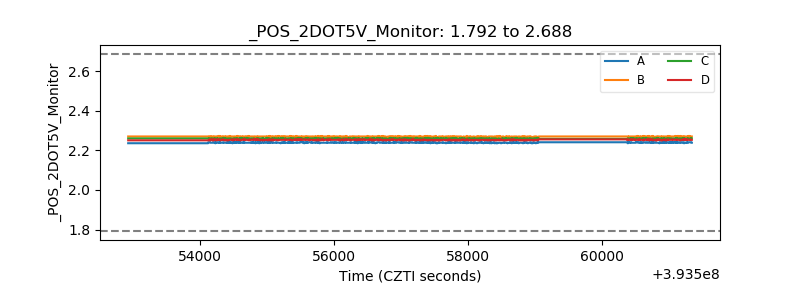 |
| +5 Volts monitor | 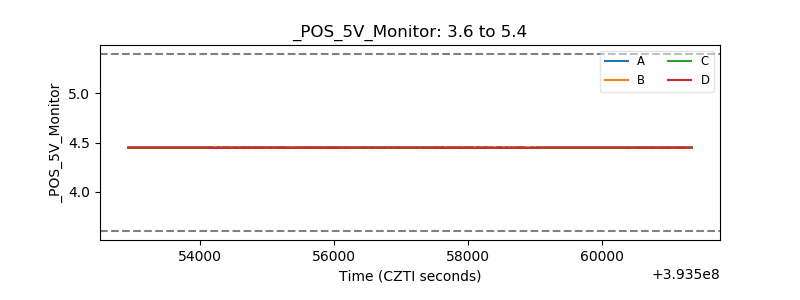 |
| _ROLL_ROT | 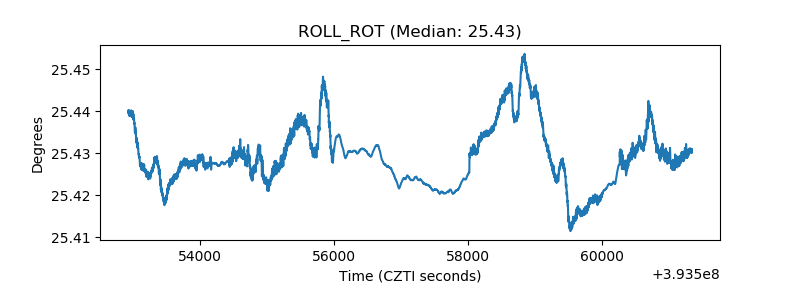 |
| _Roll_DEC | 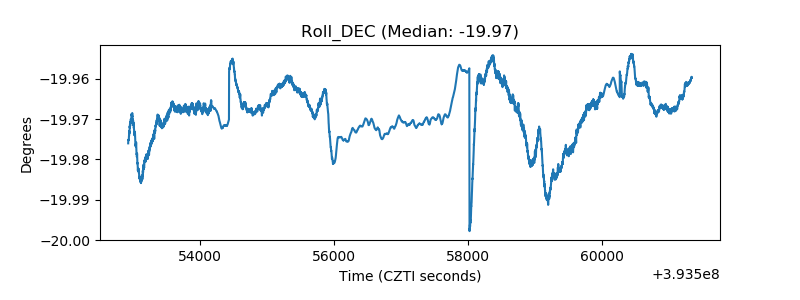 |
| _Roll_RA | 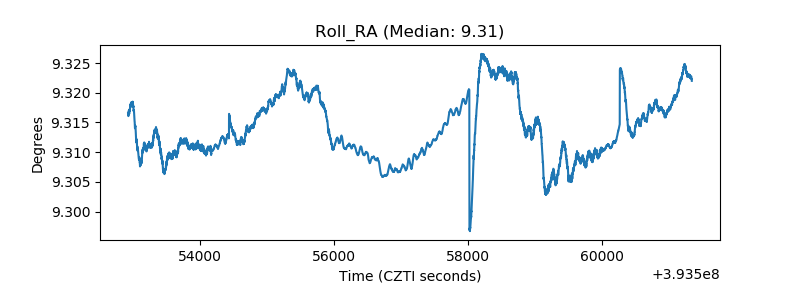 |
| Veto Counter | 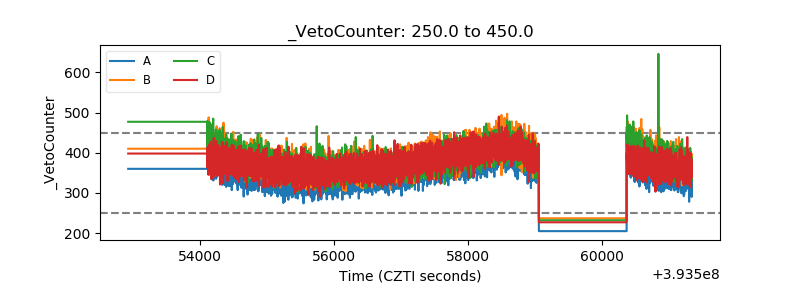 |