| Param | Original file | Final file |
|---|---|---|
| Filename | modeM0/AS1T04_084T01_9000005198_36393cztM0_level2.evt | modeM0/AS1T04_084T01_9000005198_36393cztM0_level2_quad_clean.evt |
| Size (bytes) | 437,362,560 | 63,285,120 |
| Size | 417.1 MB | 60.4 MB |
| Events in quadrant A | 2,882,071 | 409,053 |
| Events in quadrant B | 4,189,236 | 379,233 |
| Events in quadrant C | 2,695,942 | 401,642 |
| Events in quadrant D | 3,143,396 | 380,079 |
| Mode M0 | |||
|---|---|---|---|
| Quadrant | BADHDUFLAG | Total packets | Discarded packets |
| A | 0 | 11729 | 3 |
| B | 0 | 15711 | 2 |
| C | 0 | 10656 | 2 |
| D | 0 | 12448 | 2 |
| Mode SS | |||
|---|---|---|---|
| Quadrant | BADHDUFLAG | Total packets | Discarded packets |
| A | 0 | 100 | 0 |
| B | 0 | 100 | 0 |
| C | 0 | 100 | 0 |
| D | 0 | 100 | 0 |
| Mode M9 | |||
|---|---|---|---|
| Quadrant | BADHDUFLAG | Total packets | Discarded packets |
| A | 0 | 32 | 0 |
| B | 0 | 32 | 0 |
| C | 0 | 32 | 0 |
| D | 0 | 33 | 0 |
| Quadrant | Total seconds | Saturated seconds | Saturation percentage |
|---|---|---|---|
| A | 4932 | 45 | 0.912409% |
| B | 4932 | 502 | 10.178427% |
| C | 4932 | 72 | 1.459854% |
| D | 4932 | 137 | 2.777778% |
Noise dominated data is calculated using 1-second bins in cleaned event files. If a bin has >2000 counts, and if more than 50% of those come from <1% of pixels, then it is considered to be noise-dominated and hence unusable.
| Quadrant | # 1 sec bins | Bins with >0 counts | Bins with >2000 counts | High rate bins dominated by noise | Noise dominated (total time) | Noise dominated (detector-on time) | Marked lightcurve |
|---|---|---|---|---|---|---|---|
| A | 7024 | 4933 | 13 | 13 | 0.19% | 0.26% | 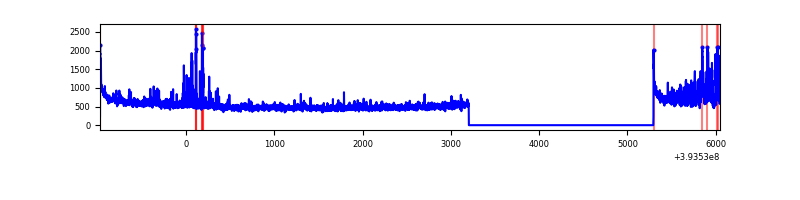 |
| B | 7024 | 4933 | 360 | 360 | 5.13% | 7.30% | 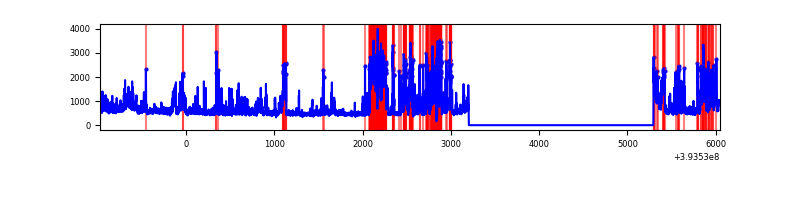 |
| C | 7024 | 4933 | 55 | 55 | 0.78% | 1.11% | 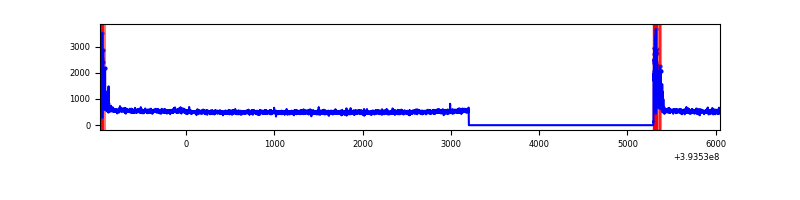 |
| D | 7024 | 4933 | 139 | 139 | 1.98% | 2.82% | 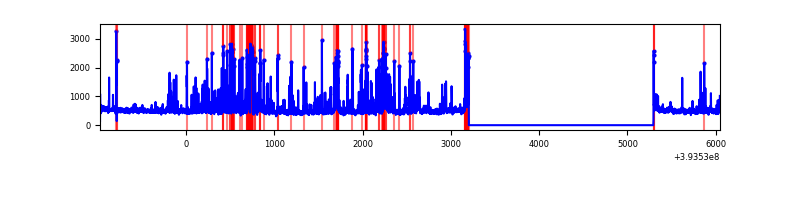 |
Top three noisy pixels from each quadrant. If the there are fewer than three noisy pixels in the level2.evt file, extra rows are filled as -1
| Pixel properties | Quadrant properties | ||||||
|---|---|---|---|---|---|---|---|
| Quadrant | DetID | PixID | Counts | Sigma | Mean | Median | Sigma |
| A | 15 | 223 | 350231 | 2880.16 | 605 | 595 | 121.4 |
| A | 10 | 83 | 178737 | 1467.46 | 605 | 595 | 121.4 |
| A | 13 | 254 | 8995 | 69.2 | 605 | 595 | 121.4 |
| B | 5 | 172 | 1226139 | 11125.43 | 574 | 558 | 110.2 |
| B | 8 | 128 | 211944 | 1918.89 | 574 | 558 | 110.2 |
| B | 4 | 232 | 171244 | 1549.43 | 574 | 558 | 110.2 |
| C | 15 | 214 | 213728 | 1570.21 | 585 | 592 | 135.7 |
| C | 0 | 10 | 194762 | 1430.49 | 585 | 592 | 135.7 |
| C | 7 | 222 | 5527 | 36.36 | 585 | 592 | 135.7 |
| D | 12 | 6 | 369977 | 2601.23 | 584 | 568 | 142.0 |
| D | 13 | 171 | 158152 | 1109.64 | 584 | 568 | 142.0 |
| D | 2 | 249 | 116311 | 815.02 | 584 | 568 | 142.0 |
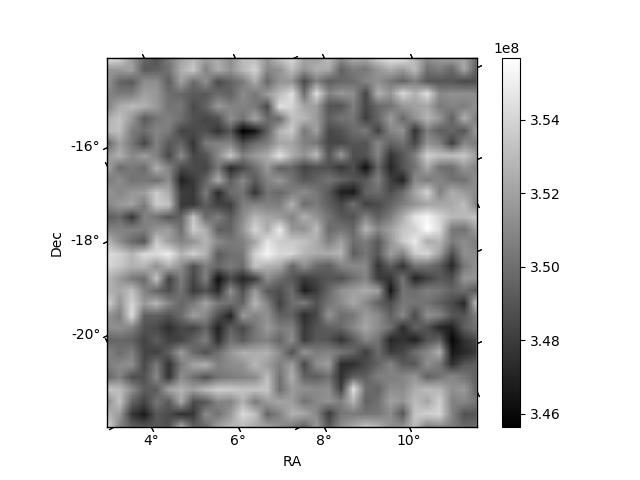
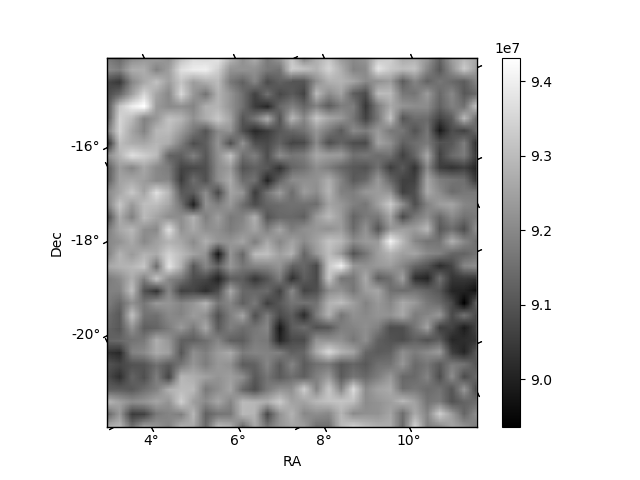
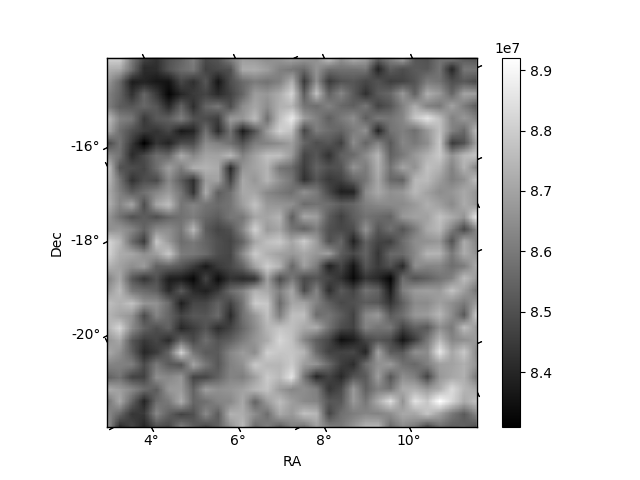
Histogram calculated using DETX and DETY for each event in the final _common_clean file
| Quadrant A | 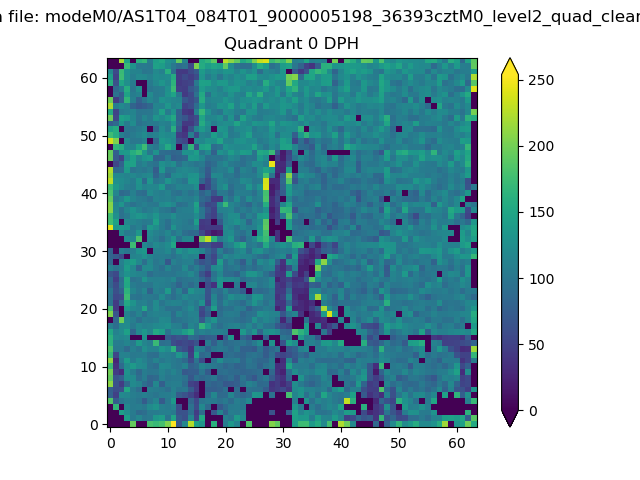 |
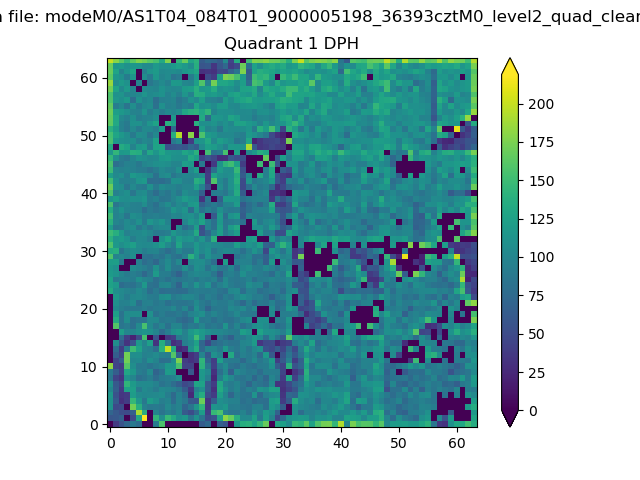 |
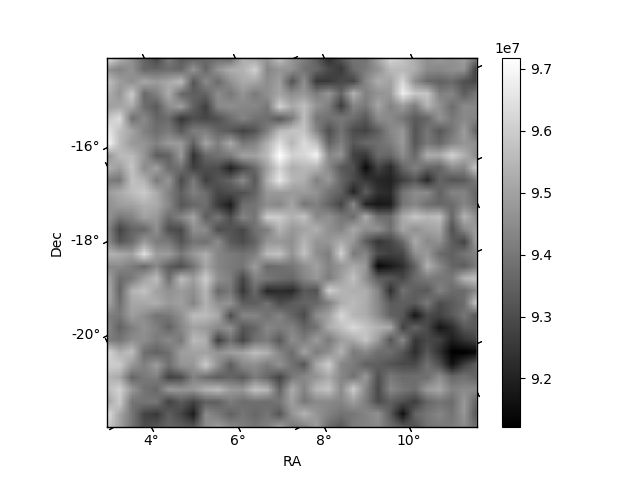
Quadrant B |
|---|---|---|---|
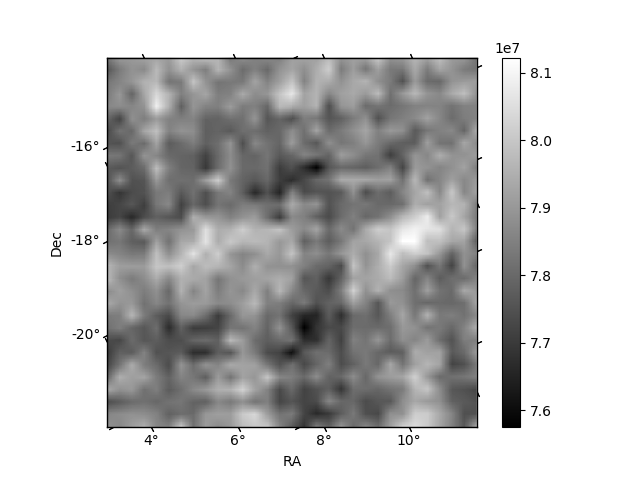
| Quadrant D | 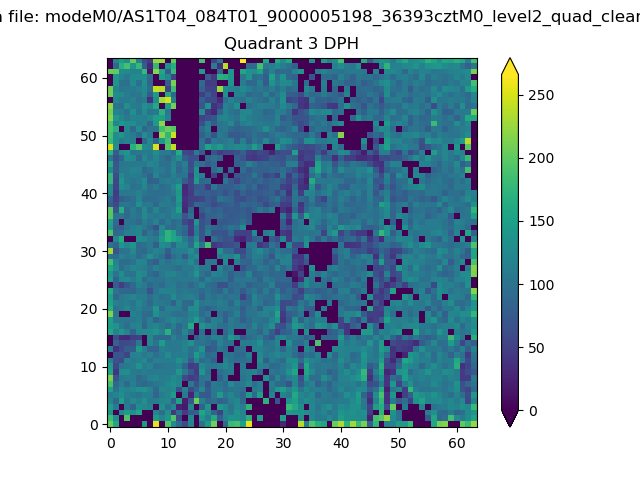 |
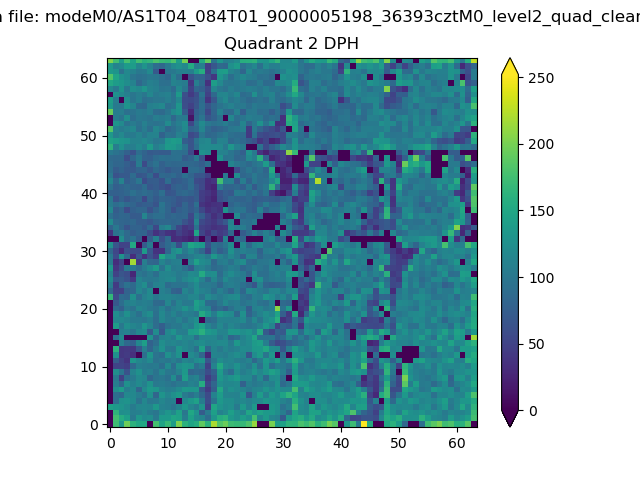 |
Quadrant C |
| Plot type | Count rate plots | Images |
|---|---|---|
| Comparison with Poisson distribution Blue bars denote a histogram of data divided into 1 sec bins. Red curve is a Poisson curve with rate = median count rate of data. |
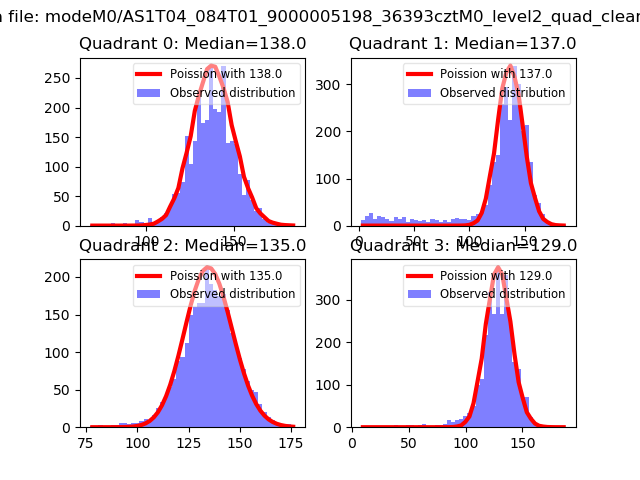 |
 |
| Quadrant-wise count rates Data is divided into 100 sec bins |
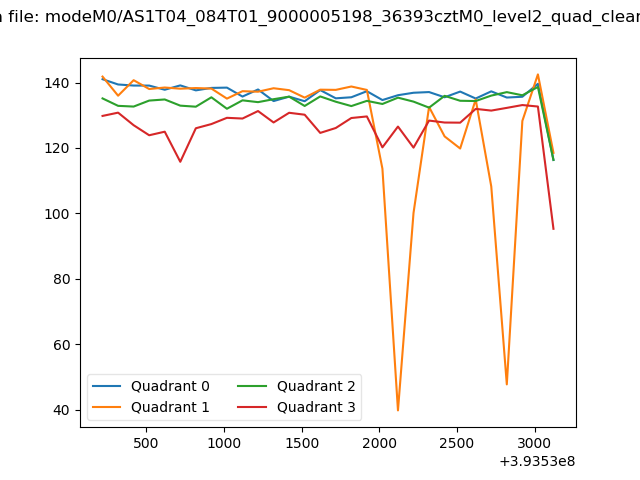 |
|
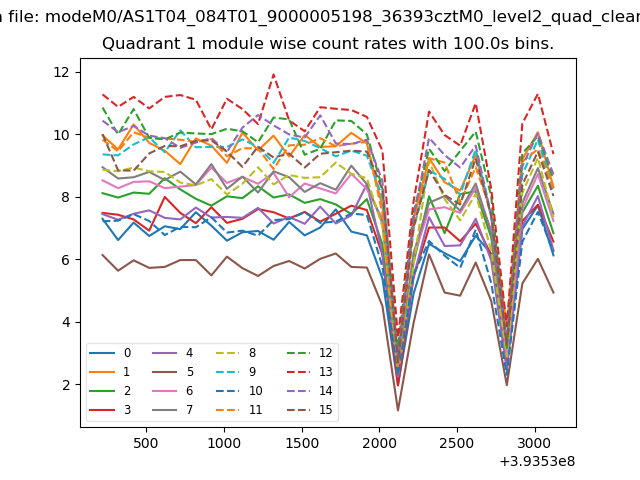
| Module-wise count rates for Quadrant A Data is divided into 100 sec bins |
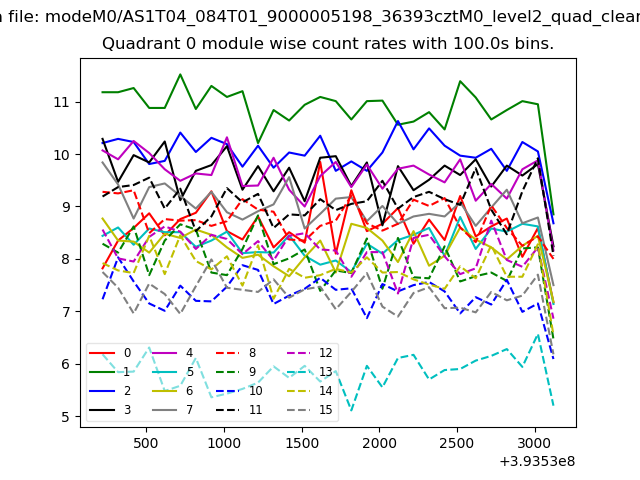 |
 |
| Module-wise count rates for Quadrant B Data is divided into 100 sec bins |
 |
 |
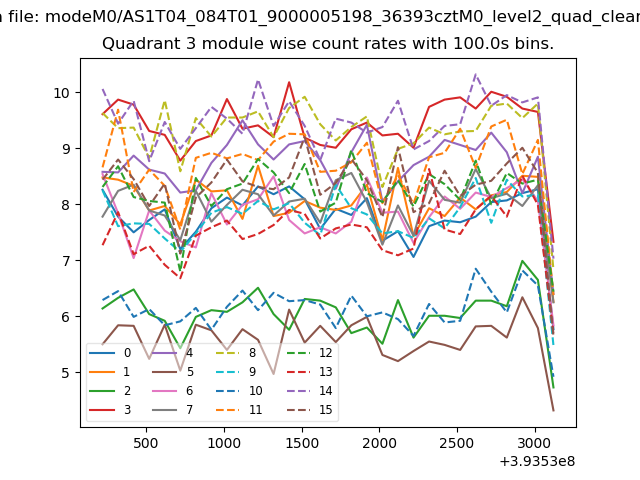
| Module-wise count rates for Quadrant C Data is divided into 100 sec bins |
 |
 |
| Module-wise count rates for Quadrant D Data is divided into 100 sec bins |
 |
 |
| Parameter | Plot |
|---|---|
| CZT HV Monitor | 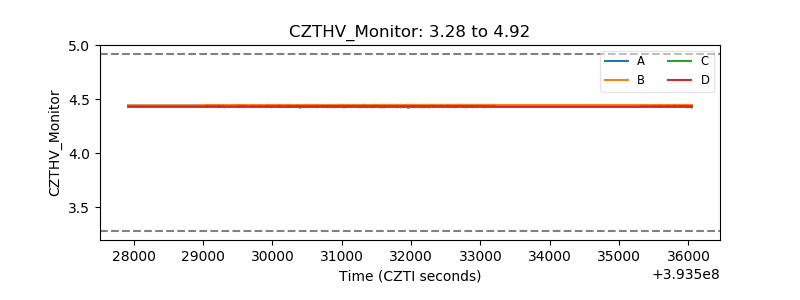 |
| D_VDD | 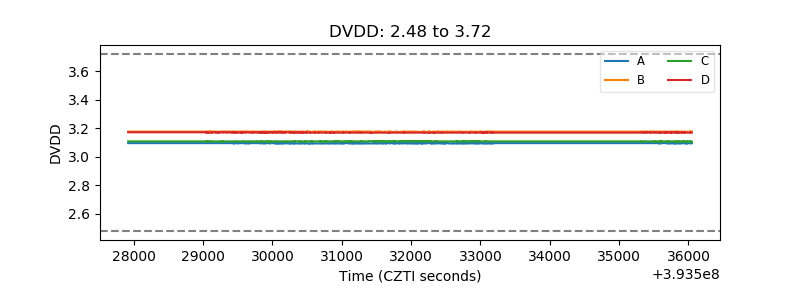 |
| Temperature 1 | 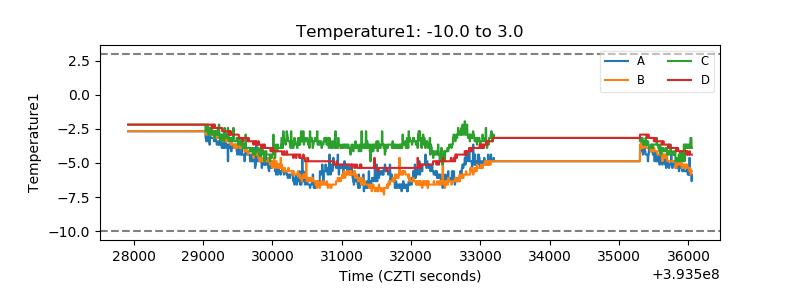 |
| Veto HV Monitor | 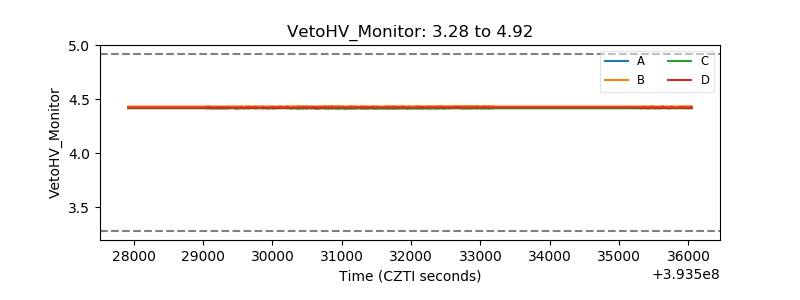 |
| Veto LLD | 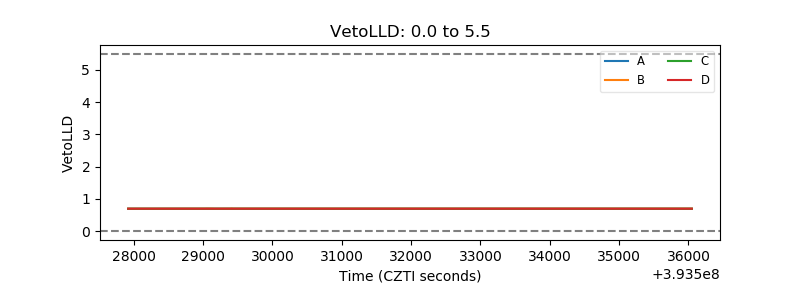 |
| Alpha Counter | 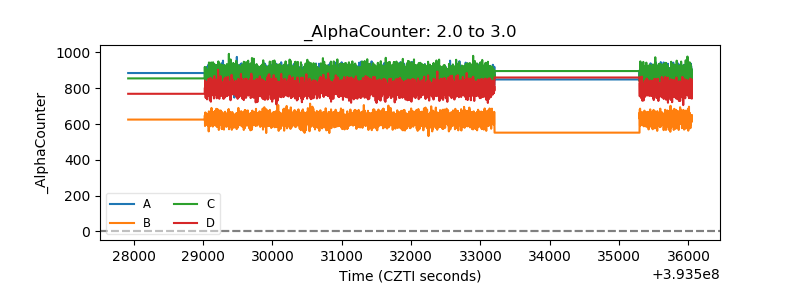 |
| _CPM_Rate | 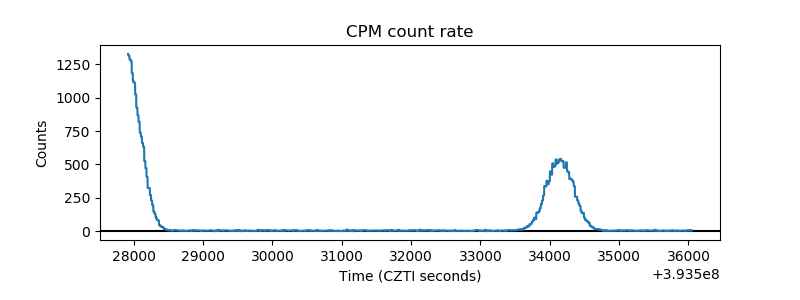 |
| CZT Counter | 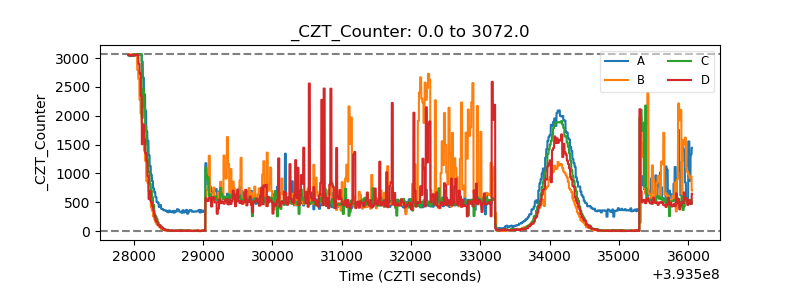 |
| +2.5 Volts monitor | 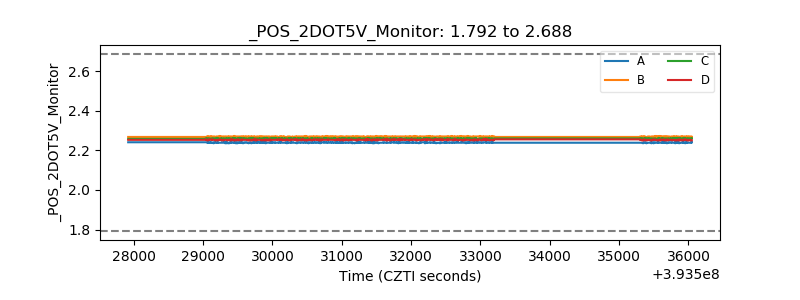 |
| +5 Volts monitor | 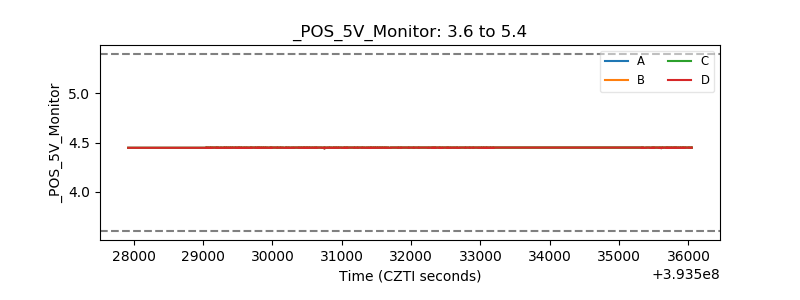 |
| _ROLL_ROT | 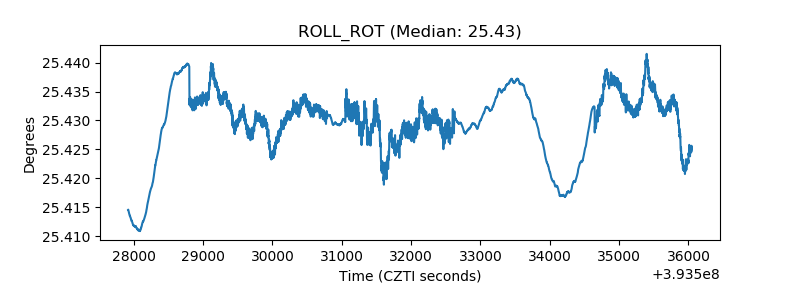 |
| _Roll_DEC | 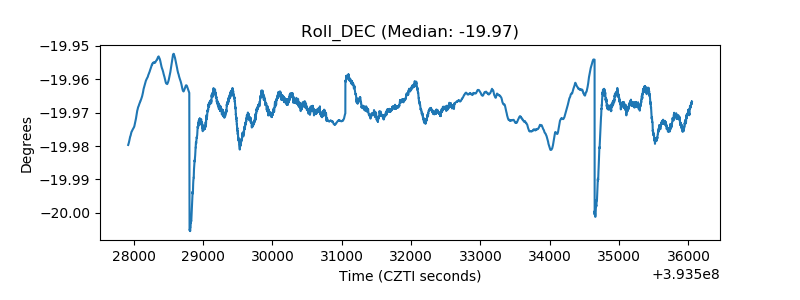 |
| _Roll_RA | 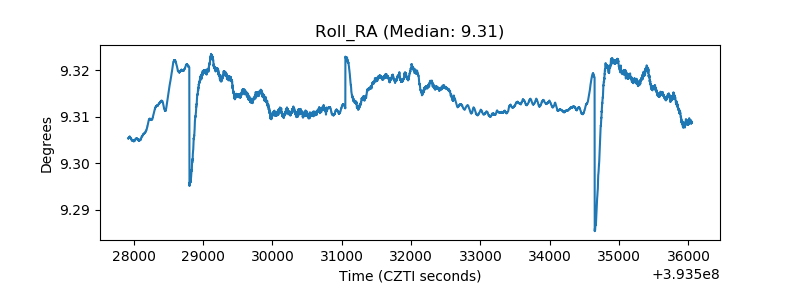 |
| Veto Counter | 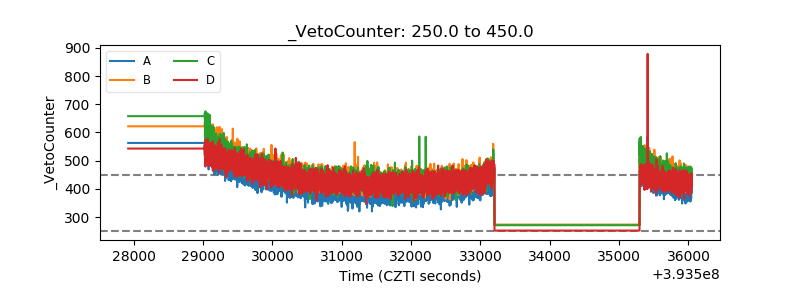 |