| Param | Original file | Final file |
|---|---|---|
| Filename | modeM0/AS1A11_097T24_9000005196_36389cztM0_level2.evt | modeM0/AS1A11_097T24_9000005196_36389cztM0_level2_quad_clean.evt |
| Size (bytes) | 427,296,960 | 50,040,000 |
| Size | 407.5 MB | 47.7 MB |
| Events in quadrant A | 2,862,711 | 295,748 |
| Events in quadrant B | 3,140,831 | 293,440 |
| Events in quadrant C | 2,933,789 | 280,143 |
| Events in quadrant D | 3,636,686 | 267,465 |
| Mode SS | |||
|---|---|---|---|
| Quadrant | BADHDUFLAG | Total packets | Discarded packets |
| A | 0 | 110 | 0 |
| B | 0 | 110 | 0 |
| C | 0 | 110 | 0 |
| D | 0 | 110 | 0 |
| Mode M9 | |||
|---|---|---|---|
| Quadrant | BADHDUFLAG | Total packets | Discarded packets |
| A | 0 | 23 | 0 |
| B | 0 | 23 | 0 |
| C | 0 | 23 | 0 |
| D | 0 | 24 | 0 |
| Mode M0 | |||
|---|---|---|---|
| Quadrant | BADHDUFLAG | Total packets | Discarded packets |
| A | 0 | 11683 | 3 |
| B | 0 | 12594 | 2 |
| C | 0 | 11709 | 2 |
| D | 0 | 14320 | 2 |
| Quadrant | Total seconds | Saturated seconds | Saturation percentage |
|---|---|---|---|
| A | 5398 | 11 | 0.203779% |
| B | 5398 | 47 | 0.870693% |
| C | 5398 | 47 | 0.870693% |
| D | 5398 | 184 | 3.408670% |
Noise dominated data is calculated using 1-second bins in cleaned event files. If a bin has >2000 counts, and if more than 50% of those come from <1% of pixels, then it is considered to be noise-dominated and hence unusable.
| Quadrant | # 1 sec bins | Bins with >0 counts | Bins with >2000 counts | High rate bins dominated by noise | Noise dominated (total time) | Noise dominated (detector-on time) | Marked lightcurve |
|---|---|---|---|---|---|---|---|
| A | 7250 | 5399 | 1 | 1 | 0.01% | 0.02% | 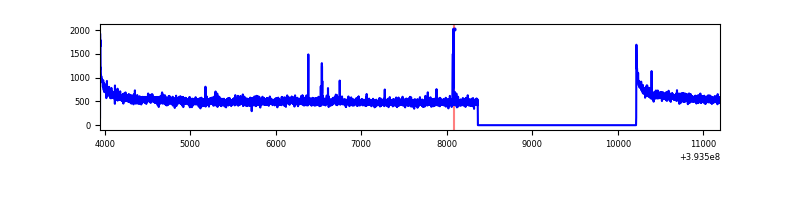 |
| B | 7250 | 5399 | 19 | 19 | 0.26% | 0.35% | 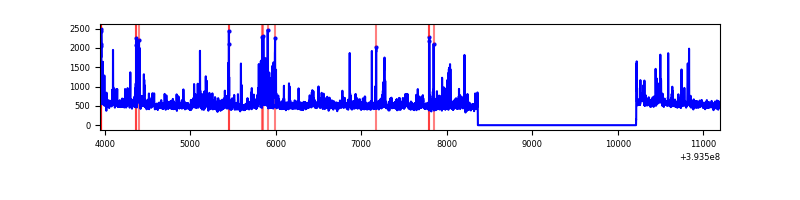 |
| C | 7250 | 5399 | 31 | 31 | 0.43% | 0.57% | 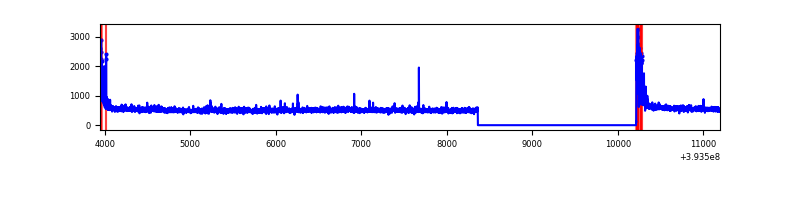 |
| D | 7250 | 5399 | 175 | 175 | 2.41% | 3.24% | 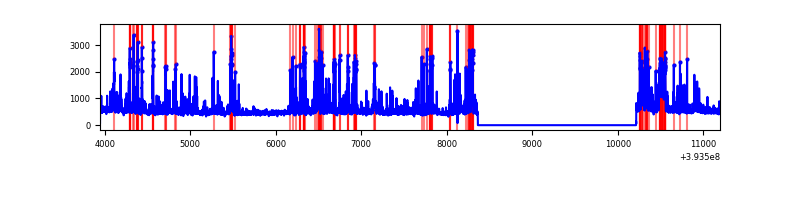 |
Top three noisy pixels from each quadrant. If the there are fewer than three noisy pixels in the level2.evt file, extra rows are filled as -1
| Pixel properties | Quadrant properties | ||||||
|---|---|---|---|---|---|---|---|
| Quadrant | DetID | PixID | Counts | Sigma | Mean | Median | Sigma |
| A | 10 | 83 | 190204 | 1384.64 | 681 | 670 | 136.9 |
| A | 7 | 3 | 14241 | 99.14 | 681 | 670 | 136.9 |
| A | 13 | 254 | 9489 | 64.43 | 681 | 670 | 136.9 |
| B | 5 | 172 | 178425 | 1397.21 | 667 | 650 | 127.2 |
| B | 0 | 189 | 100604 | 785.58 | 667 | 650 | 127.2 |
| B | 4 | 232 | 78295 | 610.25 | 667 | 650 | 127.2 |
| C | 15 | 214 | 230780 | 1537.18 | 648 | 653 | 149.7 |
| C | 0 | 10 | 163160 | 1085.5 | 648 | 653 | 149.7 |
| C | 0 | 207 | 13060 | 82.87 | 648 | 653 | 149.7 |
| D | 12 | 6 | 609106 | 3871.88 | 648 | 632 | 157.2 |
| D | 12 | 227 | 135687 | 859.39 | 648 | 632 | 157.2 |
| D | 13 | 249 | 105940 | 670.1 | 648 | 632 | 157.2 |
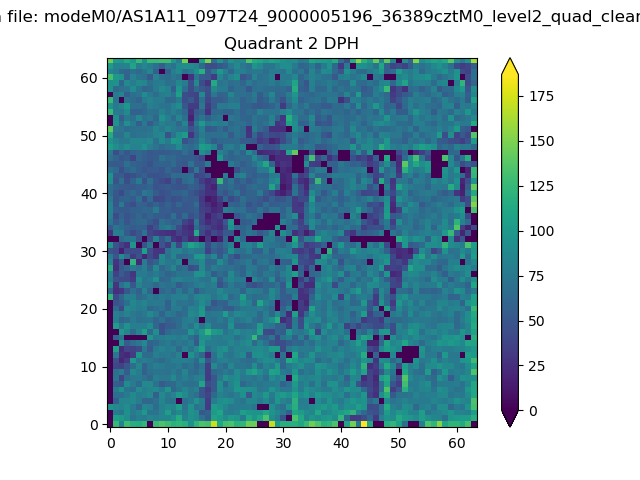
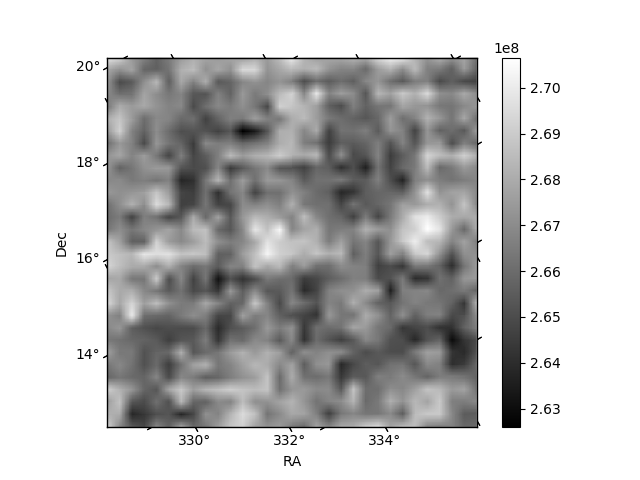
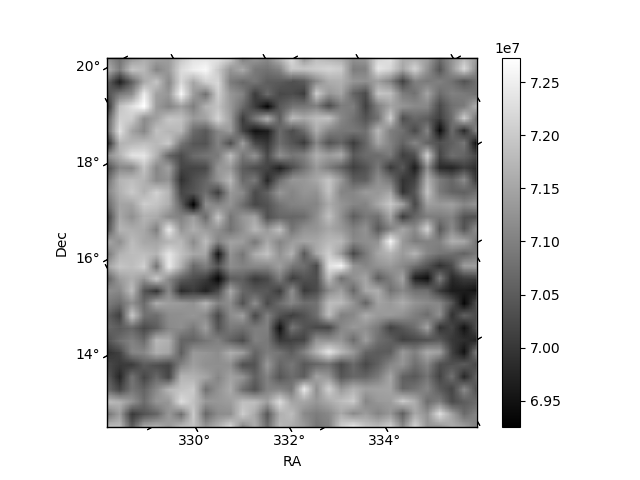
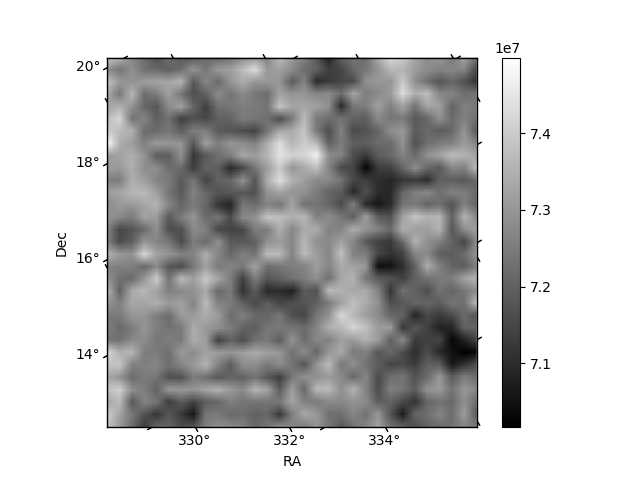
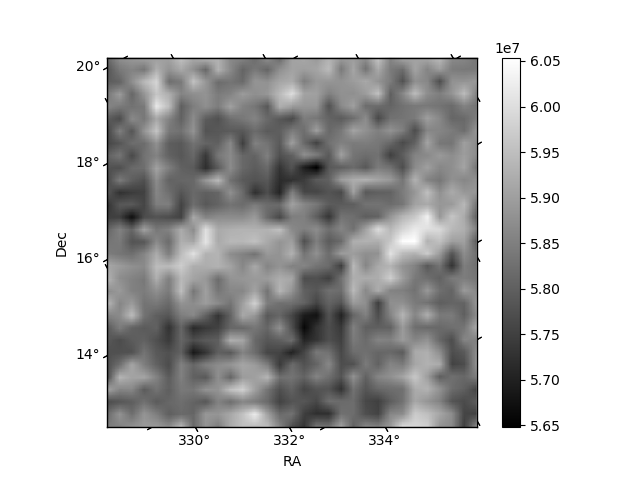
Histogram calculated using DETX and DETY for each event in the final _common_clean file
| Quadrant A | 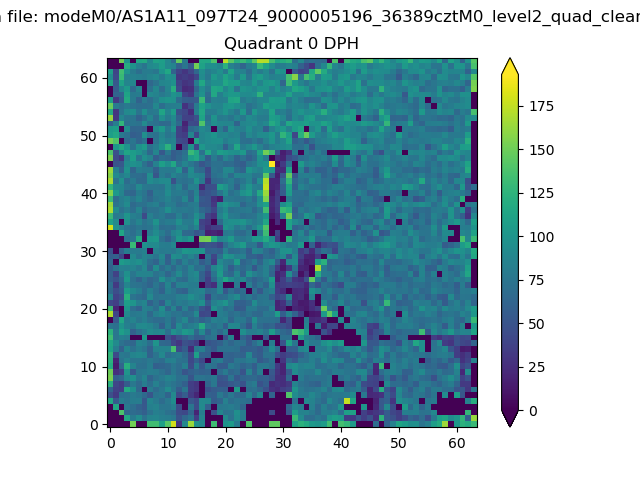 |
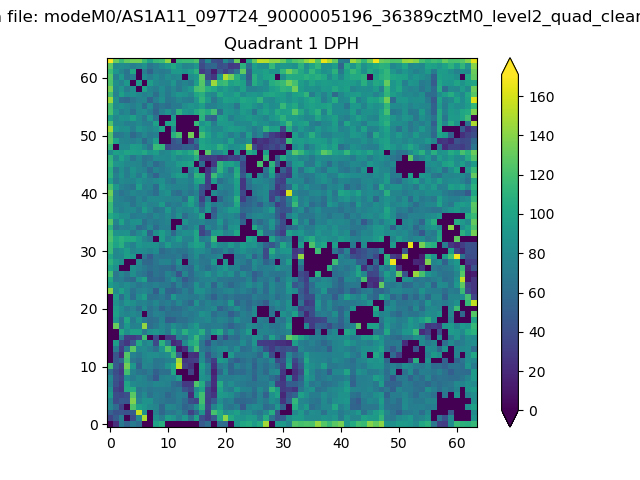 |
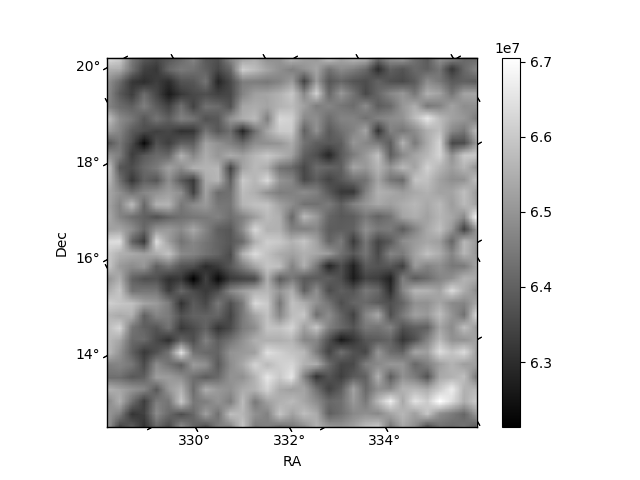
Quadrant B |
|---|---|---|---|
| Quadrant D | 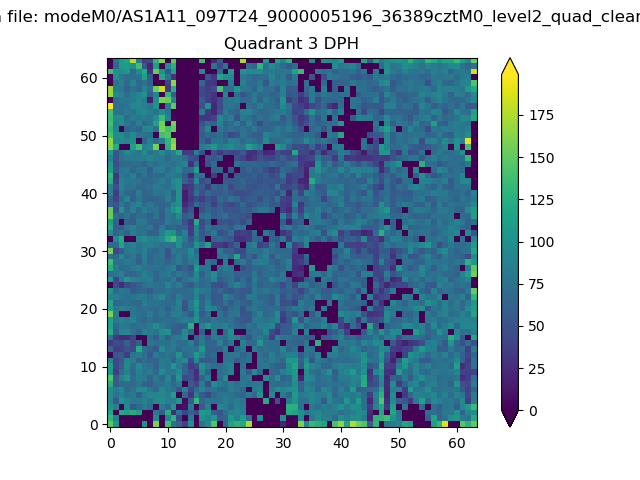 |
 |
Quadrant C |
| Plot type | Count rate plots | Images |
|---|---|---|
| Comparison with Poisson distribution Blue bars denote a histogram of data divided into 1 sec bins. Red curve is a Poisson curve with rate = median count rate of data. |
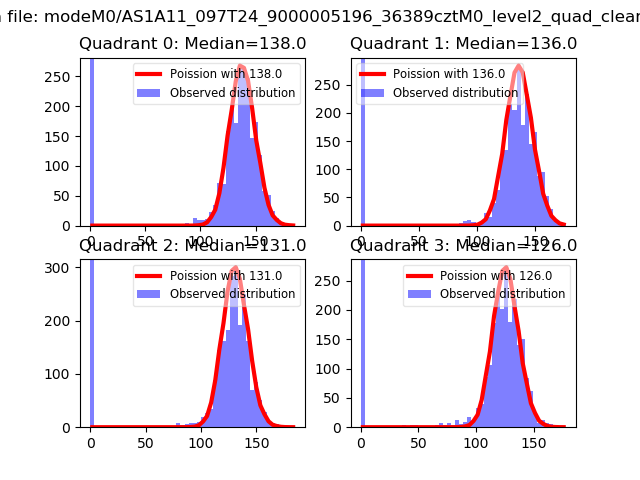 |
 |
| Quadrant-wise count rates Data is divided into 100 sec bins |
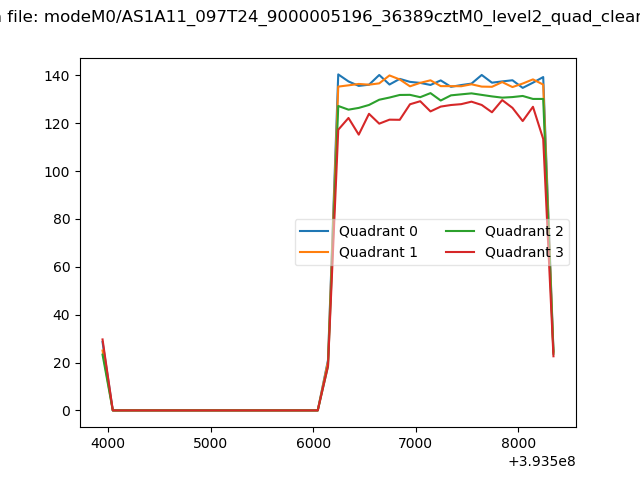 |
|
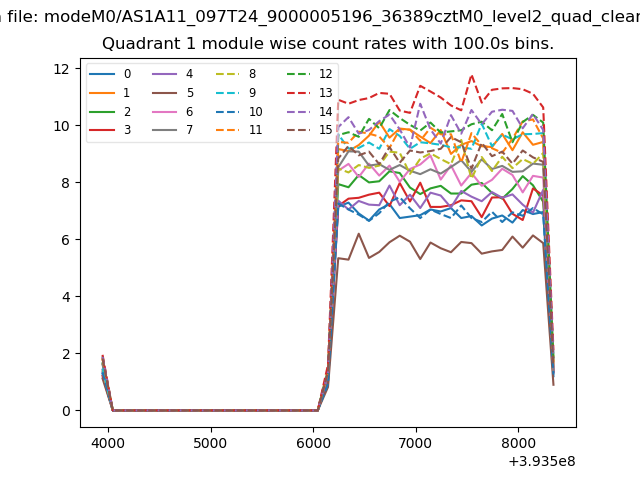
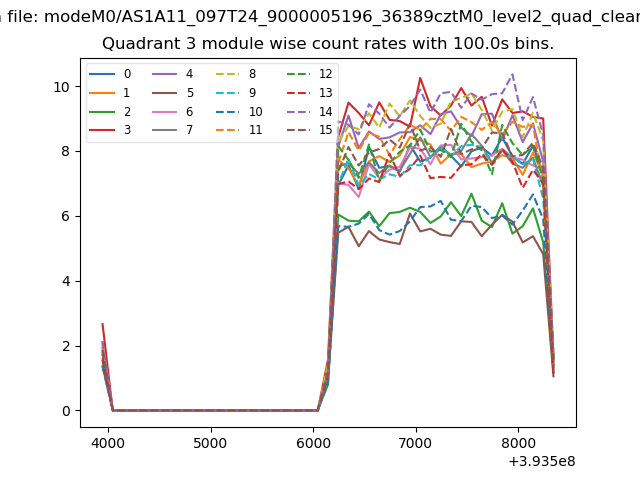
| Module-wise count rates for Quadrant A Data is divided into 100 sec bins |
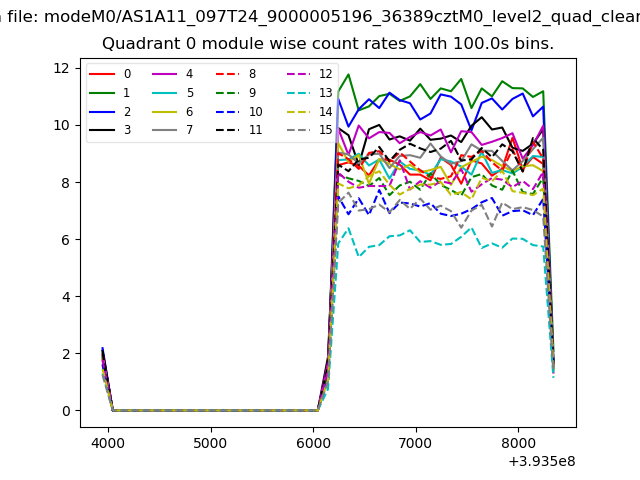 |
 |
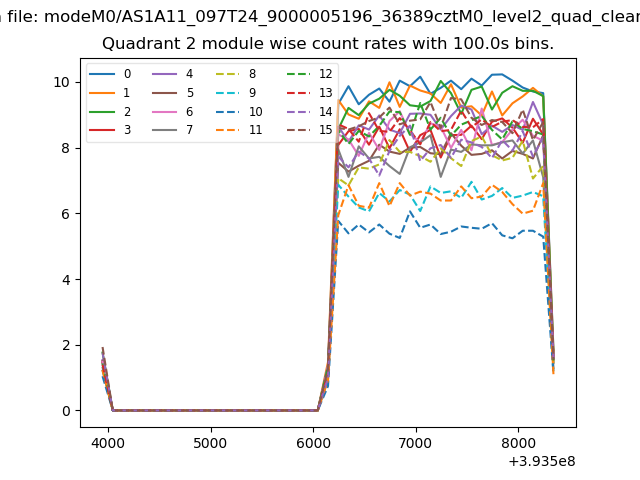
| Module-wise count rates for Quadrant B Data is divided into 100 sec bins |
 |
 |
| Module-wise count rates for Quadrant C Data is divided into 100 sec bins |
 |
 |
| Module-wise count rates for Quadrant D Data is divided into 100 sec bins |
 |
 |
| Parameter | Plot |
|---|---|
| CZT HV Monitor | 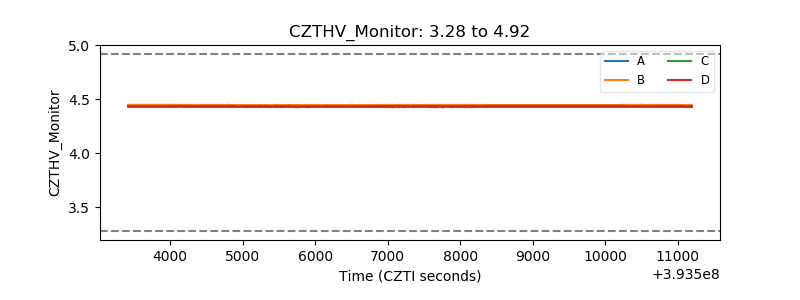 |
| D_VDD | 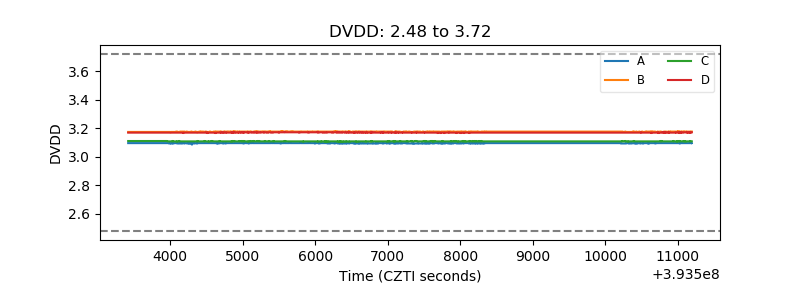 |
| Temperature 1 | 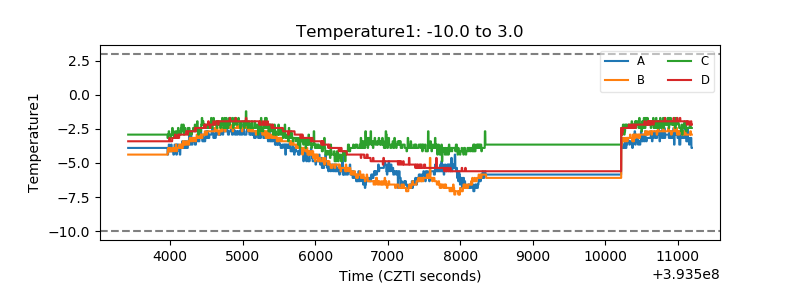 |
| Veto HV Monitor | 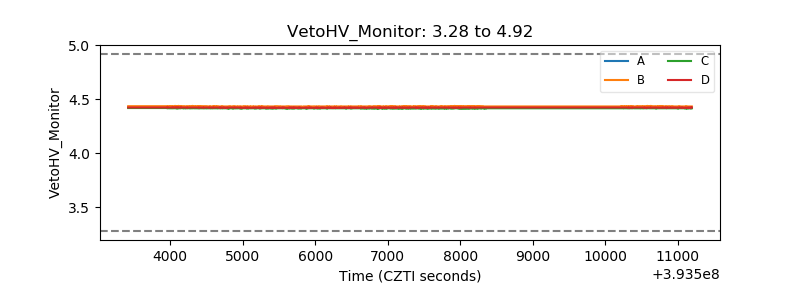 |
| Veto LLD | 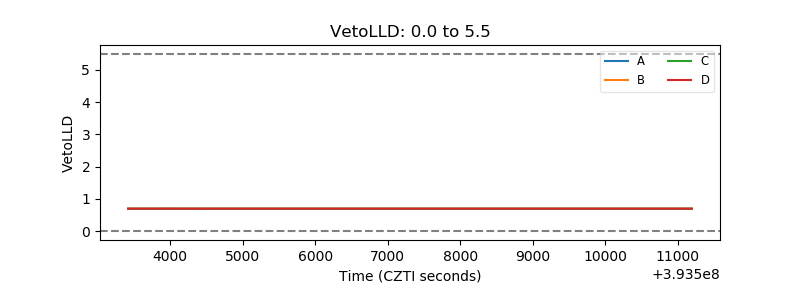 |
| Alpha Counter | 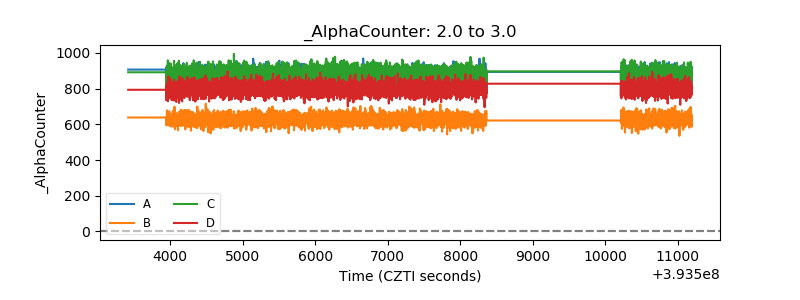 |
| _CPM_Rate |  |
| CZT Counter | 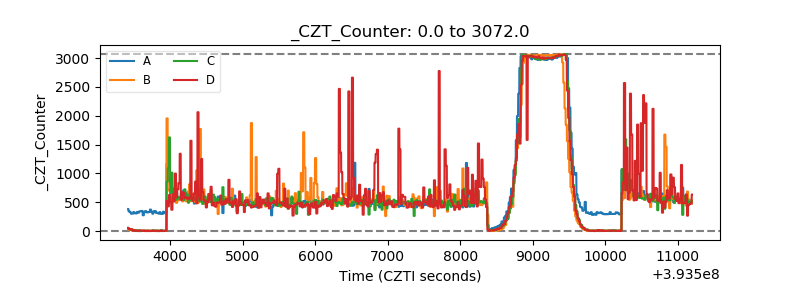 |
| +2.5 Volts monitor | 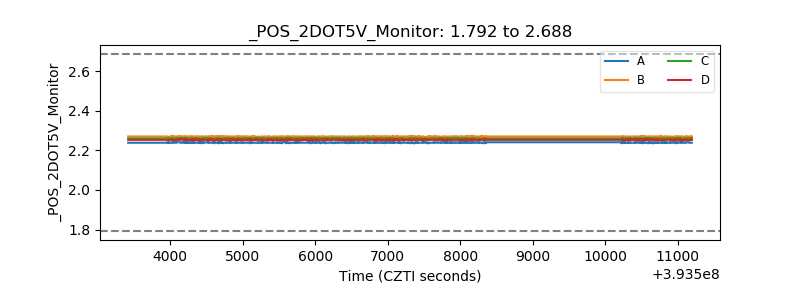 |
| +5 Volts monitor | 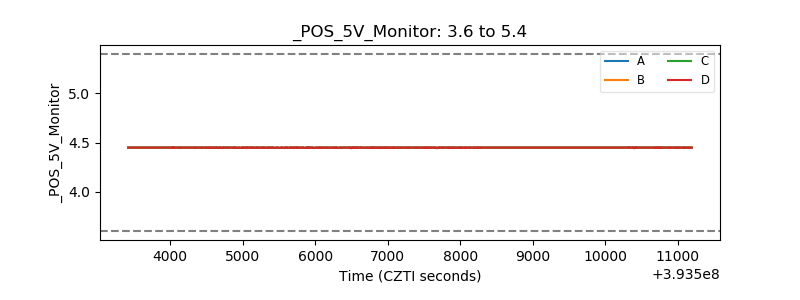 |
| _ROLL_ROT | 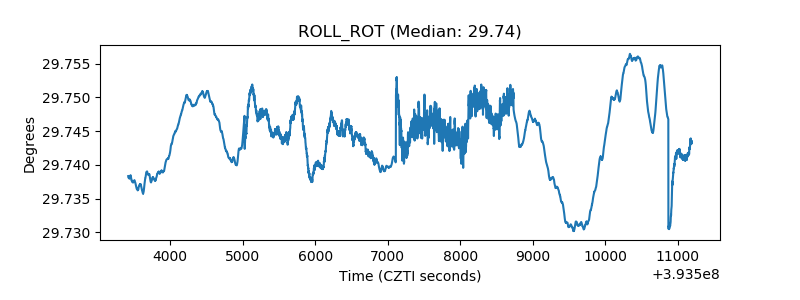 |
| _Roll_DEC | 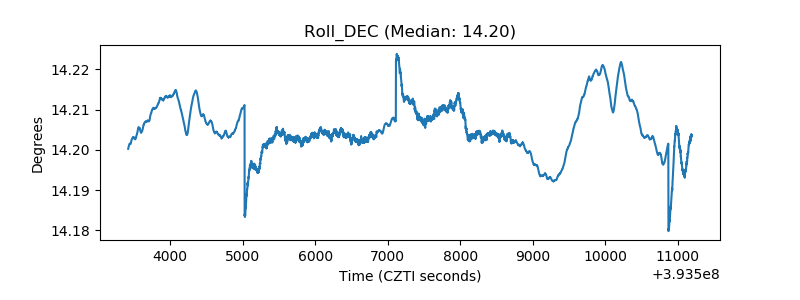 |
| _Roll_RA | 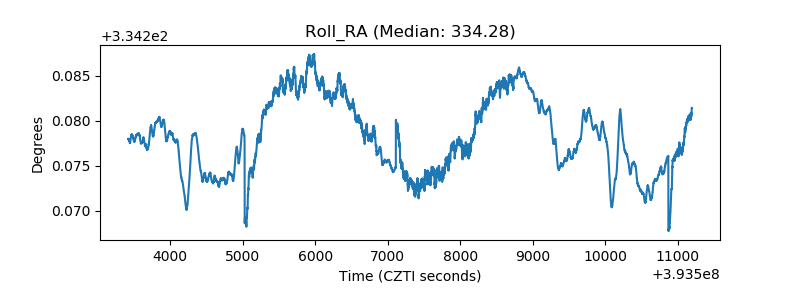 |
| Veto Counter | 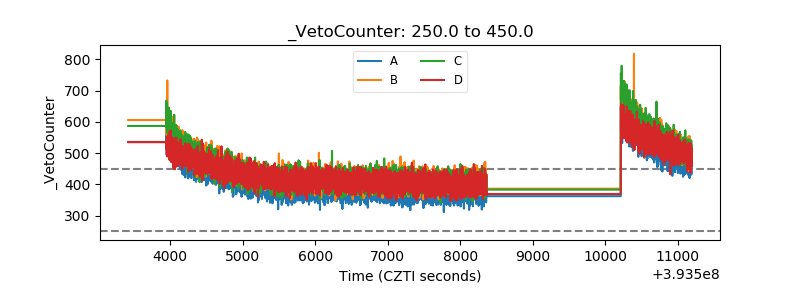 |