| Param | Original file | Final file |
|---|---|---|
| Filename | modeM0/AS1A11_097T24_9000005196_36388cztM0_level2.evt | modeM0/AS1A11_097T24_9000005196_36388cztM0_level2_quad_clean.evt |
| Size (bytes) | 451,080,000 | 51,802,560 |
| Size | 430.2 MB | 49.4 MB |
| Events in quadrant A | 2,846,992 | 304,415 |
| Events in quadrant B | 3,317,946 | 304,784 |
| Events in quadrant C | 3,171,259 | 292,628 |
| Events in quadrant D | 3,948,024 | 277,939 |
| Mode SS | |||
|---|---|---|---|
| Quadrant | BADHDUFLAG | Total packets | Discarded packets |
| A | 0 | 112 | 0 |
| B | 0 | 112 | 0 |
| C | 0 | 112 | 0 |
| D | 0 | 112 | 0 |
| Mode M9 | |||
|---|---|---|---|
| Quadrant | BADHDUFLAG | Total packets | Discarded packets |
| A | 0 | 23 | 0 |
| B | 0 | 23 | 0 |
| C | 0 | 23 | 0 |
| D | 0 | 24 | 0 |
| Mode M0 | |||
|---|---|---|---|
| Quadrant | BADHDUFLAG | Total packets | Discarded packets |
| A | 0 | 11749 | 3 |
| B | 0 | 13296 | 2 |
| C | 0 | 12636 | 2 |
| D | 0 | 15391 | 2 |
| Quadrant | Total seconds | Saturated seconds | Saturation percentage |
|---|---|---|---|
| A | 5553 | 9 | 0.162075% |
| B | 5553 | 149 | 2.683234% |
| C | 5553 | 25 | 0.450207% |
| D | 5553 | 302 | 5.438502% |
Noise dominated data is calculated using 1-second bins in cleaned event files. If a bin has >2000 counts, and if more than 50% of those come from <1% of pixels, then it is considered to be noise-dominated and hence unusable.
| Quadrant | # 1 sec bins | Bins with >0 counts | Bins with >2000 counts | High rate bins dominated by noise | Noise dominated (total time) | Noise dominated (detector-on time) | Marked lightcurve |
|---|---|---|---|---|---|---|---|
| A | 7286 | 5554 | 1 | 1 | 0.01% | 0.02% | 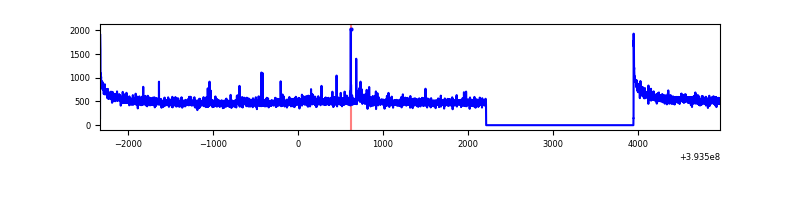 |
| B | 7286 | 5554 | 109 | 109 | 1.50% | 1.96% | 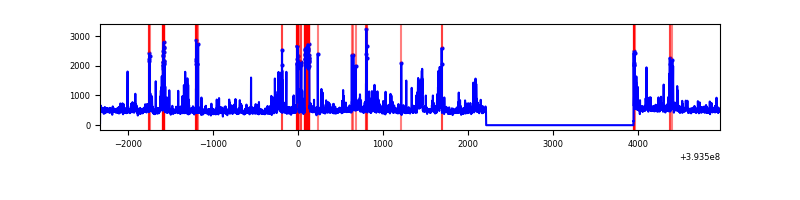 |
| C | 7286 | 5554 | 22 | 22 | 0.30% | 0.40% | 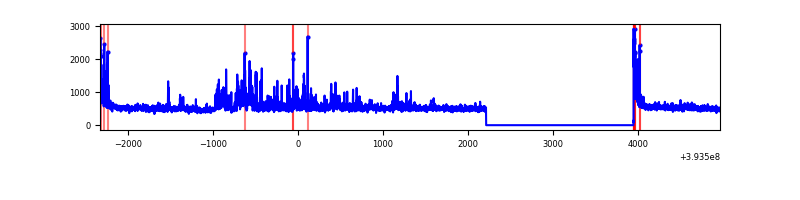 |
| D | 7286 | 5554 | 254 | 254 | 3.49% | 4.57% | 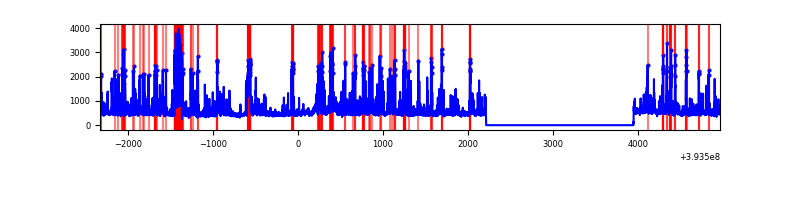 |
Top three noisy pixels from each quadrant. If the there are fewer than three noisy pixels in the level2.evt file, extra rows are filled as -1
| Pixel properties | Quadrant properties | ||||||
|---|---|---|---|---|---|---|---|
| Quadrant | DetID | PixID | Counts | Sigma | Mean | Median | Sigma |
| A | 10 | 83 | 188436 | 1384.07 | 668 | 655 | 135.7 |
| A | 15 | 223 | 32568 | 235.22 | 668 | 655 | 135.7 |
| A | 12 | 189 | 31864 | 230.03 | 668 | 655 | 135.7 |
| B | 5 | 172 | 511887 | 4054.09 | 652 | 635 | 126.1 |
| B | 4 | 171 | 86619 | 681.83 | 652 | 635 | 126.1 |
| B | 5 | 255 | 56801 | 445.38 | 652 | 635 | 126.1 |
| C | 4 | 254 | 298602 | 2022.16 | 638 | 645 | 147.3 |
| C | 15 | 214 | 238527 | 1614.45 | 638 | 645 | 147.3 |
| C | 0 | 10 | 111137 | 749.88 | 638 | 645 | 147.3 |
| D | 12 | 6 | 707511 | 4590.07 | 628 | 610 | 154.0 |
| D | 2 | 137 | 300128 | 1944.84 | 628 | 610 | 154.0 |
| D | 13 | 249 | 167080 | 1080.93 | 628 | 610 | 154.0 |
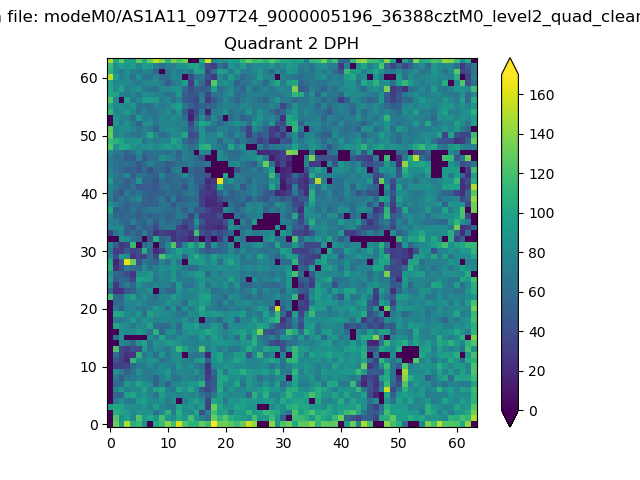
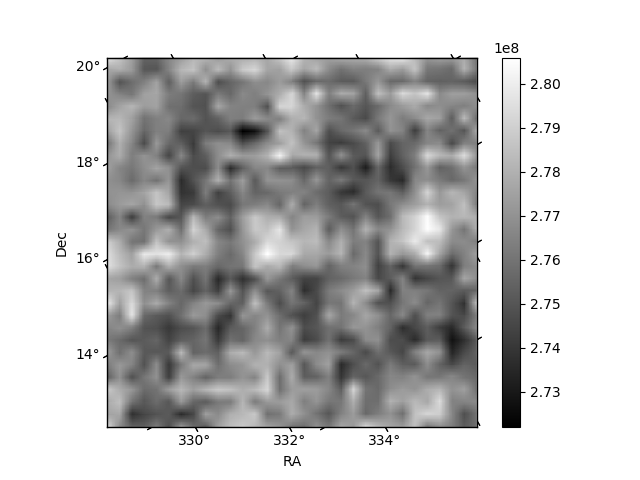
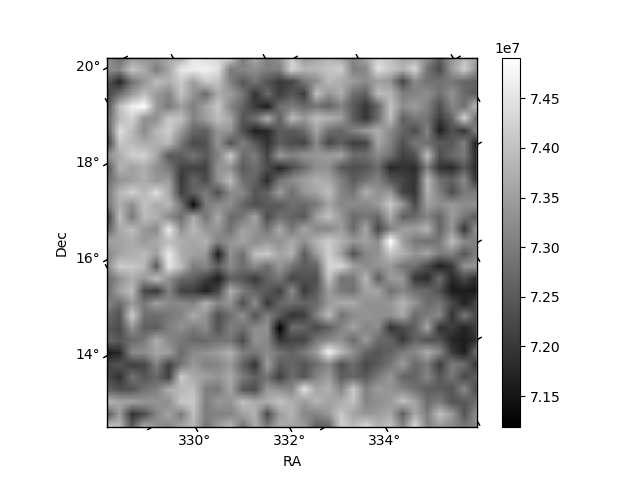
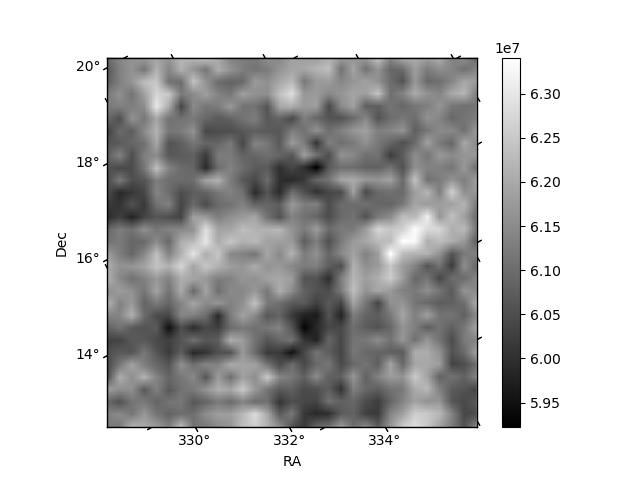
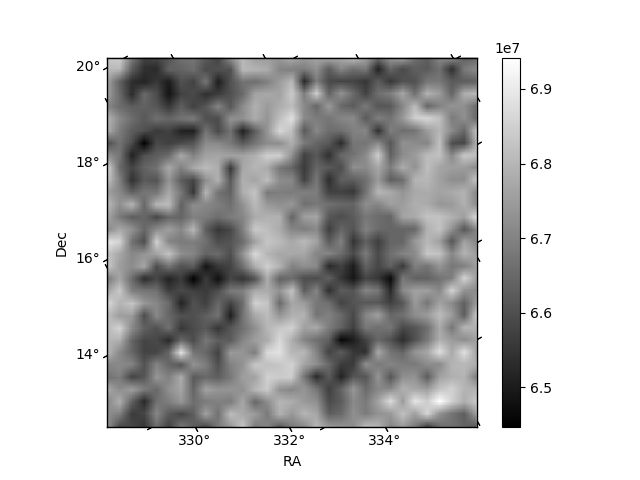
Histogram calculated using DETX and DETY for each event in the final _common_clean file
| Quadrant A | 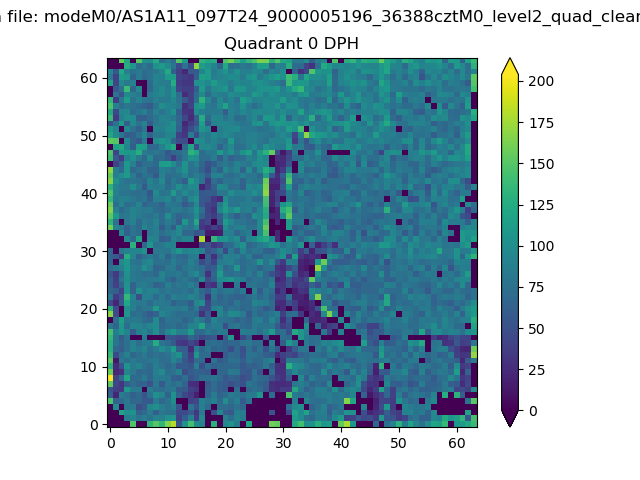 |
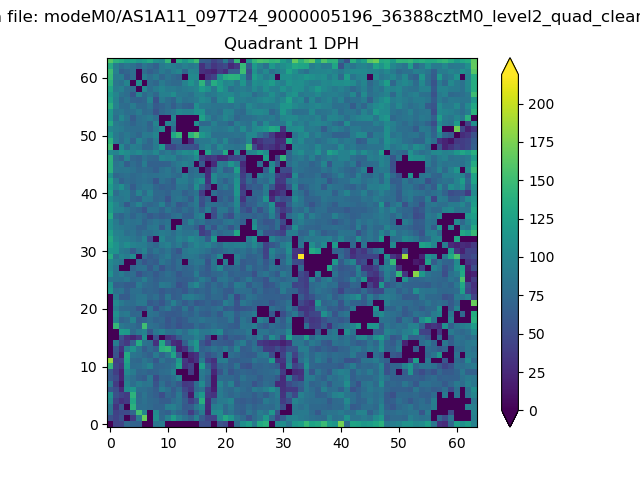 |
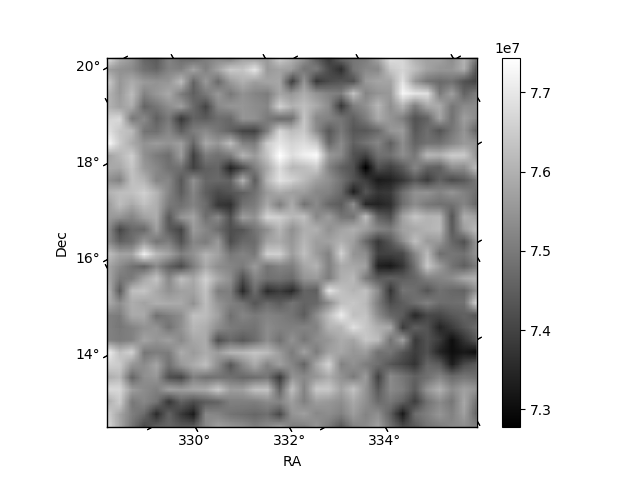
Quadrant B |
|---|---|---|---|
| Quadrant D | 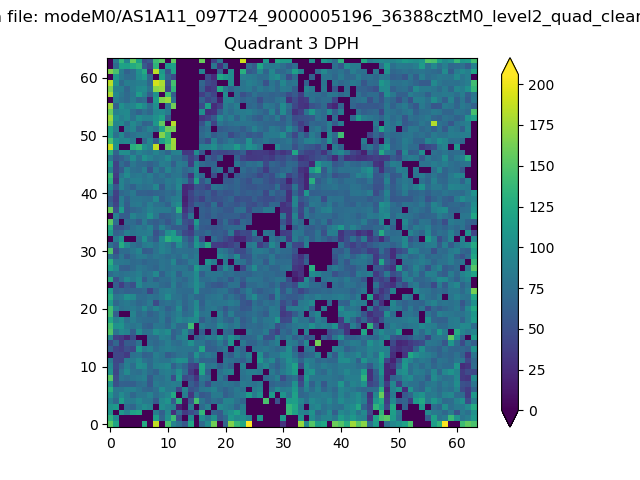 |
 |
Quadrant C |
| Plot type | Count rate plots | Images |
|---|---|---|
| Comparison with Poisson distribution Blue bars denote a histogram of data divided into 1 sec bins. Red curve is a Poisson curve with rate = median count rate of data. |
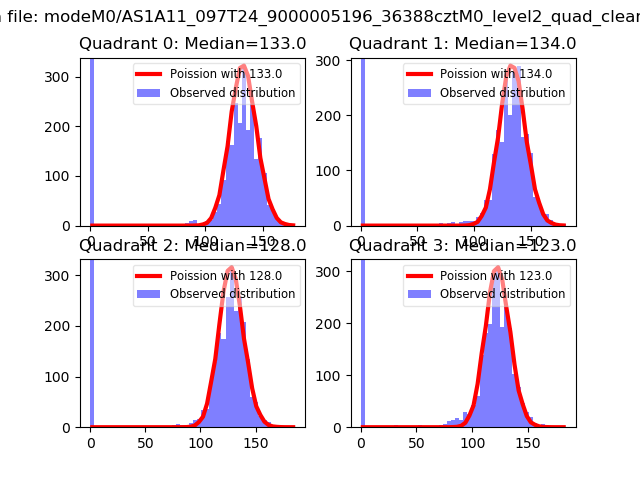 |
 |
| Quadrant-wise count rates Data is divided into 100 sec bins |
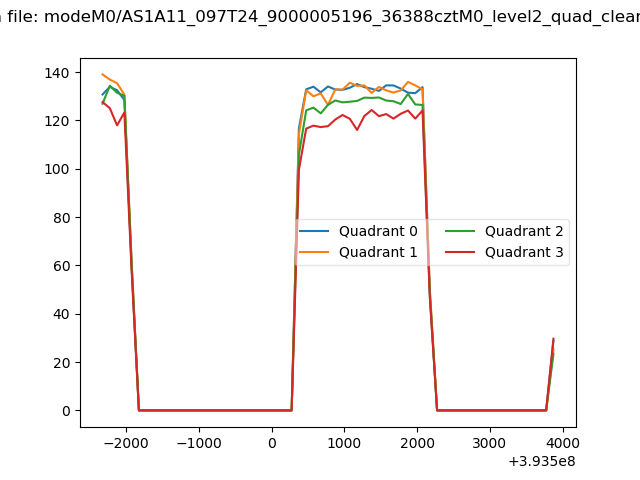 |
|
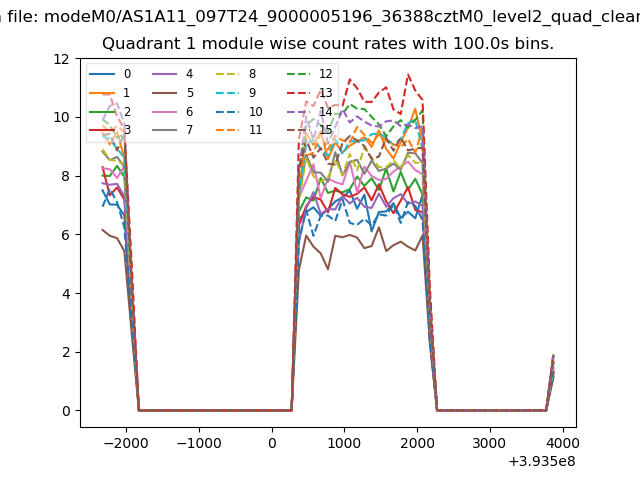
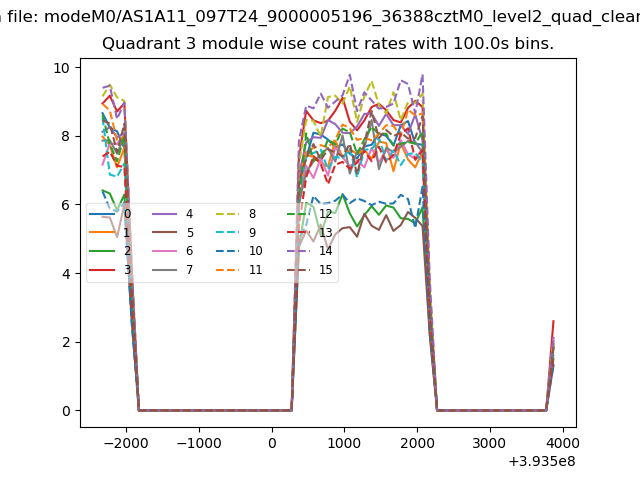
| Module-wise count rates for Quadrant A Data is divided into 100 sec bins |
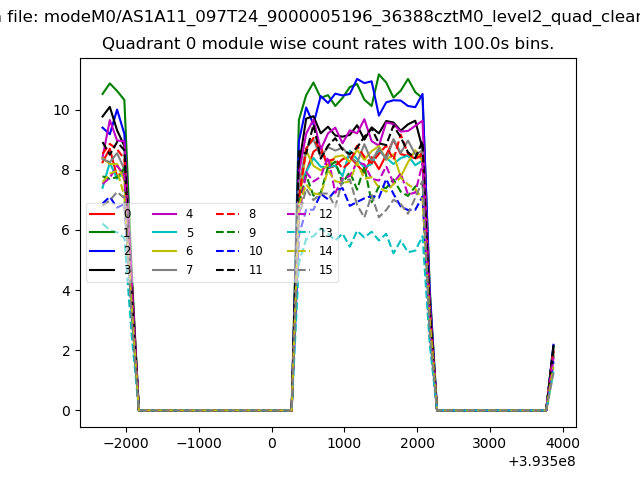 |
 |
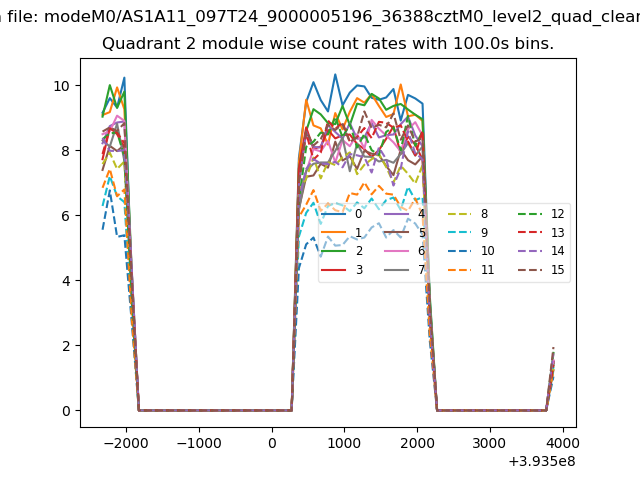
| Module-wise count rates for Quadrant B Data is divided into 100 sec bins |
 |
 |
| Module-wise count rates for Quadrant C Data is divided into 100 sec bins |
 |
 |
| Module-wise count rates for Quadrant D Data is divided into 100 sec bins |
 |
 |
| Parameter | Plot |
|---|---|
| CZT HV Monitor |  |
| D_VDD | 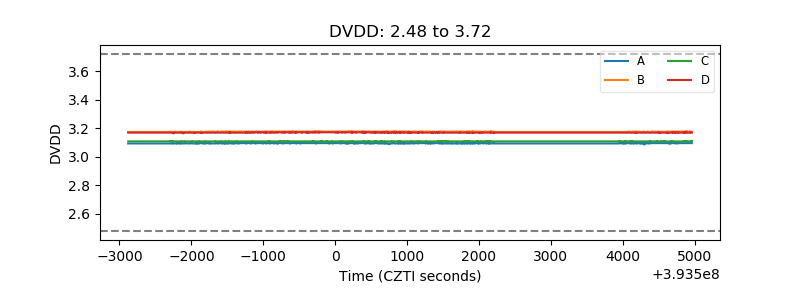 |
| Temperature 1 | 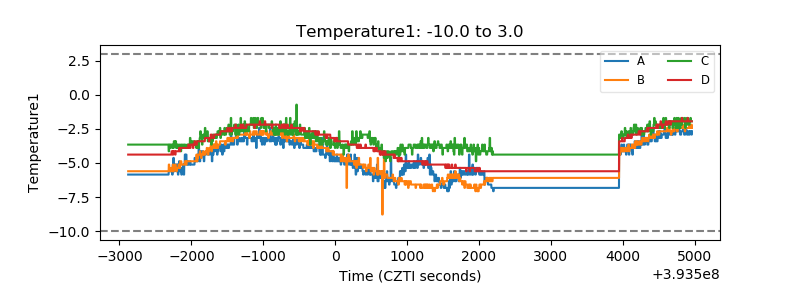 |
| Veto HV Monitor | 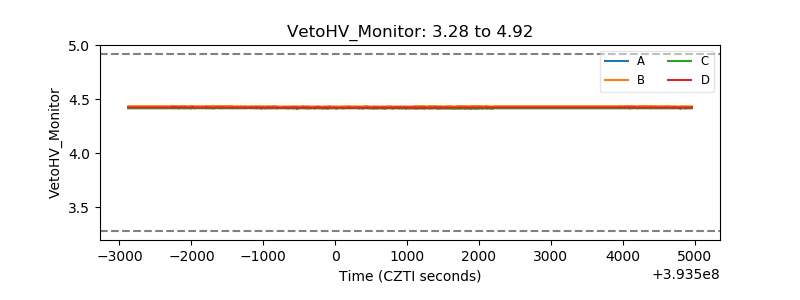 |
| Veto LLD | 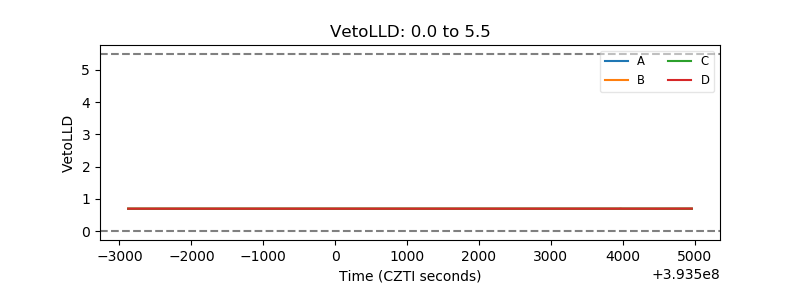 |
| Alpha Counter | 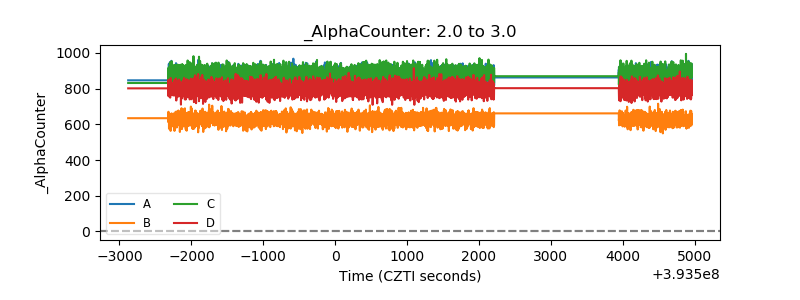 |
| _CPM_Rate | 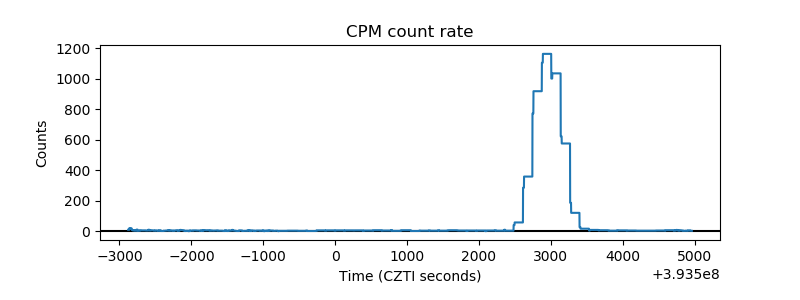 |
| CZT Counter | 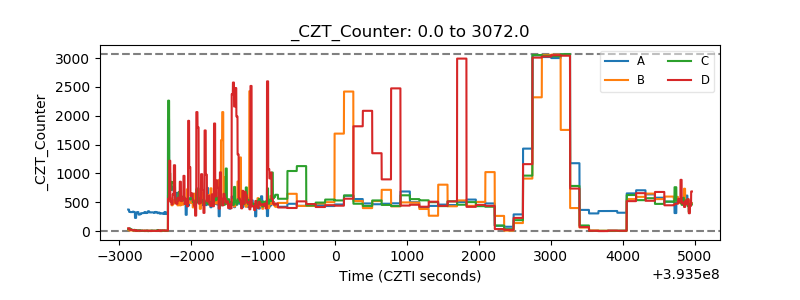 |
| +2.5 Volts monitor | 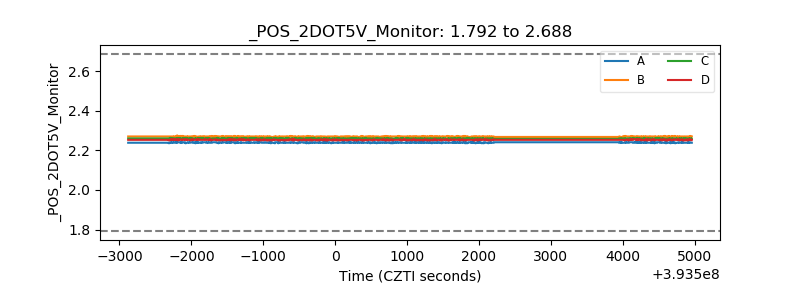 |
| +5 Volts monitor | 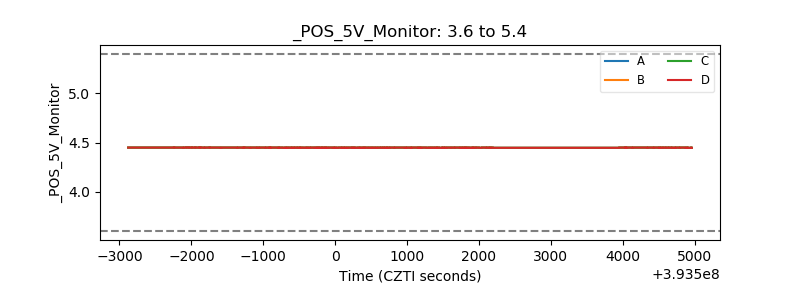 |
| _ROLL_ROT | 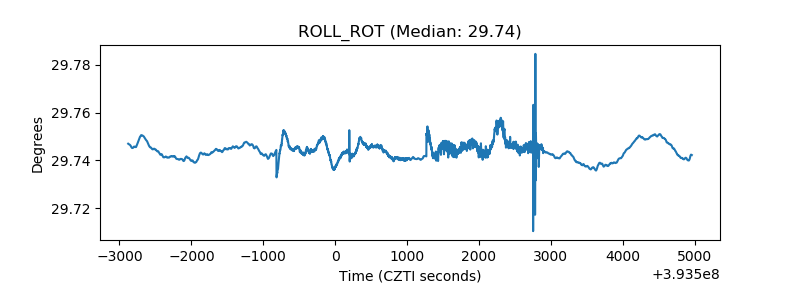 |
| _Roll_DEC | 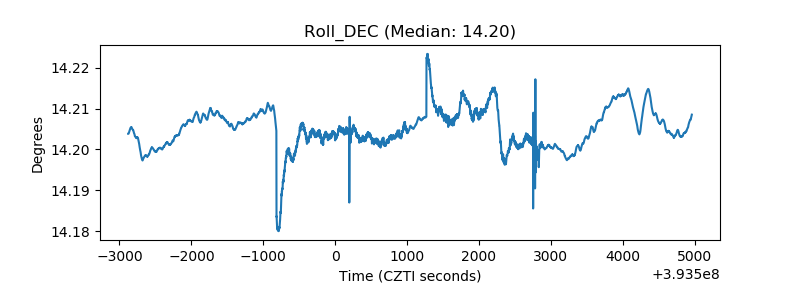 |
| _Roll_RA | 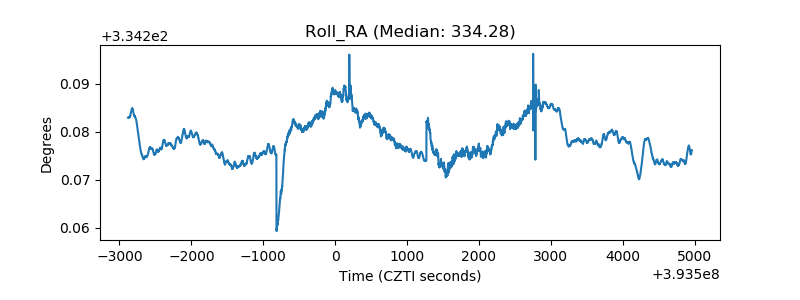 |
| Veto Counter | 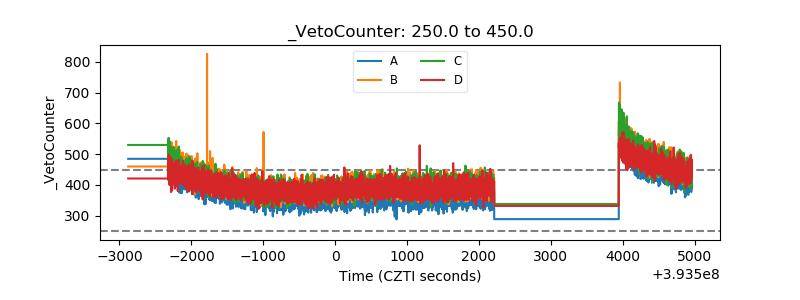 |