| Param | Original file | Final file |
|---|---|---|
| Filename | modeM0/AS1A11_097T24_9000005196_36381cztM0_level2.evt | modeM0/AS1A11_097T24_9000005196_36381cztM0_level2_quad_clean.evt |
| Size (bytes) | 534,755,520 | 73,451,520 |
| Size | 510.0 MB | 70.0 MB |
| Events in quadrant A | 3,173,255 | 475,745 |
| Events in quadrant B | 5,608,216 | 437,796 |
| Events in quadrant C | 2,998,556 | 468,488 |
| Events in quadrant D | 4,025,883 | 440,697 |
| Mode SS | |||
|---|---|---|---|
| Quadrant | BADHDUFLAG | Total packets | Discarded packets |
| A | 0 | 118 | 0 |
| B | 0 | 118 | 0 |
| C | 0 | 118 | 0 |
| D | 0 | 118 | 0 |
| Mode M9 | |||
|---|---|---|---|
| Quadrant | BADHDUFLAG | Total packets | Discarded packets |
| A | 0 | 30 | 0 |
| B | 0 | 30 | 0 |
| C | 0 | 30 | 0 |
| D | 0 | 30 | 0 |
| Mode M0 | |||
|---|---|---|---|
| Quadrant | BADHDUFLAG | Total packets | Discarded packets |
| A | 0 | 13114 | 3 |
| B | 0 | 20435 | 2 |
| C | 0 | 12349 | 2 |
| D | 0 | 15974 | 2 |
| Quadrant | Total seconds | Saturated seconds | Saturation percentage |
|---|---|---|---|
| A | 5731 | 140 | 2.442855% |
| B | 5731 | 1168 | 20.380387% |
| C | 5731 | 61 | 1.064387% |
| D | 5731 | 333 | 5.810504% |
Noise dominated data is calculated using 1-second bins in cleaned event files. If a bin has >2000 counts, and if more than 50% of those come from <1% of pixels, then it is considered to be noise-dominated and hence unusable.
| Quadrant | # 1 sec bins | Bins with >0 counts | Bins with >2000 counts | High rate bins dominated by noise | Noise dominated (total time) | Noise dominated (detector-on time) | Marked lightcurve |
|---|---|---|---|---|---|---|---|
| A | 7162 | 5732 | 113 | 113 | 1.58% | 1.97% | 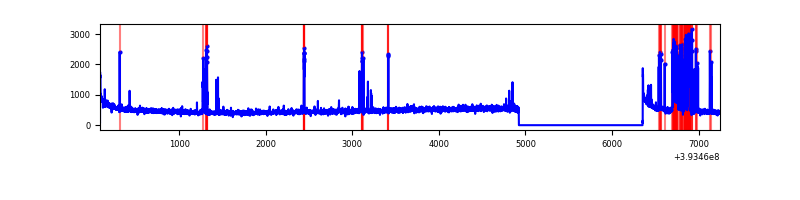 |
| B | 7162 | 5732 | 1016 | 1016 | 14.19% | 17.73% | 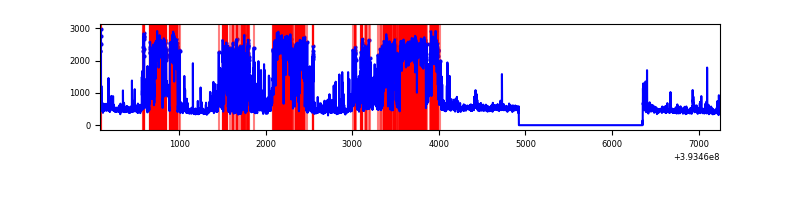 |
| C | 7162 | 5732 | 38 | 38 | 0.53% | 0.66% | 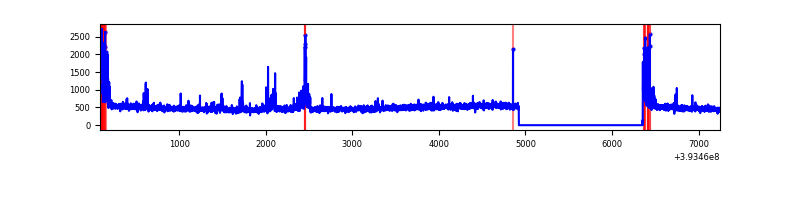 |
| D | 7162 | 5732 | 315 | 315 | 4.40% | 5.50% | 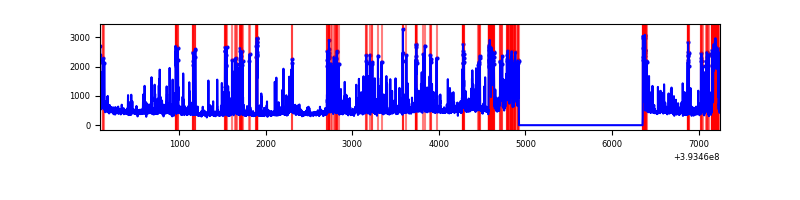 |
Top three noisy pixels from each quadrant. If the there are fewer than three noisy pixels in the level2.evt file, extra rows are filled as -1
| Pixel properties | Quadrant properties | ||||||
|---|---|---|---|---|---|---|---|
| Quadrant | DetID | PixID | Counts | Sigma | Mean | Median | Sigma |
| A | 15 | 223 | 452910 | 3459.05 | 648 | 637 | 130.8 |
| A | 10 | 83 | 184476 | 1406.03 | 648 | 637 | 130.8 |
| A | 13 | 6 | 11003 | 79.28 | 648 | 637 | 130.8 |
| B | 5 | 172 | 3028006 | 26829.76 | 581 | 565 | 112.8 |
| B | 4 | 171 | 171552 | 1515.32 | 581 | 565 | 112.8 |
| B | 5 | 255 | 68646 | 603.35 | 581 | 565 | 112.8 |
| C | 15 | 214 | 243117 | 1648.19 | 633 | 639 | 147.1 |
| C | 0 | 10 | 185815 | 1258.69 | 633 | 639 | 147.1 |
| C | 4 | 254 | 95381 | 643.99 | 633 | 639 | 147.1 |
| D | 12 | 16 | 462915 | 3085.27 | 615 | 598 | 149.8 |
| D | 13 | 249 | 449671 | 2996.89 | 615 | 598 | 149.8 |
| D | 12 | 6 | 235421 | 1567.09 | 615 | 598 | 149.8 |
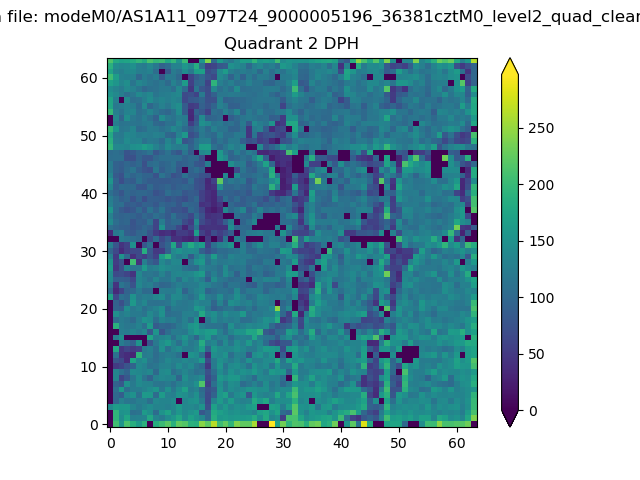
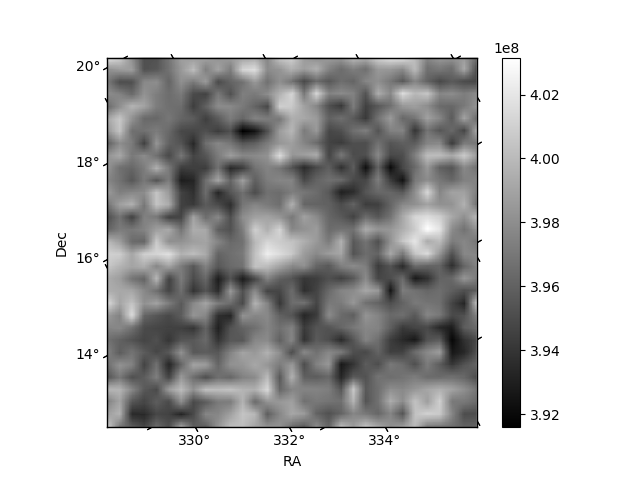
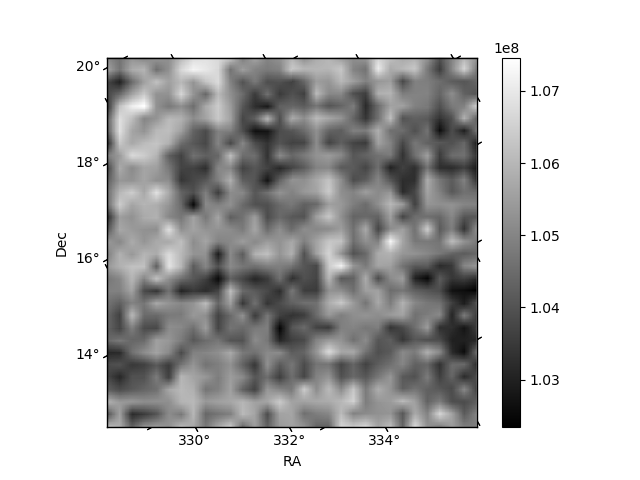
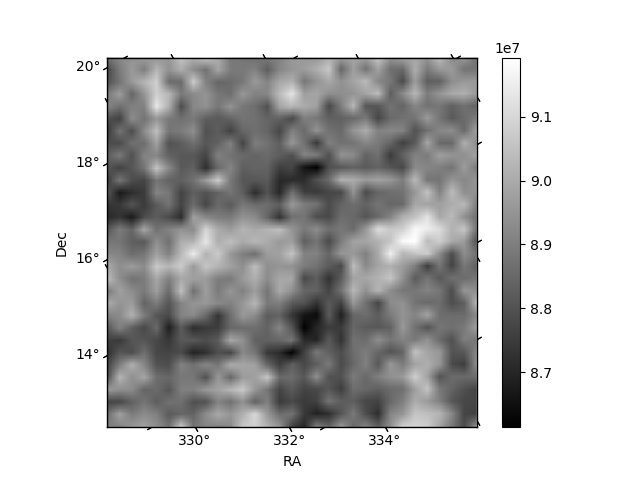
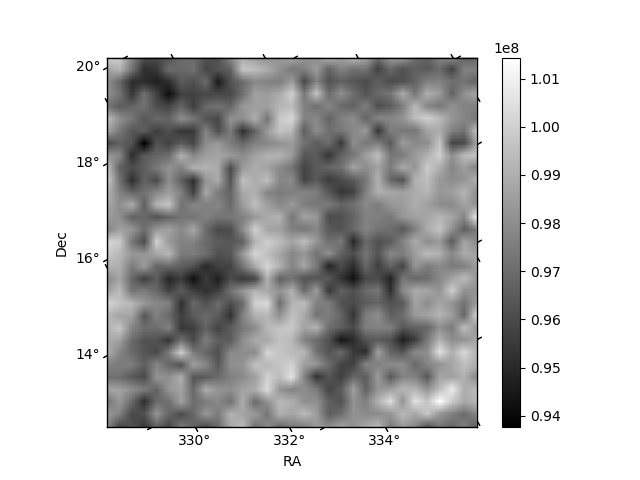
Histogram calculated using DETX and DETY for each event in the final _common_clean file
| Quadrant A | 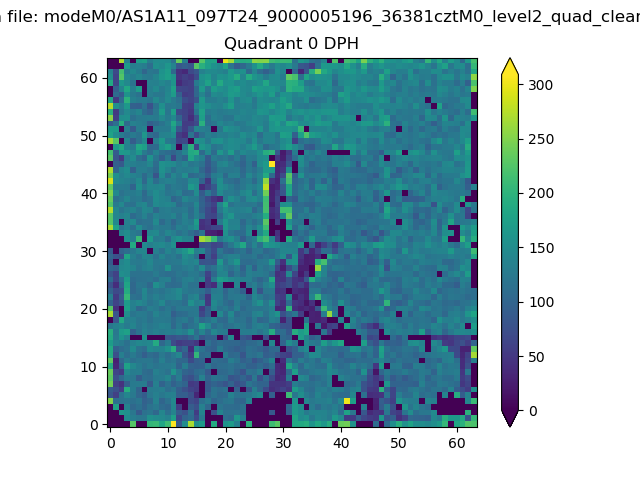 |
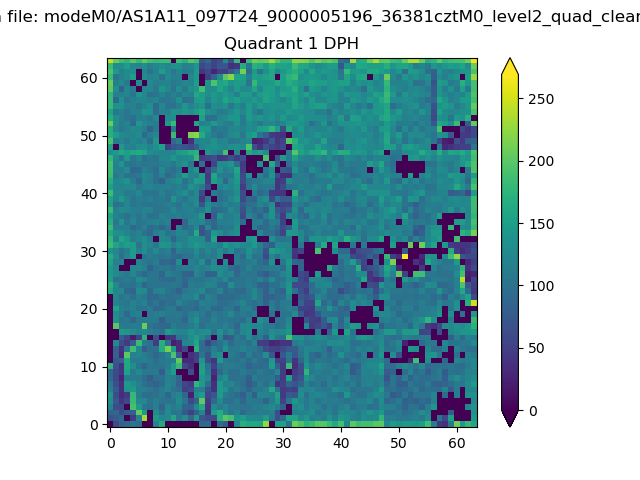 |
Quadrant B |
|---|---|---|---|
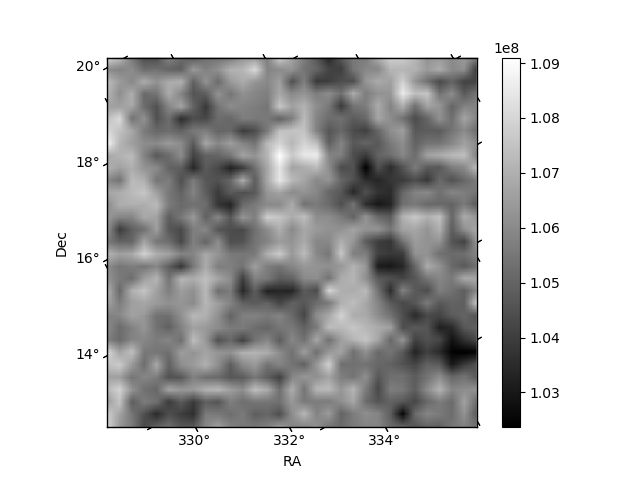
| Quadrant D | 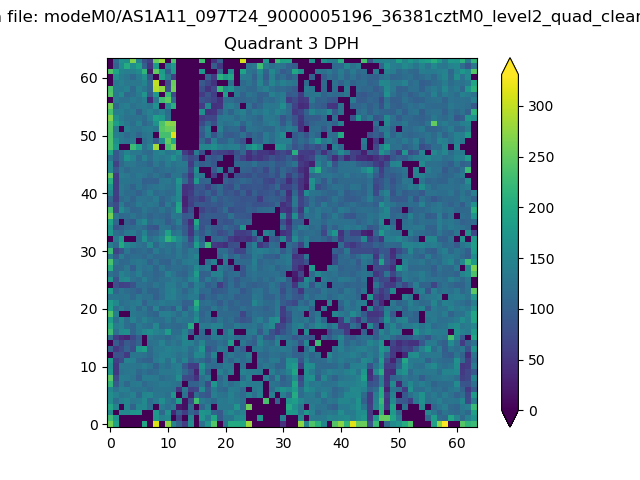 |
 |
Quadrant C |
| Plot type | Count rate plots | Images |
|---|---|---|
| Comparison with Poisson distribution Blue bars denote a histogram of data divided into 1 sec bins. Red curve is a Poisson curve with rate = median count rate of data. |
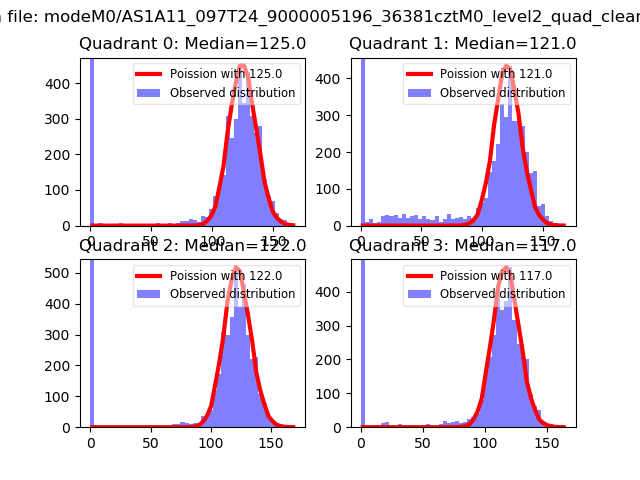 |
 |
| Quadrant-wise count rates Data is divided into 100 sec bins |
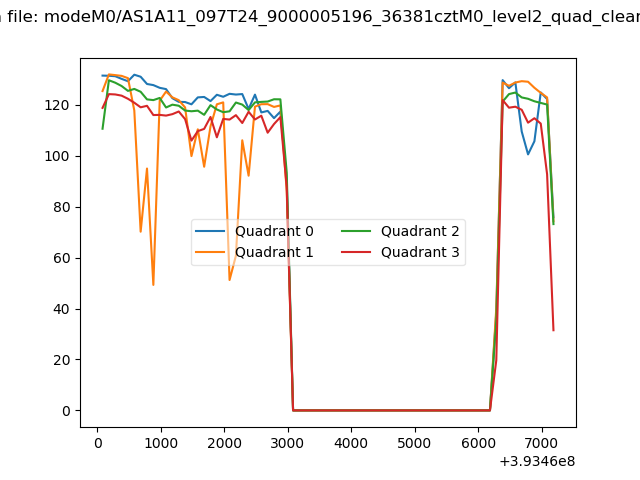 |
|
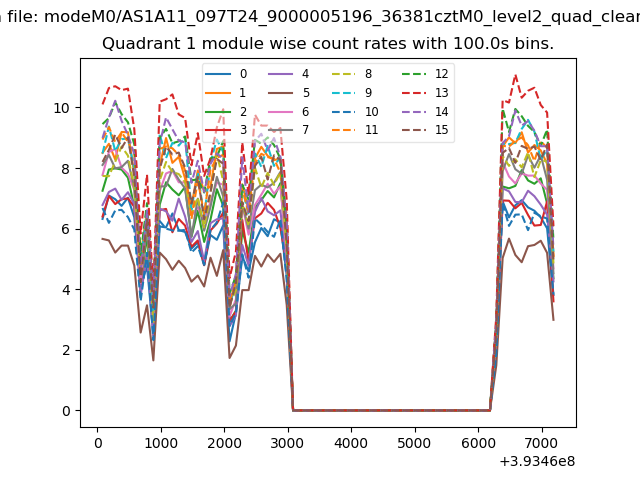
| Module-wise count rates for Quadrant A Data is divided into 100 sec bins |
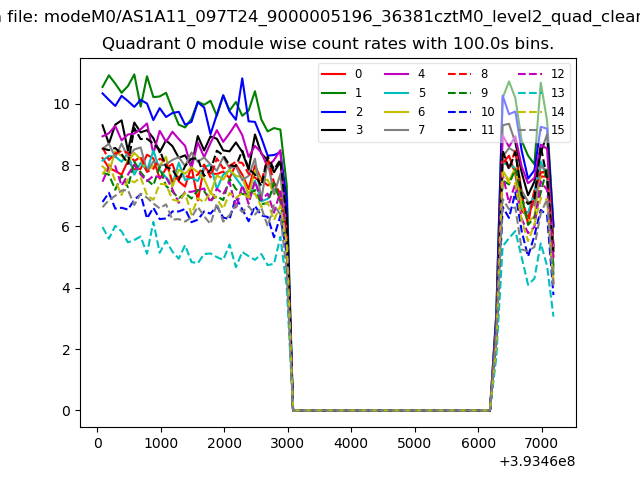 |
 |
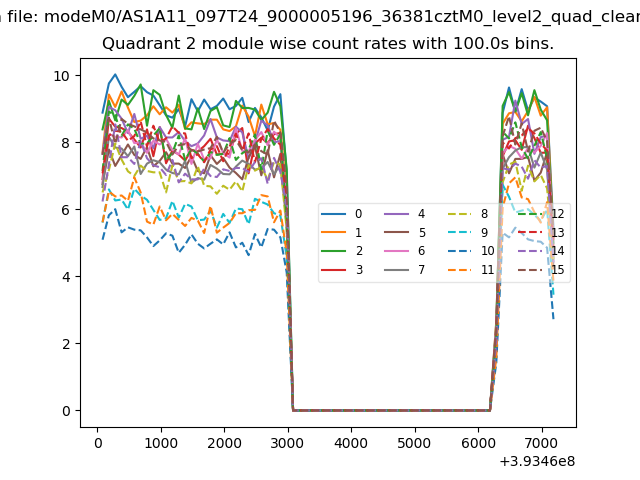
| Module-wise count rates for Quadrant B Data is divided into 100 sec bins |
 |
 |
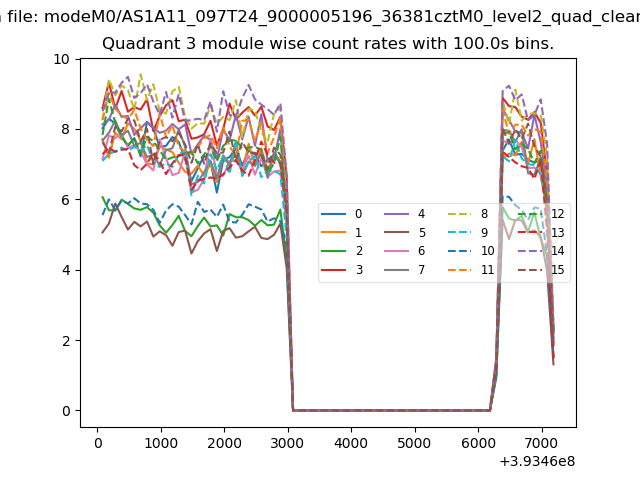
| Module-wise count rates for Quadrant C Data is divided into 100 sec bins |
 |
 |
| Module-wise count rates for Quadrant D Data is divided into 100 sec bins |
 |
 |
| Parameter | Plot |
|---|---|
| CZT HV Monitor | 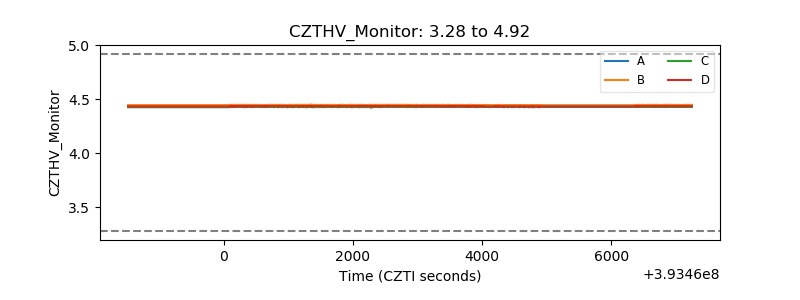 |
| D_VDD | 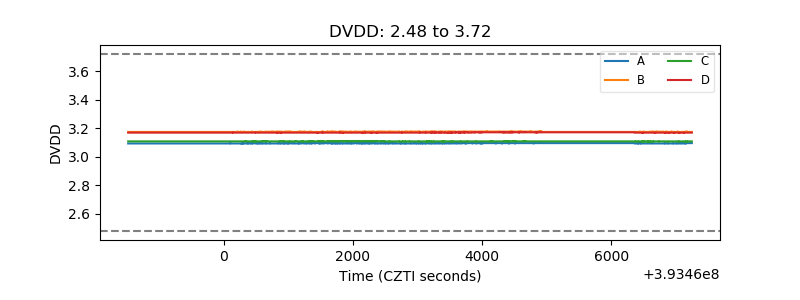 |
| Temperature 1 | 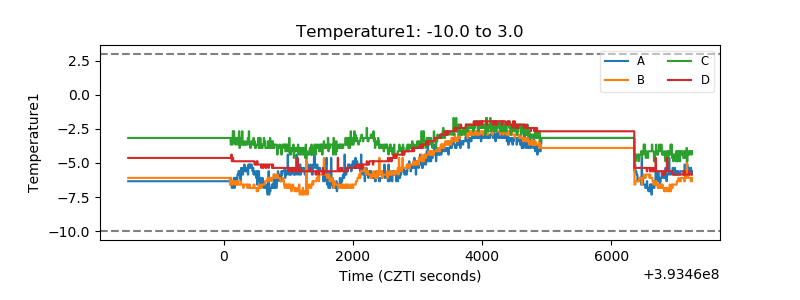 |
| Veto HV Monitor | 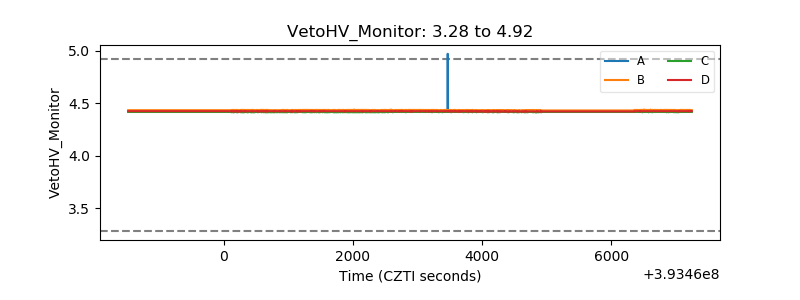 |
| Veto LLD | 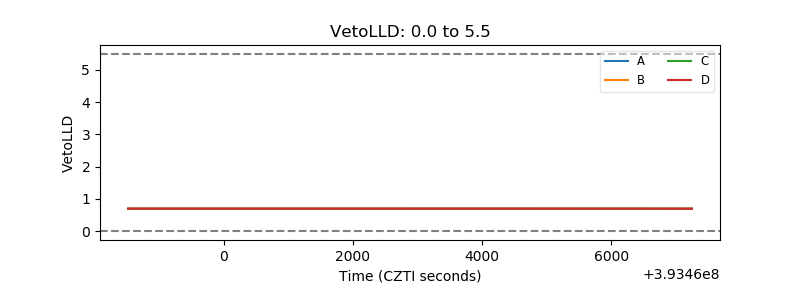 |
| Alpha Counter | 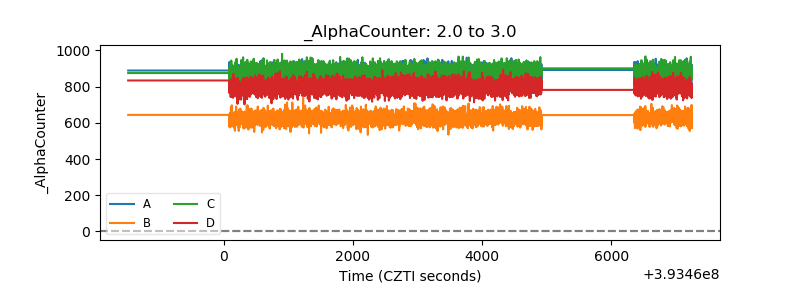 |
| _CPM_Rate | 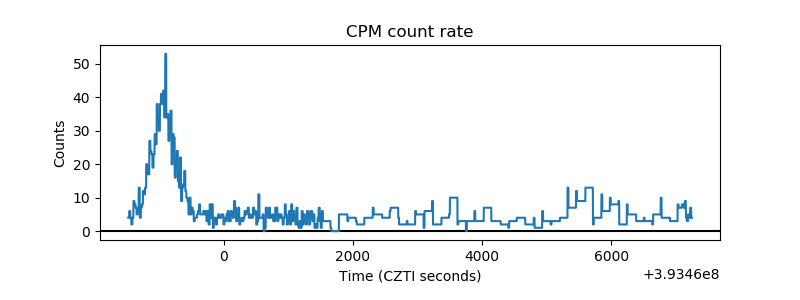 |
| CZT Counter | 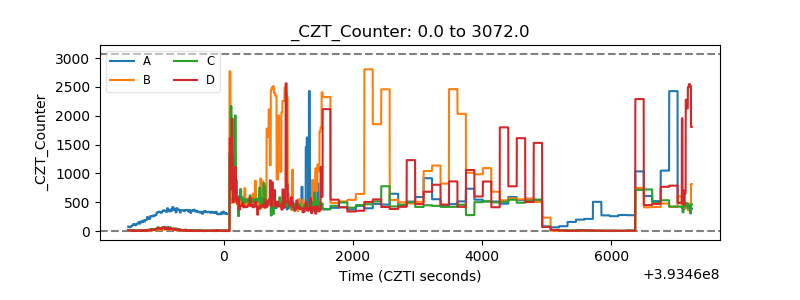 |
| +2.5 Volts monitor | 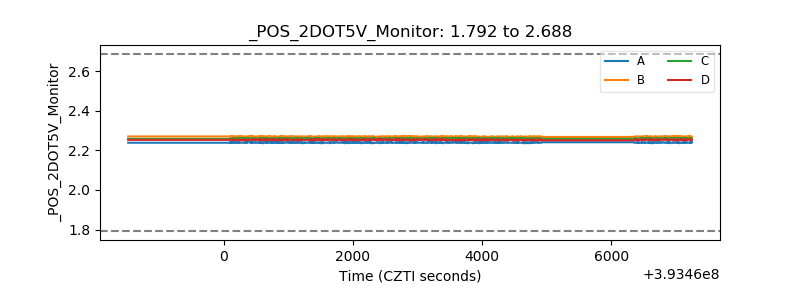 |
| +5 Volts monitor | 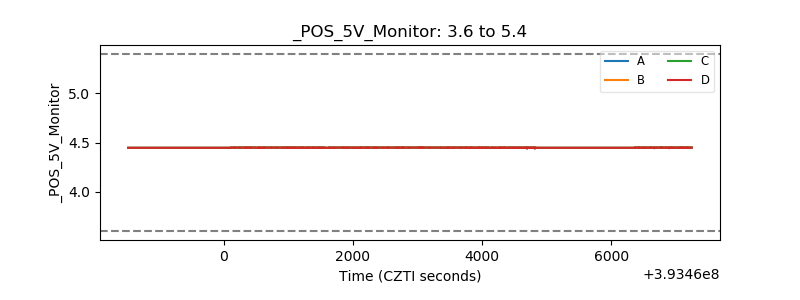 |
| _ROLL_ROT | 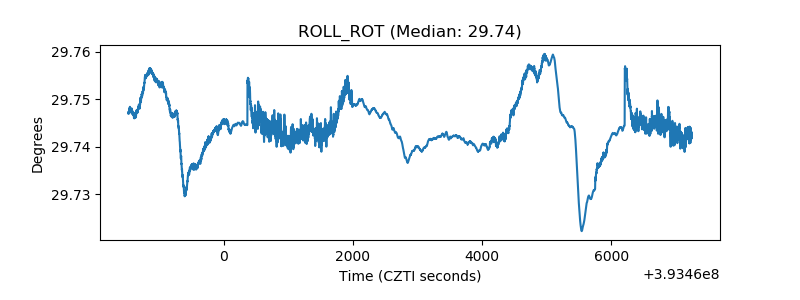 |
| _Roll_DEC | 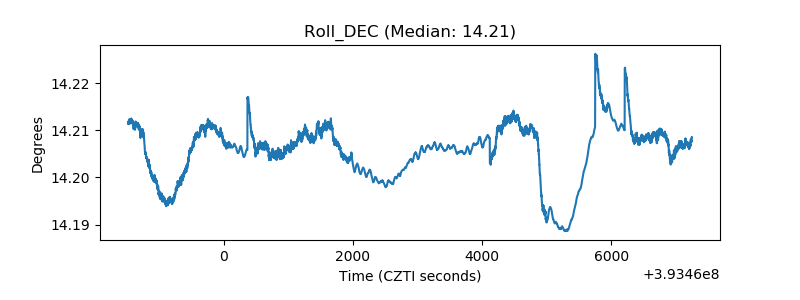 |
| _Roll_RA | 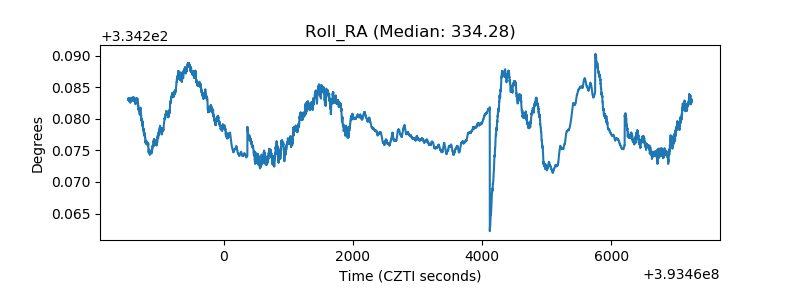 |
| Veto Counter |  |