| Param | Original file | Final file |
|---|---|---|
| Filename | modeM0/AS1A11_097T24_9000005196_36379cztM0_level2.evt | modeM0/AS1A11_097T24_9000005196_36379cztM0_level2_quad_clean.evt |
| Size (bytes) | 446,276,160 | 88,375,680 |
| Size | 425.6 MB | 84.3 MB |
| Events in quadrant A | 2,944,022 | 596,813 |
| Events in quadrant B | 3,361,611 | 592,856 |
| Events in quadrant C | 2,958,273 | 585,785 |
| Events in quadrant D | 3,906,609 | 544,710 |
| Mode SS | |||
|---|---|---|---|
| Quadrant | BADHDUFLAG | Total packets | Discarded packets |
| A | 0 | 104 | 0 |
| B | 0 | 104 | 0 |
| C | 0 | 104 | 0 |
| D | 0 | 104 | 0 |
| Mode M9 | |||
|---|---|---|---|
| Quadrant | BADHDUFLAG | Total packets | Discarded packets |
| A | 0 | 42 | 0 |
| B | 0 | 42 | 0 |
| C | 0 | 42 | 0 |
| D | 0 | 42 | 0 |
| Mode M0 | |||
|---|---|---|---|
| Quadrant | BADHDUFLAG | Total packets | Discarded packets |
| A | 0 | 11975 | 3 |
| B | 0 | 13271 | 2 |
| C | 0 | 11788 | 2 |
| D | 0 | 15069 | 2 |
| Quadrant | Total seconds | Saturated seconds | Saturation percentage |
|---|---|---|---|
| A | 5084 | 132 | 2.596381% |
| B | 5084 | 331 | 6.510622% |
| C | 5084 | 101 | 1.986625% |
| D | 5084 | 321 | 6.313926% |
Noise dominated data is calculated using 1-second bins in cleaned event files. If a bin has >2000 counts, and if more than 50% of those come from <1% of pixels, then it is considered to be noise-dominated and hence unusable.
| Quadrant | # 1 sec bins | Bins with >0 counts | Bins with >2000 counts | High rate bins dominated by noise | Noise dominated (total time) | Noise dominated (detector-on time) | Marked lightcurve |
|---|---|---|---|---|---|---|---|
| A | 9271 | 5086 | 94 | 94 | 1.01% | 1.85% | 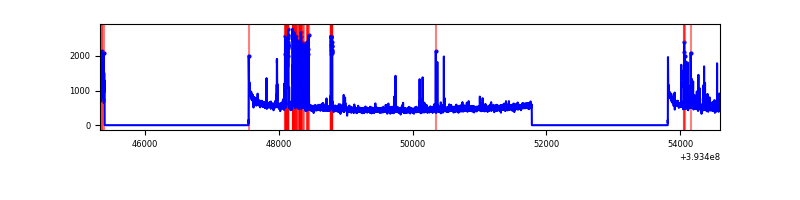 |
| B | 9271 | 5086 | 274 | 274 | 2.96% | 5.39% | 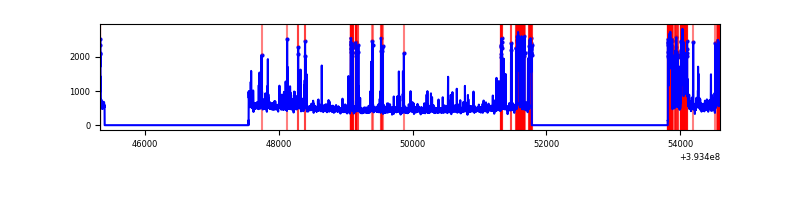 |
| C | 9271 | 5086 | 78 | 78 | 0.84% | 1.53% | 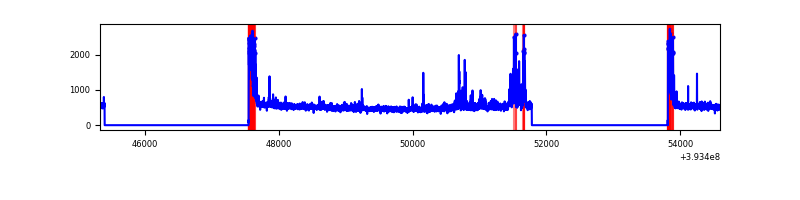 |
| D | 9271 | 5086 | 301 | 301 | 3.25% | 5.92% | 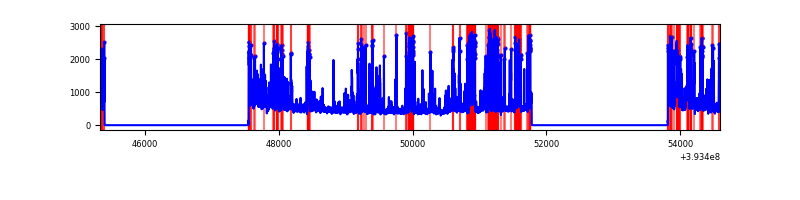 |
Top three noisy pixels from each quadrant. If the there are fewer than three noisy pixels in the level2.evt file, extra rows are filled as -1
| Pixel properties | Quadrant properties | ||||||
|---|---|---|---|---|---|---|---|
| Quadrant | DetID | PixID | Counts | Sigma | Mean | Median | Sigma |
| A | 15 | 223 | 409834 | 3387.67 | 601 | 592 | 120.8 |
| A | 10 | 83 | 176087 | 1452.73 | 601 | 592 | 120.8 |
| A | 9 | 143 | 20794 | 167.23 | 601 | 592 | 120.8 |
| B | 5 | 172 | 822510 | 7274.91 | 586 | 571 | 113.0 |
| B | 5 | 255 | 170036 | 1499.92 | 586 | 571 | 113.0 |
| B | 4 | 171 | 16589 | 141.77 | 586 | 571 | 113.0 |
| C | 0 | 10 | 263640 | 1921.93 | 589 | 593 | 136.9 |
| C | 15 | 214 | 216821 | 1579.85 | 589 | 593 | 136.9 |
| C | 4 | 254 | 167157 | 1216.99 | 589 | 593 | 136.9 |
| D | 12 | 6 | 717086 | 5087.82 | 578 | 566 | 140.8 |
| D | 13 | 249 | 247662 | 1754.56 | 578 | 566 | 140.8 |
| D | 12 | 16 | 182351 | 1290.81 | 578 | 566 | 140.8 |
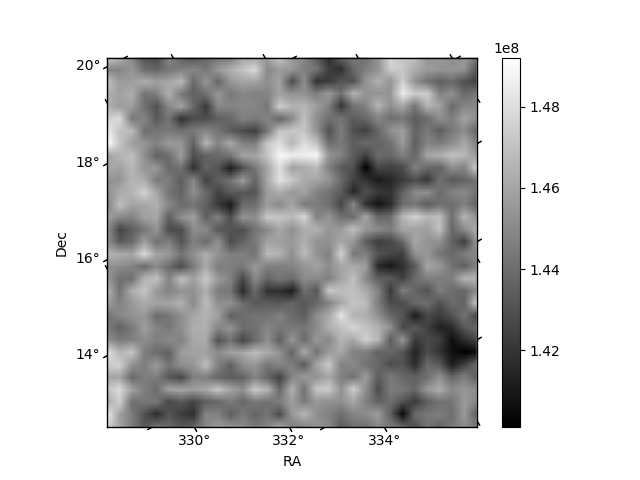
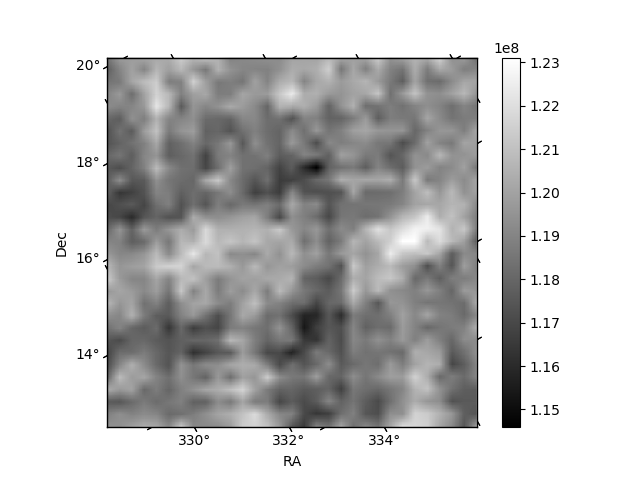
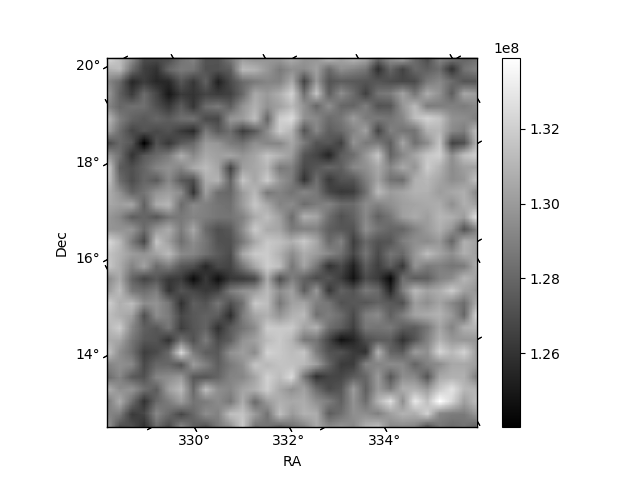
Histogram calculated using DETX and DETY for each event in the final _common_clean file
| Quadrant A | 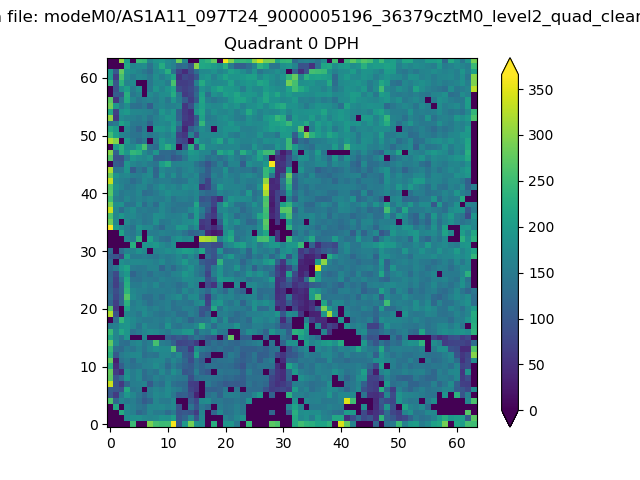 |
 |
Quadrant B |
|---|---|---|---|
| Quadrant D | 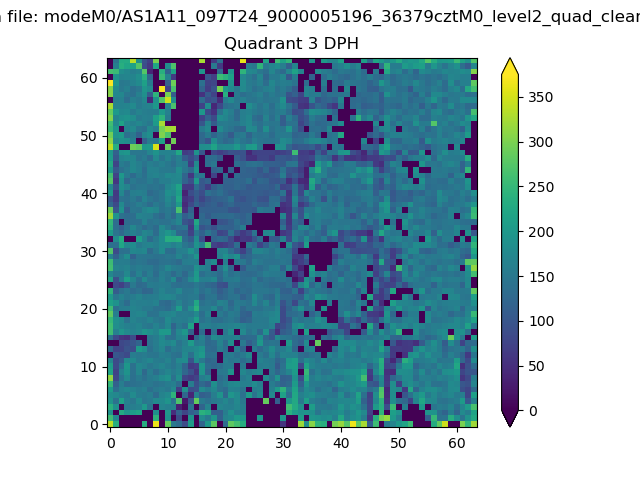 |
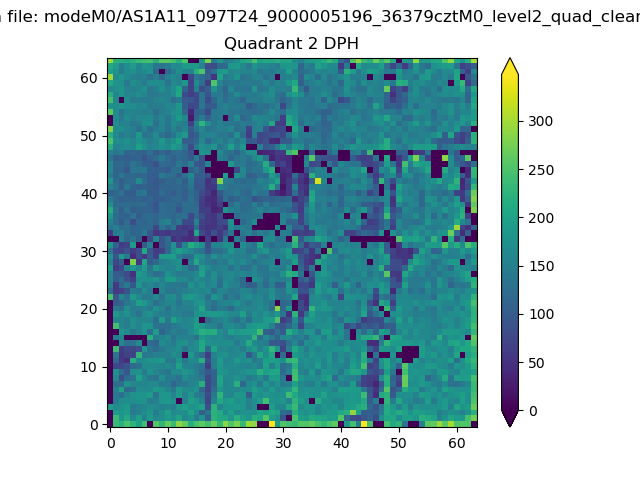 |
Quadrant C |
| Plot type | Count rate plots | Images |
|---|---|---|
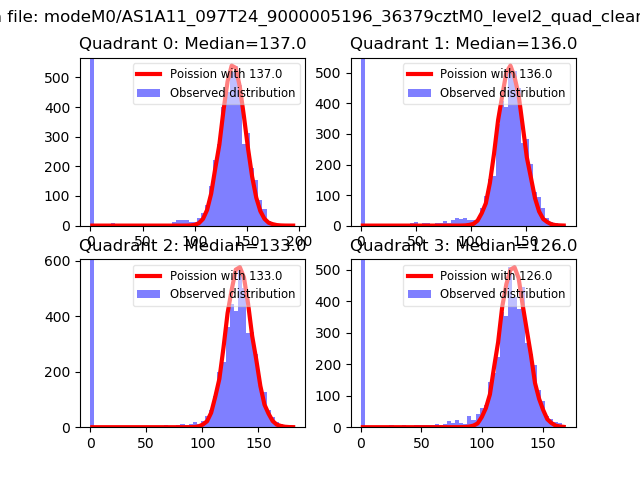
| Comparison with Poisson distribution Blue bars denote a histogram of data divided into 1 sec bins. Red curve is a Poisson curve with rate = median count rate of data. |
 |
 |
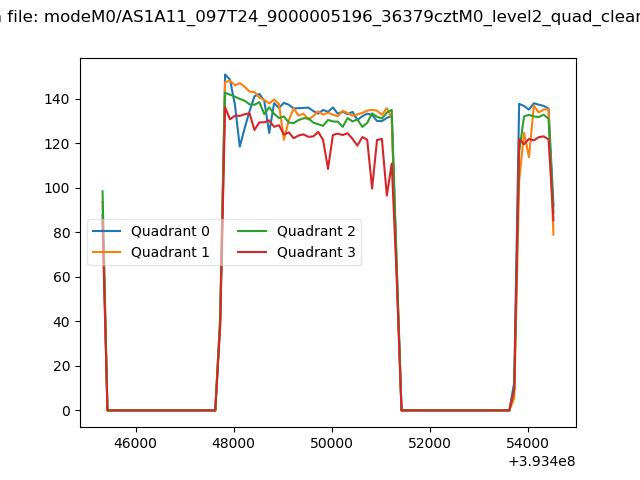
| Quadrant-wise count rates Data is divided into 100 sec bins |
 |
|
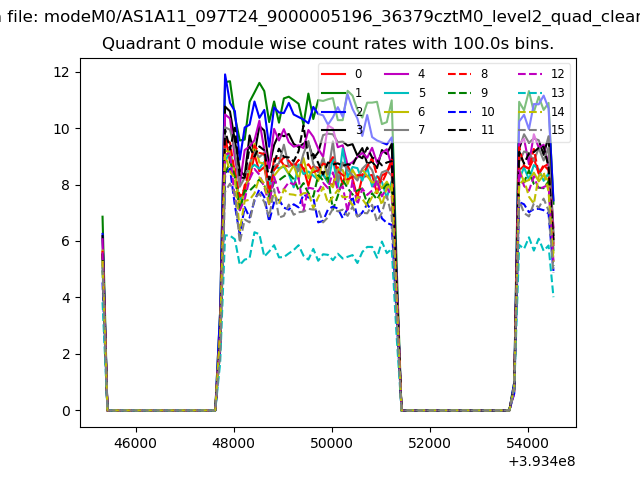
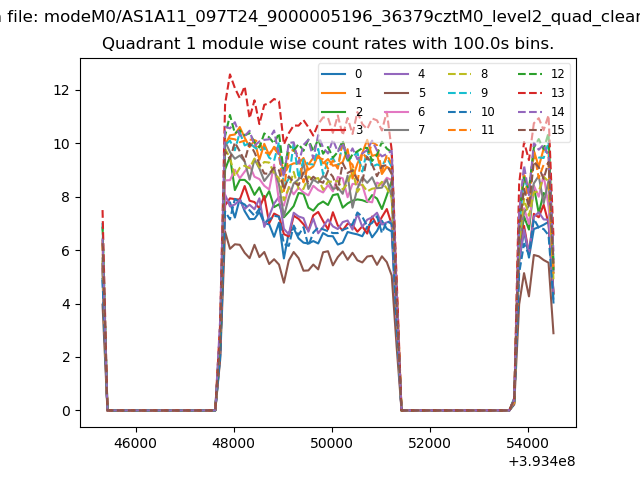
| Module-wise count rates for Quadrant A Data is divided into 100 sec bins |
 |
 |
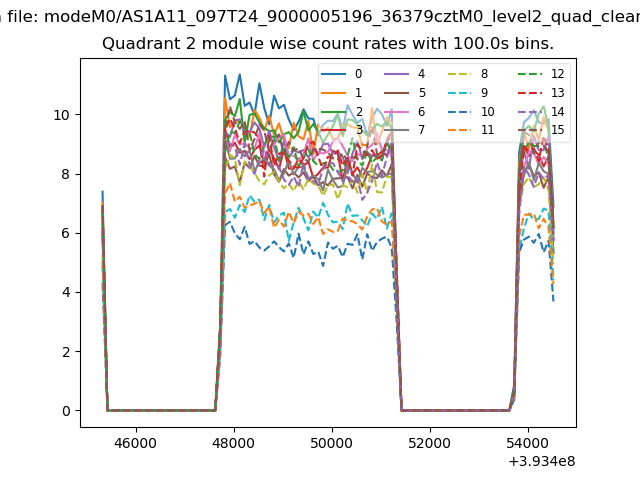
| Module-wise count rates for Quadrant B Data is divided into 100 sec bins |
 |
 |
| Module-wise count rates for Quadrant C Data is divided into 100 sec bins |
 |
 |
| Module-wise count rates for Quadrant D Data is divided into 100 sec bins |
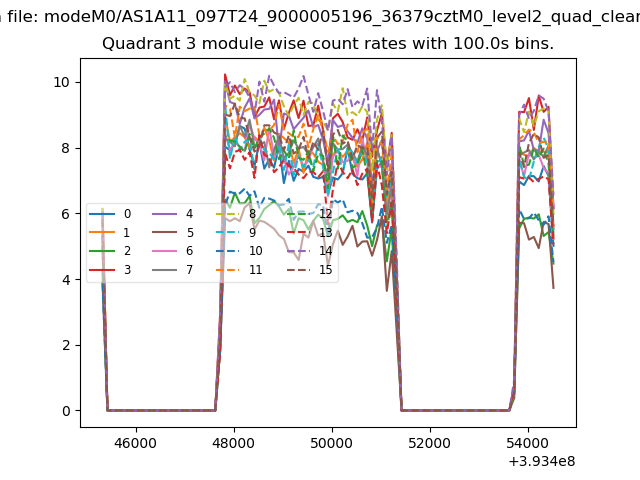 |
 |
| Parameter | Plot |
|---|---|
| CZT HV Monitor | 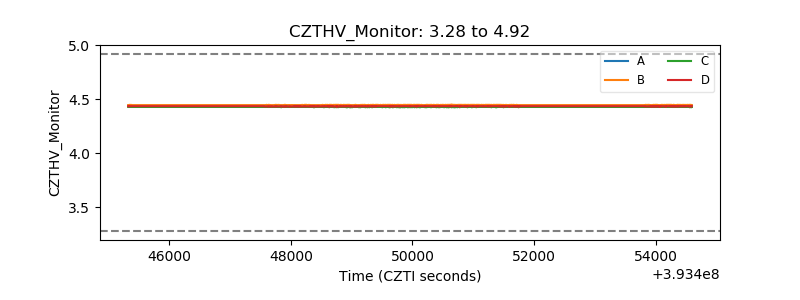 |
| D_VDD | 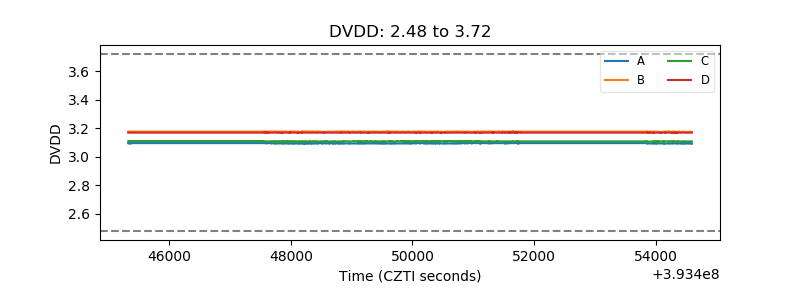 |
| Temperature 1 | 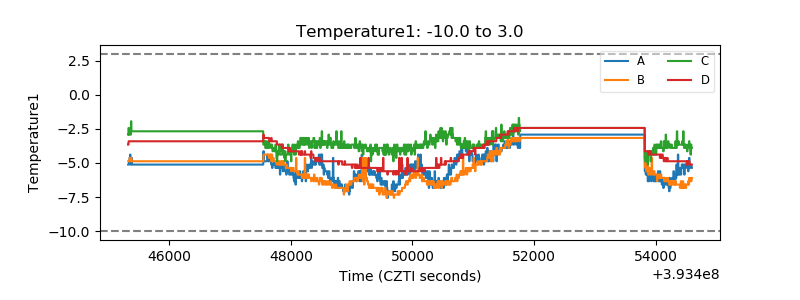 |
| Veto HV Monitor | 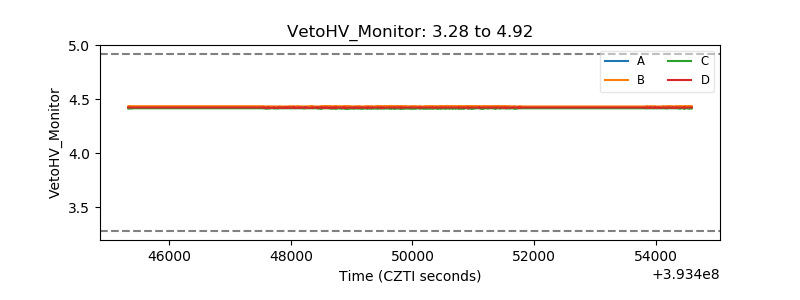 |
| Veto LLD | 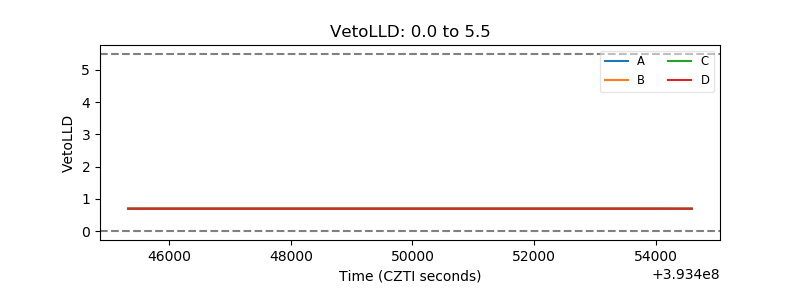 |
| Alpha Counter | 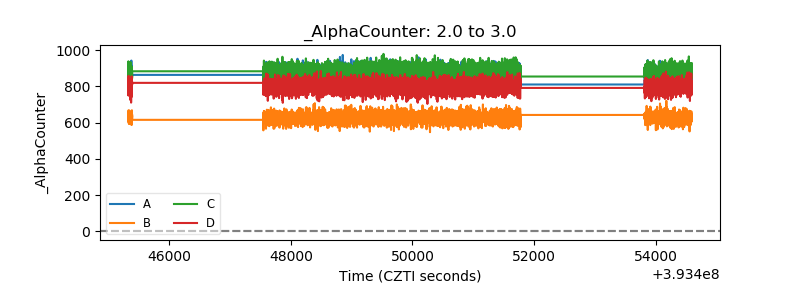 |
| _CPM_Rate | 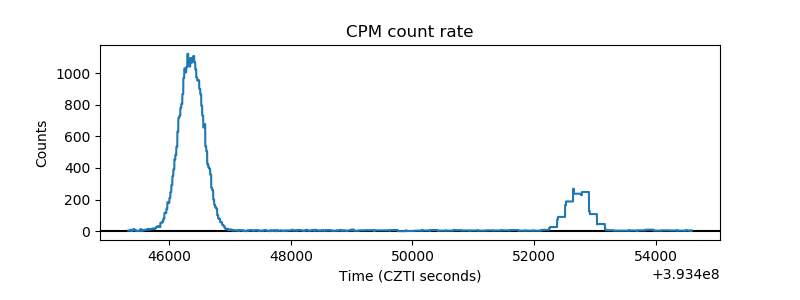 |
| CZT Counter | 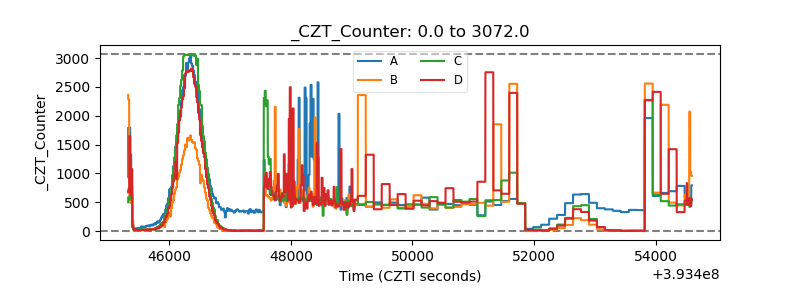 |
| +2.5 Volts monitor | 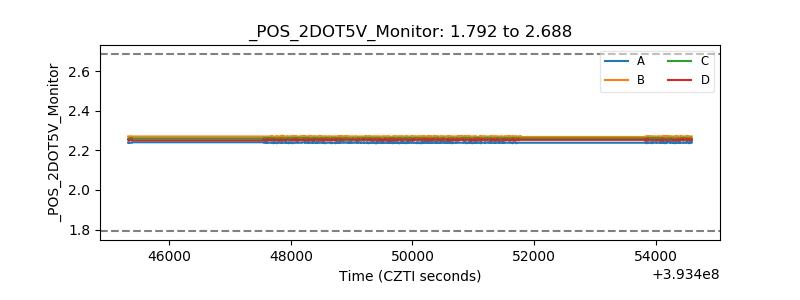 |
| +5 Volts monitor | 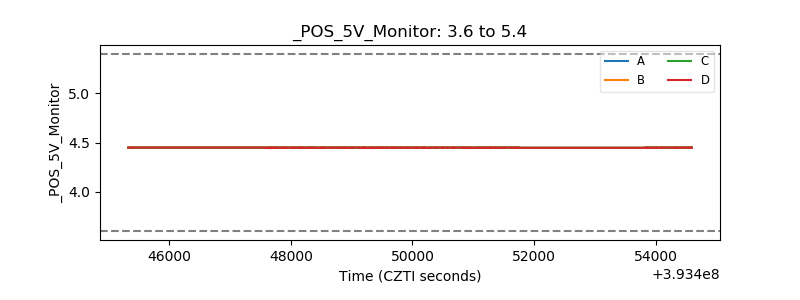 |
| _ROLL_ROT | 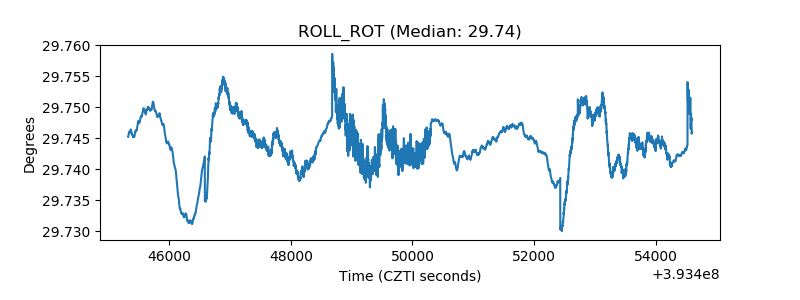 |
| _Roll_DEC | 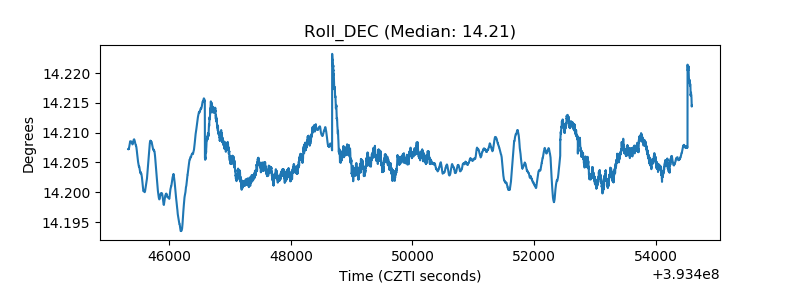 |
| _Roll_RA | 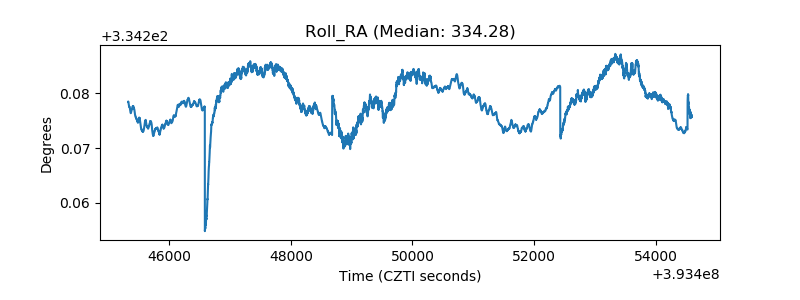 |
| Veto Counter | 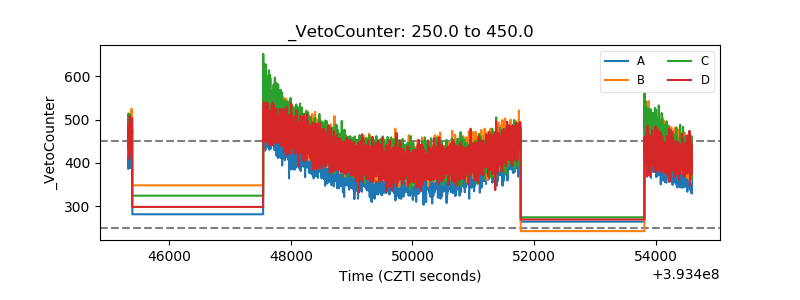 |