| Param | Original file | Final file |
|---|---|---|
| Filename | modeM0/AS1A11_097T24_9000005196_36378cztM0_level2.evt | modeM0/AS1A11_097T24_9000005196_36378cztM0_level2_quad_clean.evt |
| Size (bytes) | 485,429,760 | 80,815,680 |
| Size | 462.9 MB | 77.1 MB |
| Events in quadrant A | 3,003,737 | 561,213 |
| Events in quadrant B | 3,346,247 | 555,442 |
| Events in quadrant C | 2,968,538 | 552,323 |
| Events in quadrant D | 5,052,822 | 436,490 |
| Mode SS | |||
|---|---|---|---|
| Quadrant | BADHDUFLAG | Total packets | Discarded packets |
| A | 0 | 98 | 0 |
| B | 0 | 98 | 0 |
| C | 0 | 98 | 0 |
| D | 0 | 98 | 0 |
| Mode M9 | |||
|---|---|---|---|
| Quadrant | BADHDUFLAG | Total packets | Discarded packets |
| A | 0 | 23 | 0 |
| B | 0 | 23 | 0 |
| C | 0 | 23 | 0 |
| D | 0 | 24 | 0 |
| Mode M0 | |||
|---|---|---|---|
| Quadrant | BADHDUFLAG | Total packets | Discarded packets |
| A | 0 | 11978 | 3 |
| B | 0 | 13042 | 2 |
| C | 0 | 11659 | 2 |
| D | 0 | 18375 | 2 |
| Quadrant | Total seconds | Saturated seconds | Saturation percentage |
|---|---|---|---|
| A | 4871 | 121 | 2.484090% |
| B | 4871 | 189 | 3.880107% |
| C | 4871 | 94 | 1.929789% |
| D | 4871 | 956 | 19.626360% |
Noise dominated data is calculated using 1-second bins in cleaned event files. If a bin has >2000 counts, and if more than 50% of those come from <1% of pixels, then it is considered to be noise-dominated and hence unusable.
| Quadrant | # 1 sec bins | Bins with >0 counts | Bins with >2000 counts | High rate bins dominated by noise | Noise dominated (total time) | Noise dominated (detector-on time) | Marked lightcurve |
|---|---|---|---|---|---|---|---|
| A | 7024 | 4872 | 78 | 78 | 1.11% | 1.60% | 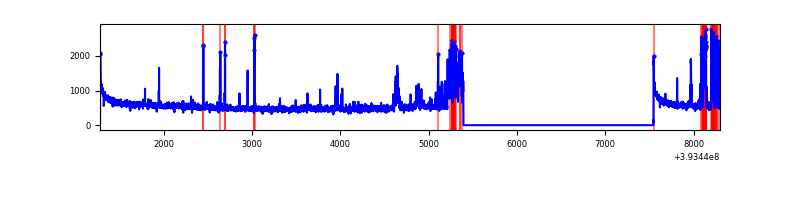 |
| B | 7024 | 4872 | 150 | 150 | 2.14% | 3.08% | 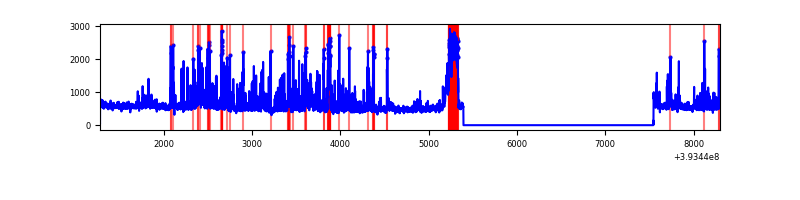 |
| C | 7024 | 4872 | 70 | 70 | 1.00% | 1.44% | 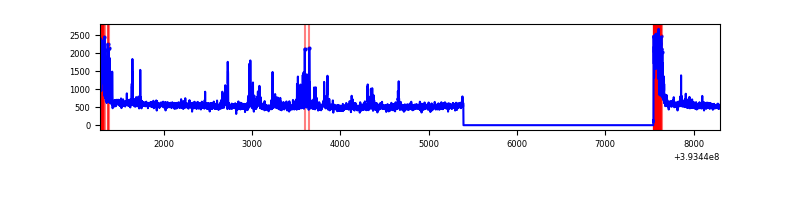 |
| D | 7024 | 4872 | 882 | 882 | 12.56% | 18.10% | 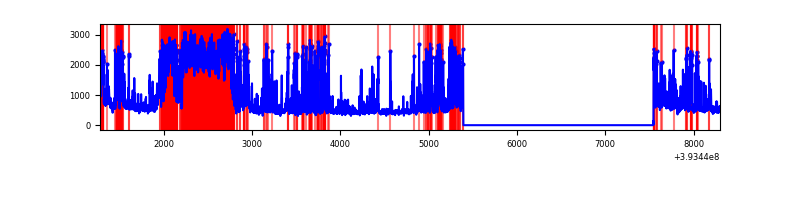 |
Top three noisy pixels from each quadrant. If the there are fewer than three noisy pixels in the level2.evt file, extra rows are filled as -1
| Pixel properties | Quadrant properties | ||||||
|---|---|---|---|---|---|---|---|
| Quadrant | DetID | PixID | Counts | Sigma | Mean | Median | Sigma |
| A | 15 | 223 | 391294 | 3269.08 | 606 | 597 | 119.5 |
| A | 10 | 83 | 174674 | 1456.55 | 606 | 597 | 119.5 |
| A | 7 | 16 | 38685 | 318.69 | 606 | 597 | 119.5 |
| B | 5 | 172 | 535174 | 4705.8 | 598 | 586 | 113.6 |
| B | 5 | 255 | 319381 | 2806.25 | 598 | 586 | 113.6 |
| B | 4 | 171 | 88594 | 774.71 | 598 | 586 | 113.6 |
| C | 0 | 10 | 259522 | 1879.17 | 593 | 598 | 137.8 |
| C | 15 | 214 | 210707 | 1524.89 | 593 | 598 | 137.8 |
| C | 4 | 254 | 155144 | 1121.63 | 593 | 598 | 137.8 |
| D | 12 | 6 | 2219847 | 17686.32 | 518 | 506 | 125.5 |
| D | 2 | 250 | 250443 | 1991.79 | 518 | 506 | 125.5 |
| D | 7 | 223 | 134801 | 1070.22 | 518 | 506 | 125.5 |
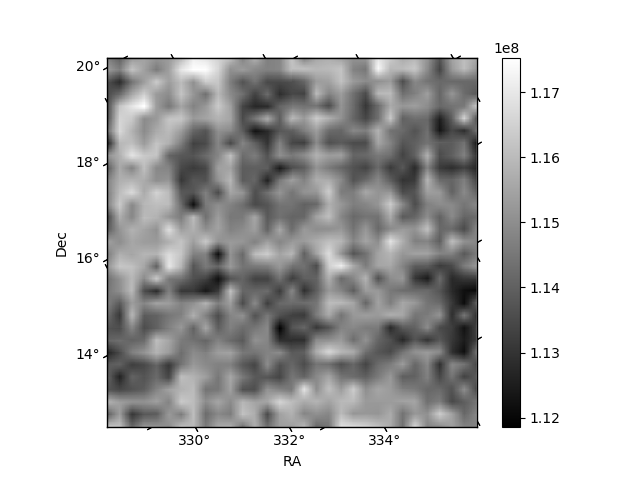
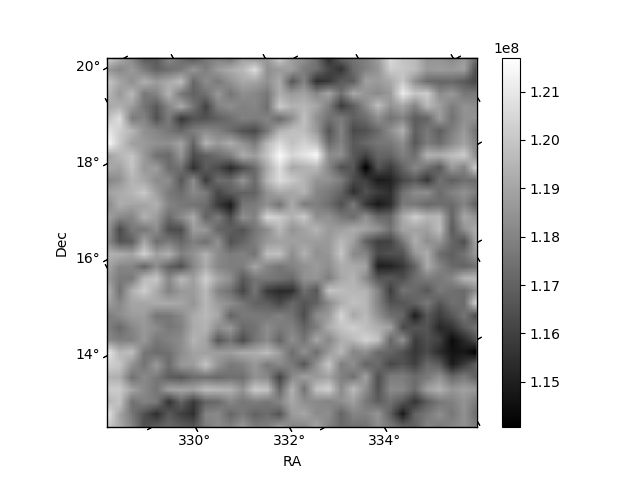
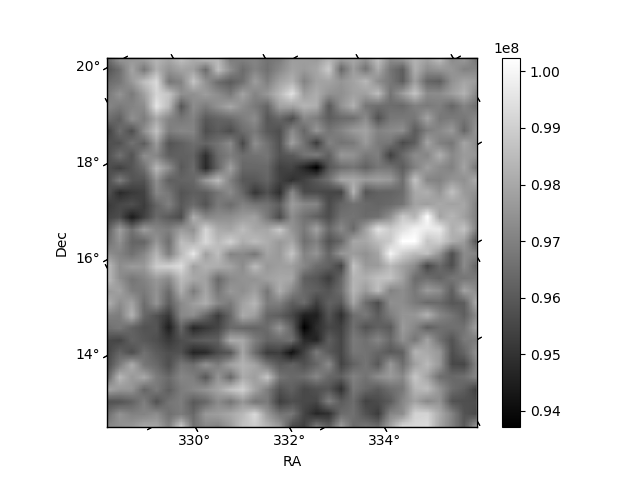
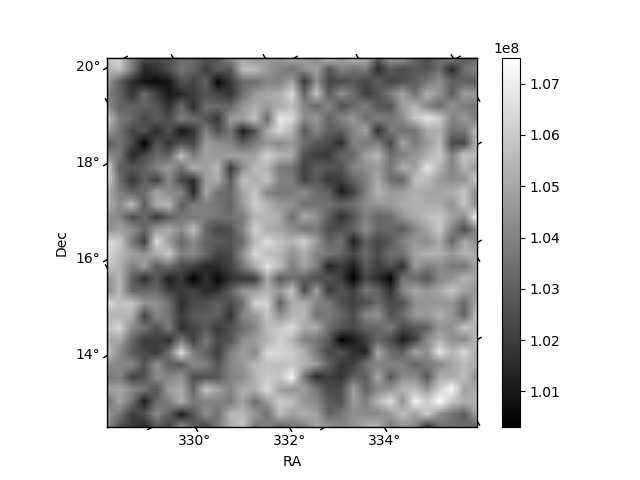
Histogram calculated using DETX and DETY for each event in the final _common_clean file
| Quadrant A | 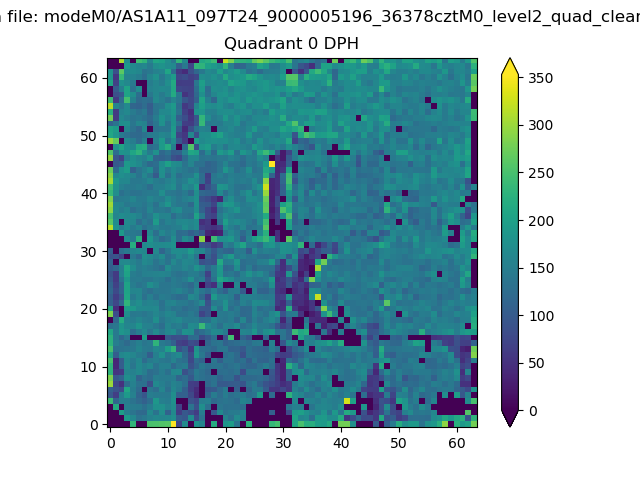 |
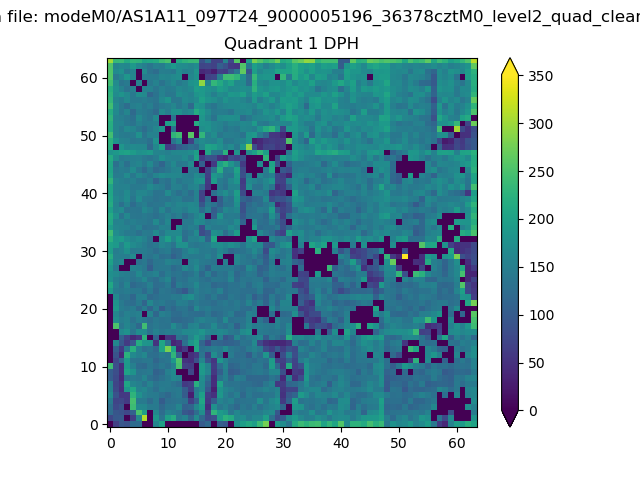 |
Quadrant B |
|---|---|---|---|
| Quadrant D | 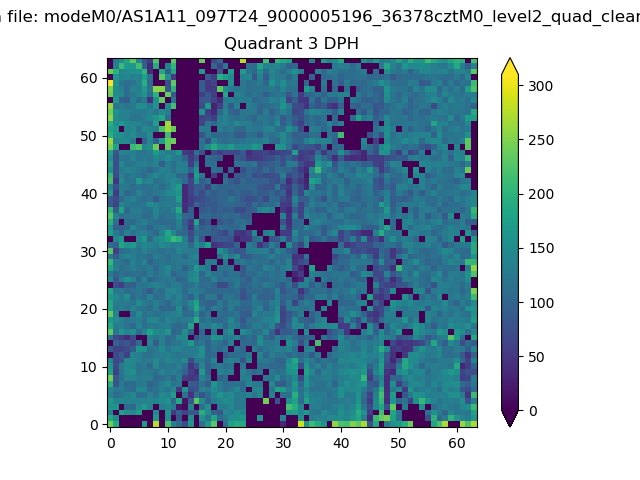 |
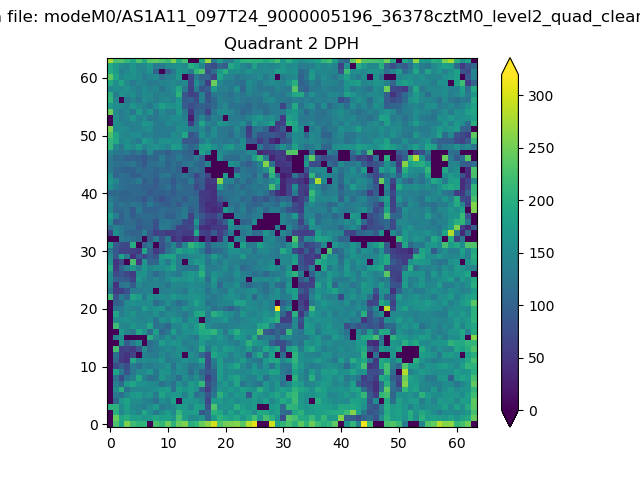 |
Quadrant C |
| Plot type | Count rate plots | Images |
|---|---|---|
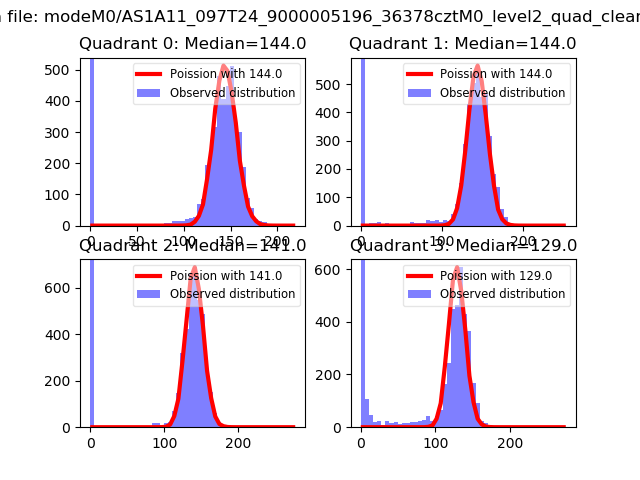
| Comparison with Poisson distribution Blue bars denote a histogram of data divided into 1 sec bins. Red curve is a Poisson curve with rate = median count rate of data. |
 |
 |
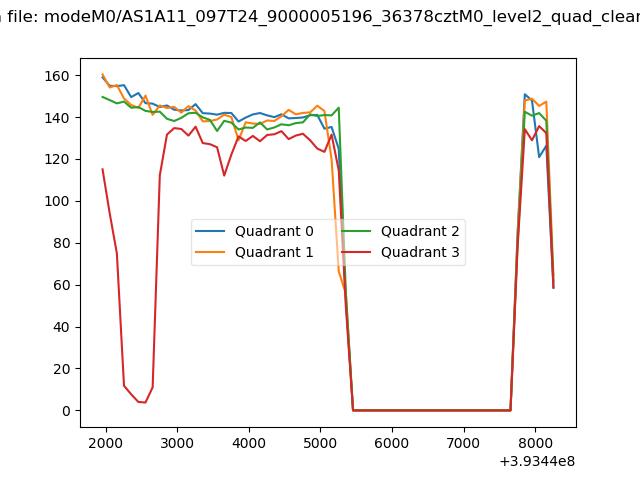
| Quadrant-wise count rates Data is divided into 100 sec bins |
 |
|
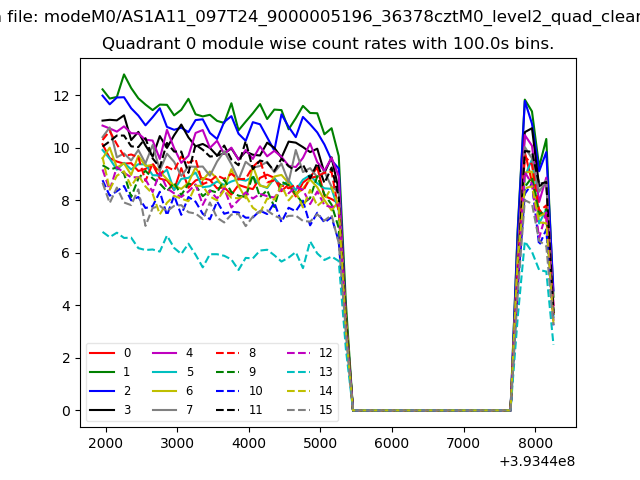
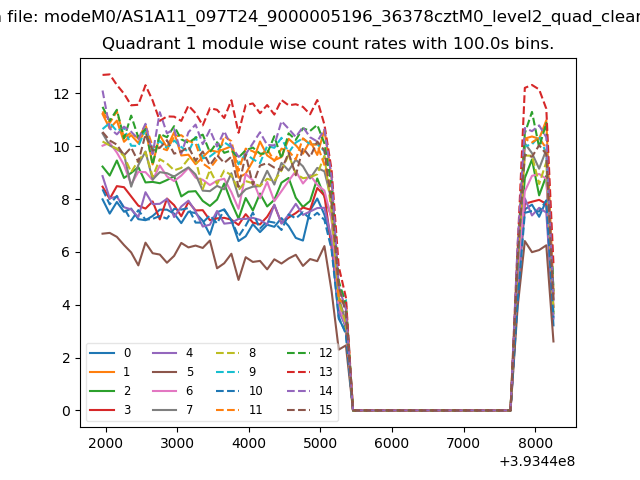
| Module-wise count rates for Quadrant A Data is divided into 100 sec bins |
 |
 |
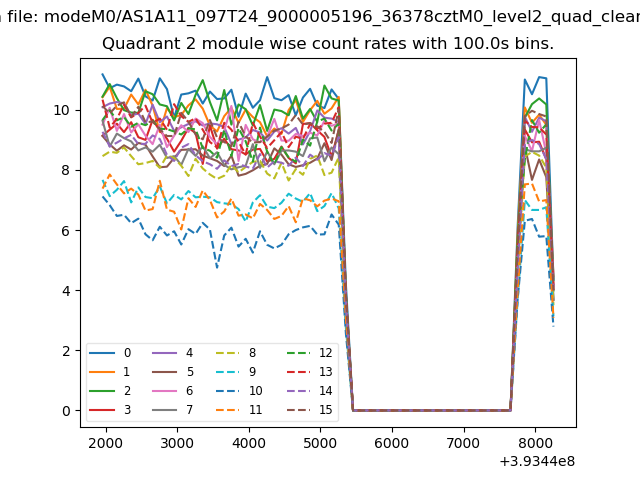
| Module-wise count rates for Quadrant B Data is divided into 100 sec bins |
 |
 |
| Module-wise count rates for Quadrant C Data is divided into 100 sec bins |
 |
 |
| Module-wise count rates for Quadrant D Data is divided into 100 sec bins |
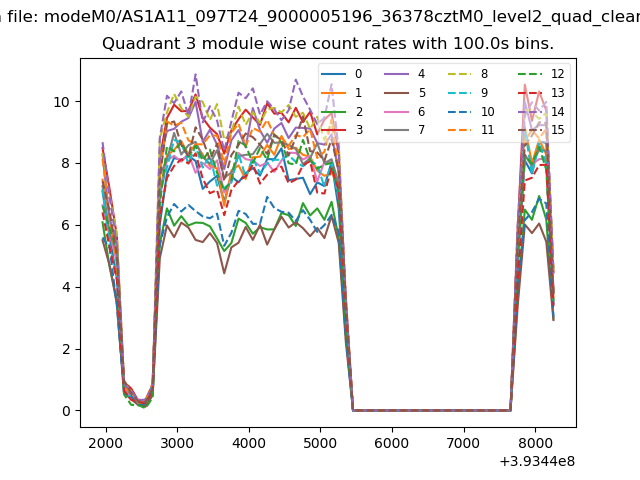 |
 |
| Parameter | Plot |
|---|---|
| CZT HV Monitor | 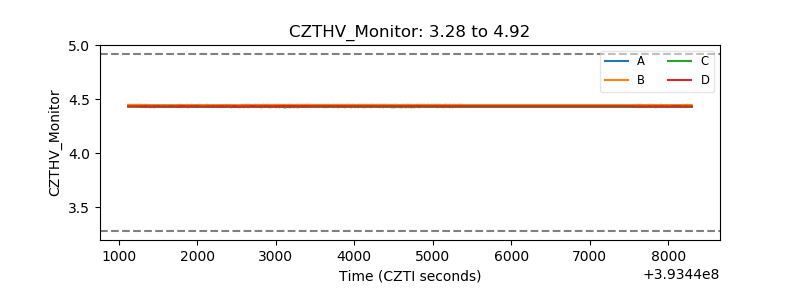 |
| D_VDD | 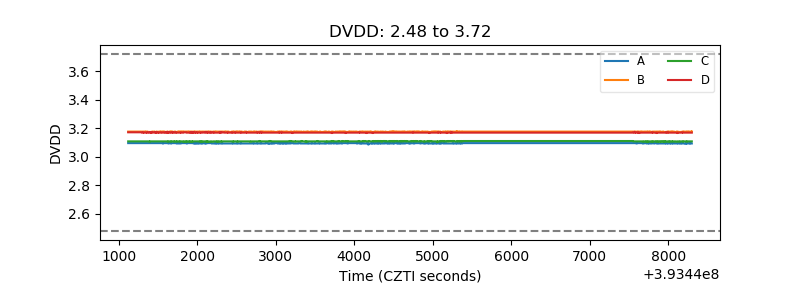 |
| Temperature 1 | 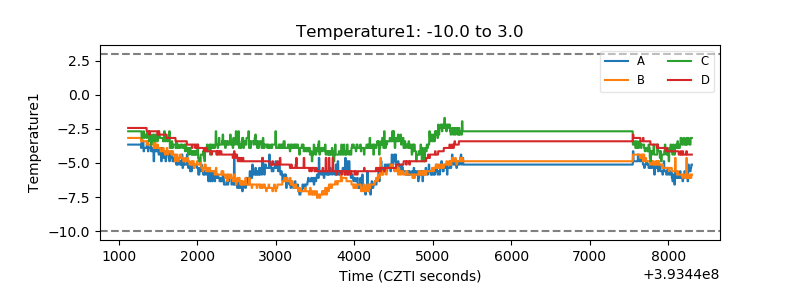 |
| Veto HV Monitor | 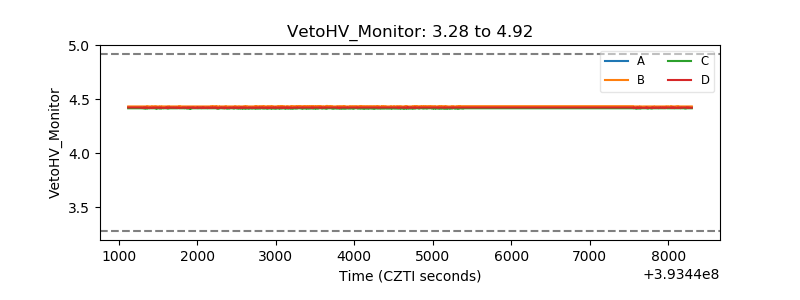 |
| Veto LLD | 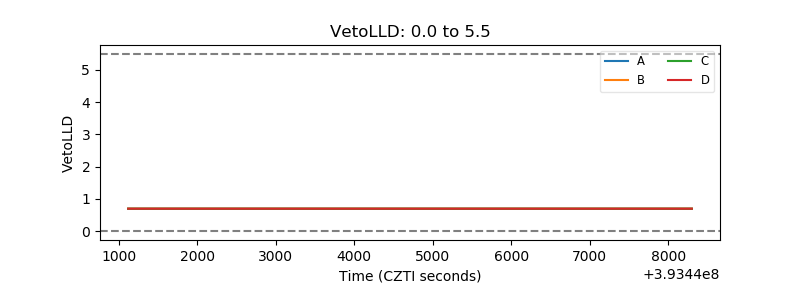 |
| Alpha Counter | 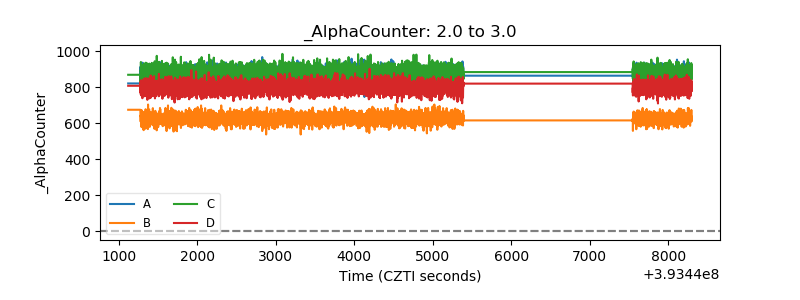 |
| _CPM_Rate | 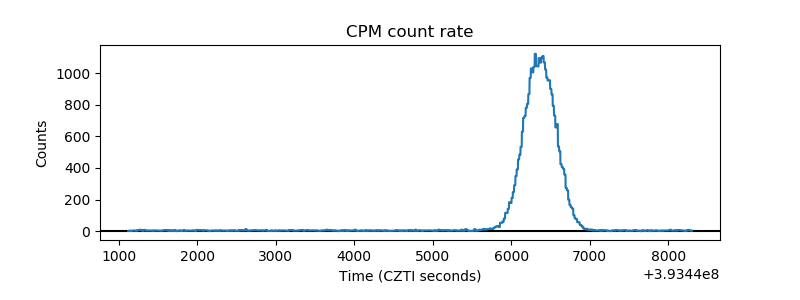 |
| CZT Counter | 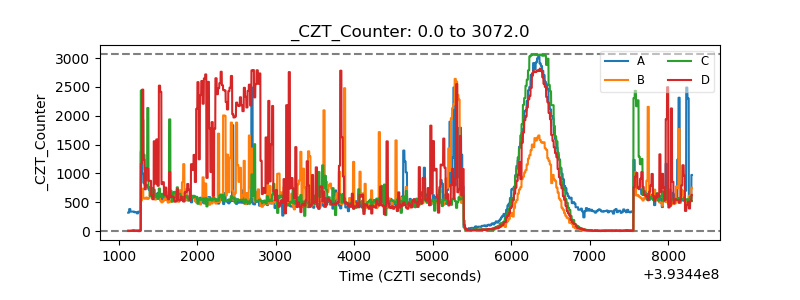 |
| +2.5 Volts monitor | 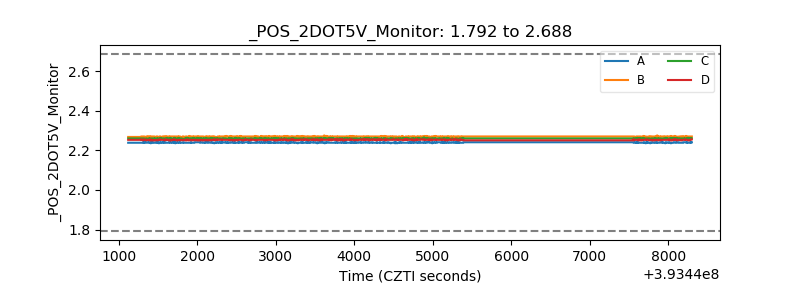 |
| +5 Volts monitor | 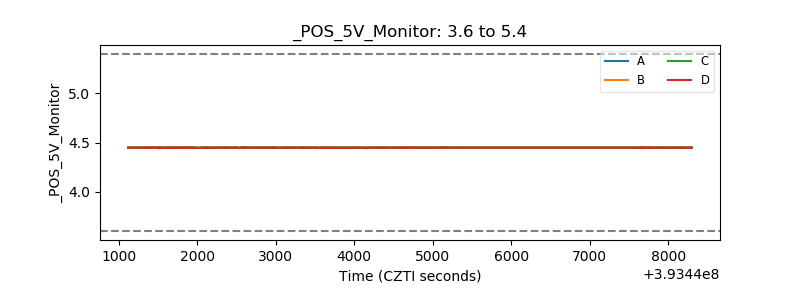 |
| _ROLL_ROT | 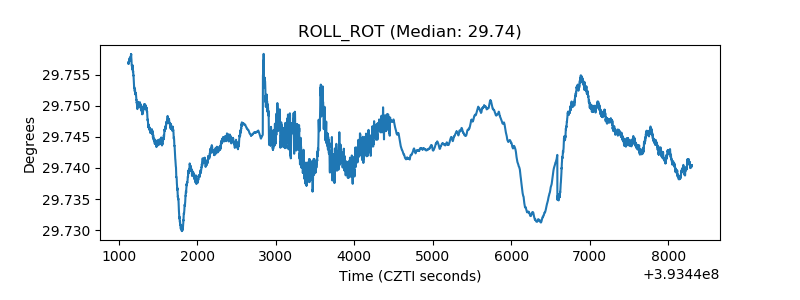 |
| _Roll_DEC | 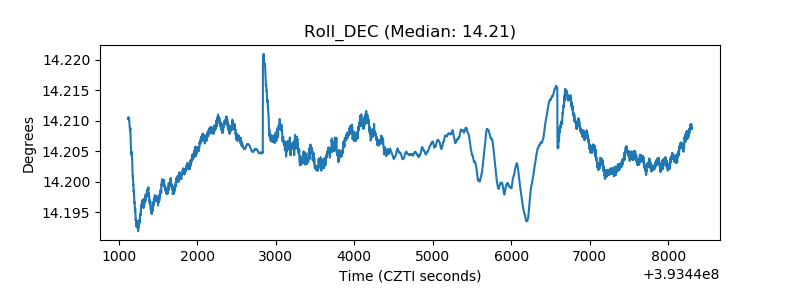 |
| _Roll_RA | 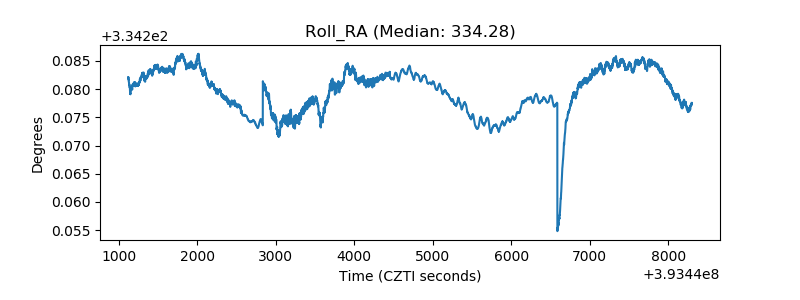 |
| Veto Counter | 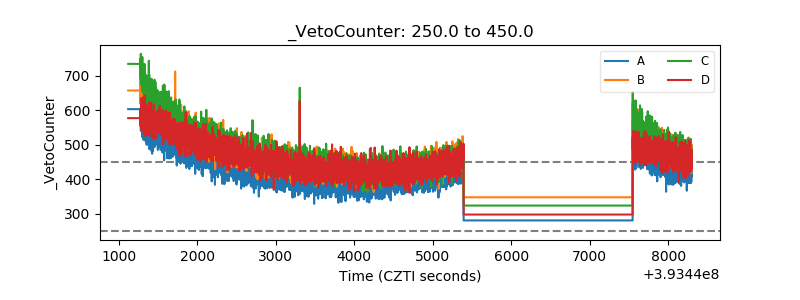 |