| Param | Original file | Final file |
|---|---|---|
| Filename | modeM0/AS1A11_097T24_9000005196_36377cztM0_level2.evt | modeM0/AS1A11_097T24_9000005196_36377cztM0_level2_quad_clean.evt |
| Size (bytes) | 512,095,680 | 68,322,240 |
| Size | 488.4 MB | 65.2 MB |
| Events in quadrant A | 2,858,908 | 476,369 |
| Events in quadrant B | 3,796,795 | 452,741 |
| Events in quadrant C | 3,008,652 | 459,150 |
| Events in quadrant D | 5,506,448 | 330,237 |
| Mode SS | |||
|---|---|---|---|
| Quadrant | BADHDUFLAG | Total packets | Discarded packets |
| A | 0 | 102 | 0 |
| B | 0 | 102 | 0 |
| C | 0 | 102 | 0 |
| D | 0 | 102 | 0 |
| Mode M9 | |||
|---|---|---|---|
| Quadrant | BADHDUFLAG | Total packets | Discarded packets |
| A | 0 | 31 | 0 |
| B | 0 | 31 | 0 |
| C | 0 | 31 | 0 |
| D | 0 | 32 | 0 |
| Mode M0 | |||
|---|---|---|---|
| Quadrant | BADHDUFLAG | Total packets | Discarded packets |
| A | 0 | 11558 | 3 |
| B | 0 | 14513 | 2 |
| C | 0 | 11880 | 2 |
| D | 0 | 19674 | 2 |
| Quadrant | Total seconds | Saturated seconds | Saturation percentage |
|---|---|---|---|
| A | 4985 | 25 | 0.501505% |
| B | 4985 | 366 | 7.342026% |
| C | 4985 | 78 | 1.564694% |
| D | 4985 | 1085 | 21.765296% |
Noise dominated data is calculated using 1-second bins in cleaned event files. If a bin has >2000 counts, and if more than 50% of those come from <1% of pixels, then it is considered to be noise-dominated and hence unusable.
| Quadrant | # 1 sec bins | Bins with >0 counts | Bins with >2000 counts | High rate bins dominated by noise | Noise dominated (total time) | Noise dominated (detector-on time) | Marked lightcurve |
|---|---|---|---|---|---|---|---|
| A | 7108 | 4986 | 17 | 17 | 0.24% | 0.34% | 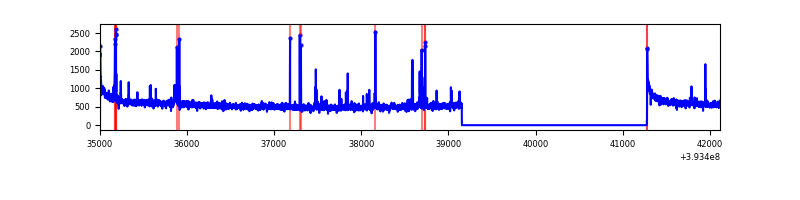 |
| B | 7108 | 4986 | 304 | 304 | 4.28% | 6.10% | 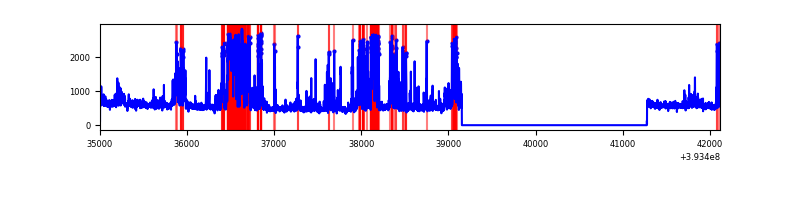 |
| C | 7108 | 4986 | 57 | 57 | 0.80% | 1.14% | 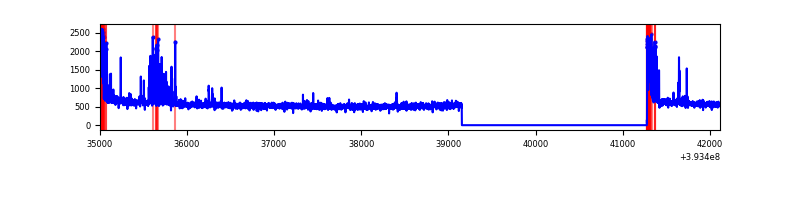 |
| D | 7108 | 4986 | 1082 | 1082 | 15.22% | 21.70% | 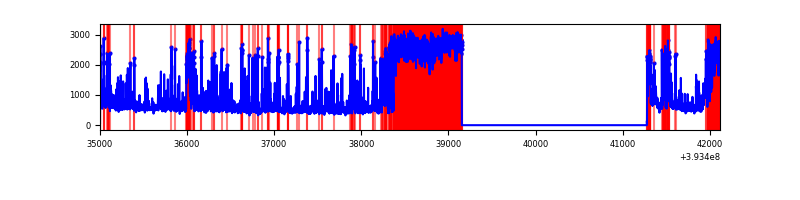 |
Top three noisy pixels from each quadrant. If the there are fewer than three noisy pixels in the level2.evt file, extra rows are filled as -1
| Pixel properties | Quadrant properties | ||||||
|---|---|---|---|---|---|---|---|
| Quadrant | DetID | PixID | Counts | Sigma | Mean | Median | Sigma |
| A | 10 | 83 | 179890 | 1369.89 | 654 | 644 | 130.8 |
| A | 7 | 16 | 97752 | 742.15 | 654 | 644 | 130.8 |
| A | 15 | 223 | 36387 | 273.17 | 654 | 644 | 130.8 |
| B | 5 | 172 | 962220 | 7954.22 | 634 | 620 | 120.9 |
| B | 5 | 255 | 151832 | 1250.8 | 634 | 620 | 120.9 |
| B | 4 | 171 | 119599 | 984.18 | 634 | 620 | 120.9 |
| C | 15 | 214 | 215657 | 1475.92 | 633 | 640 | 145.7 |
| C | 0 | 10 | 186680 | 1277.02 | 633 | 640 | 145.7 |
| C | 0 | 207 | 121596 | 830.27 | 633 | 640 | 145.7 |
| D | 12 | 6 | 2486836 | 19110.06 | 538 | 525 | 130.1 |
| D | 2 | 250 | 446466 | 3427.55 | 538 | 525 | 130.1 |
| D | 2 | 249 | 123699 | 946.73 | 538 | 525 | 130.1 |
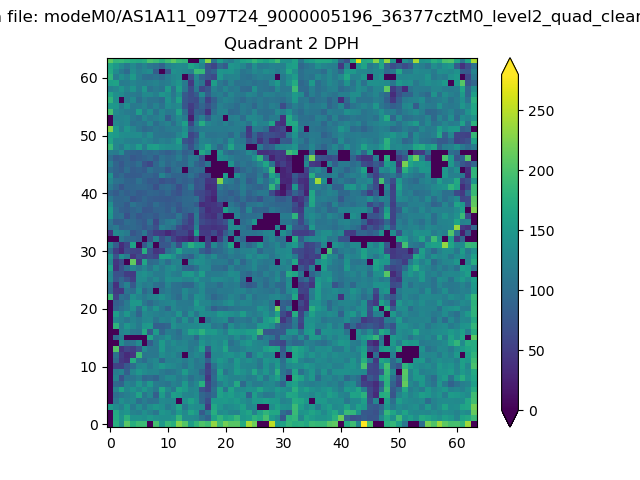
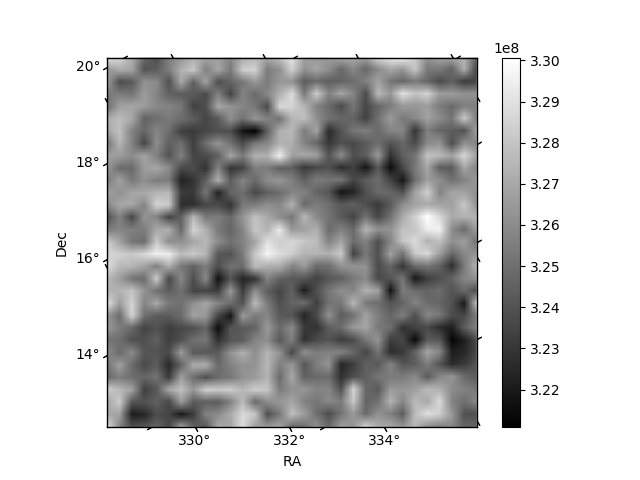
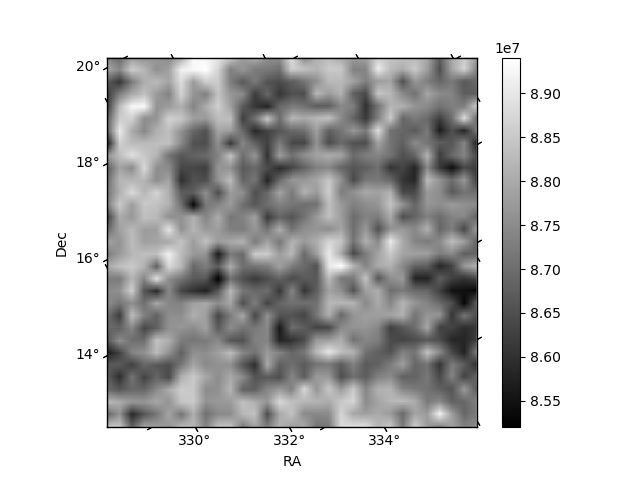
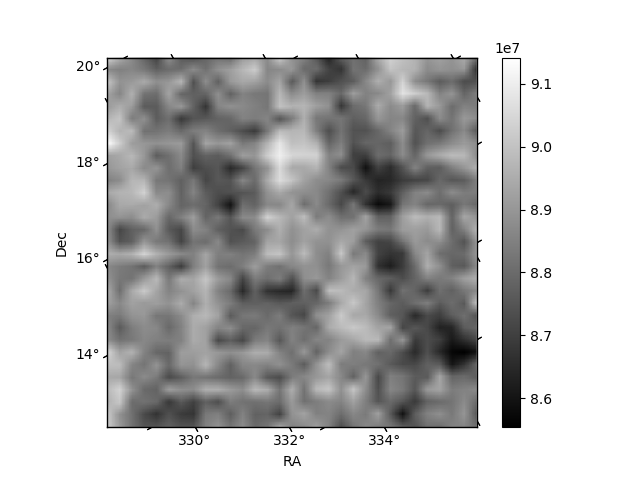
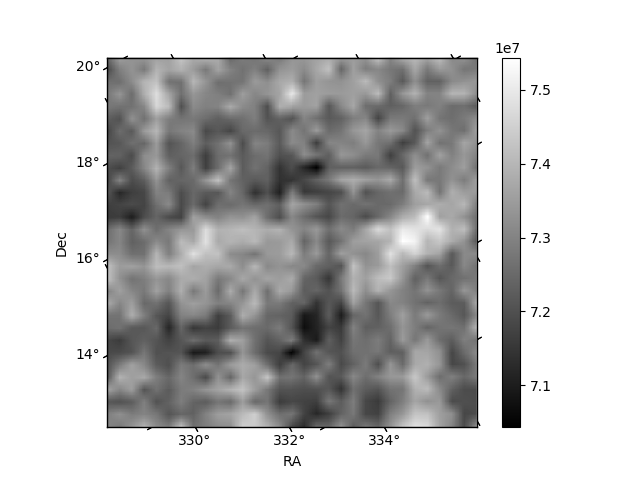
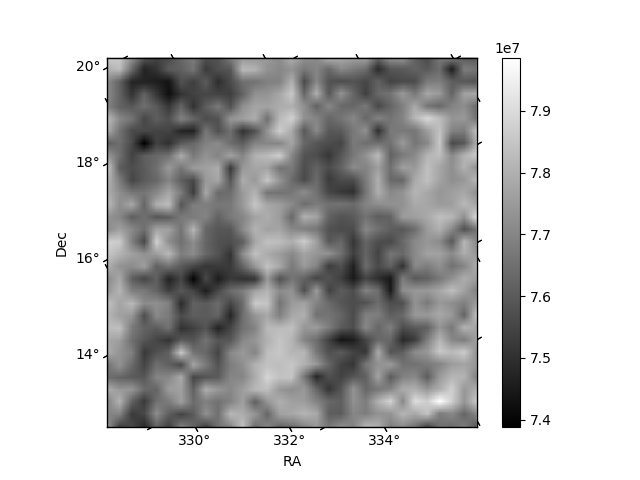
Histogram calculated using DETX and DETY for each event in the final _common_clean file
| Quadrant A | 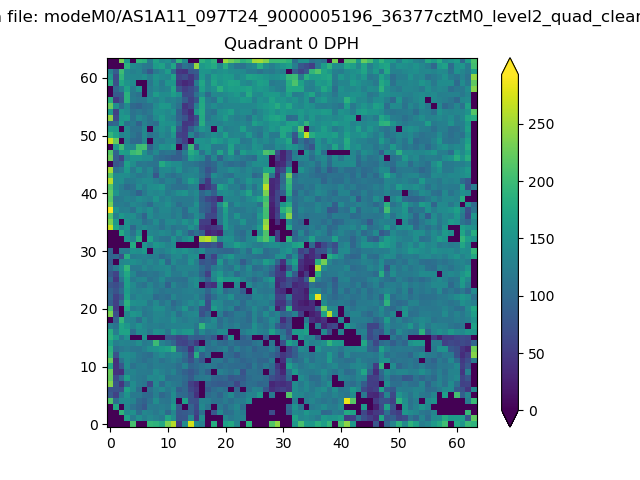 |
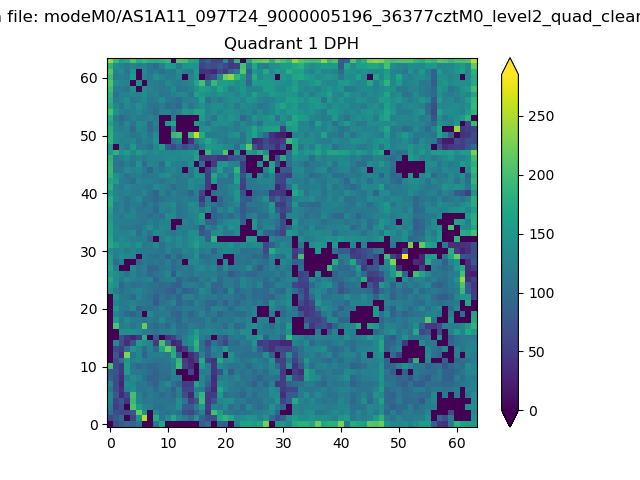 |
Quadrant B |
|---|---|---|---|
| Quadrant D | 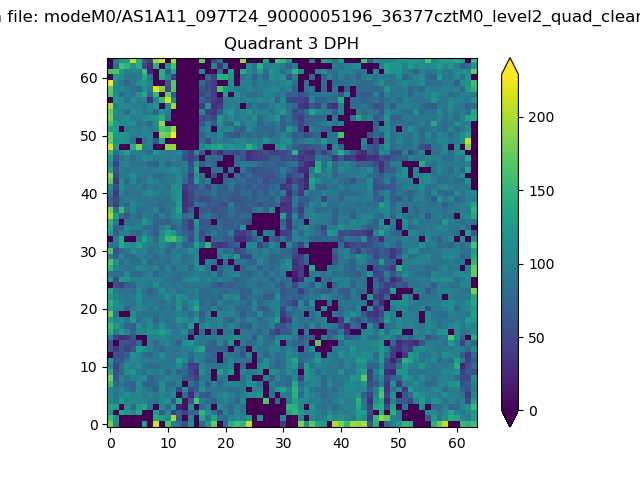 |
 |
Quadrant C |
| Plot type | Count rate plots | Images |
|---|---|---|
| Comparison with Poisson distribution Blue bars denote a histogram of data divided into 1 sec bins. Red curve is a Poisson curve with rate = median count rate of data. |
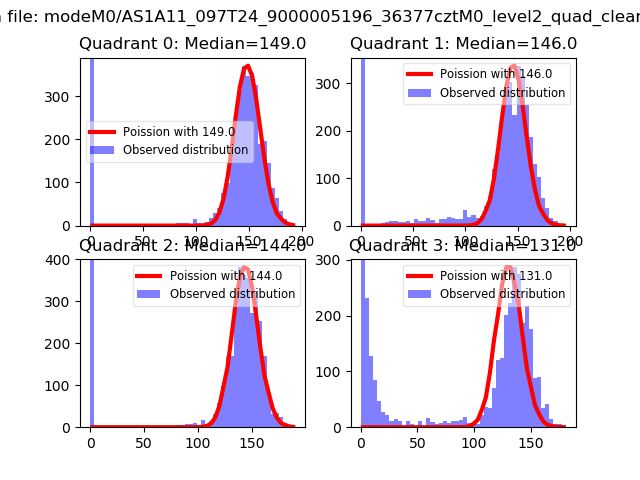 |
 |
| Quadrant-wise count rates Data is divided into 100 sec bins |
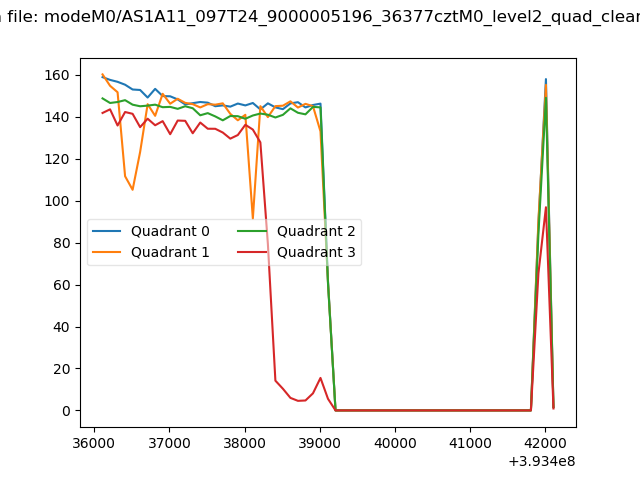 |
|
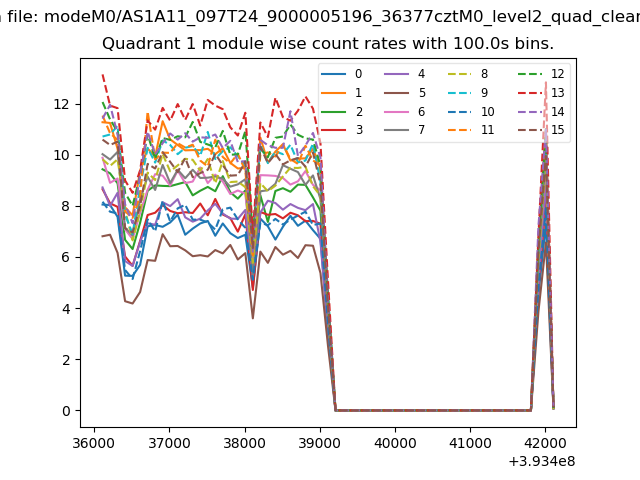
| Module-wise count rates for Quadrant A Data is divided into 100 sec bins |
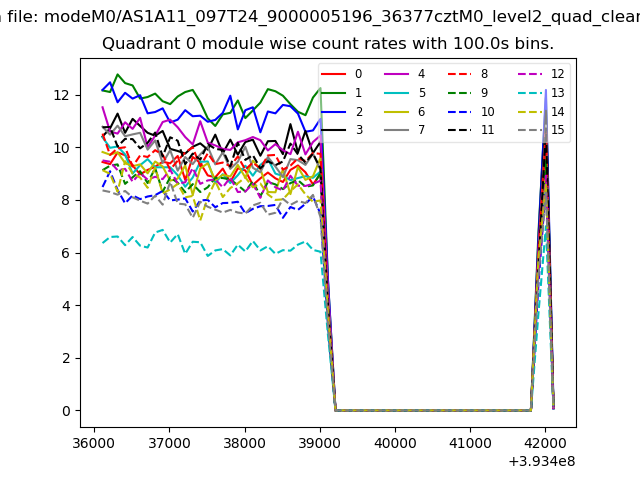 |
 |
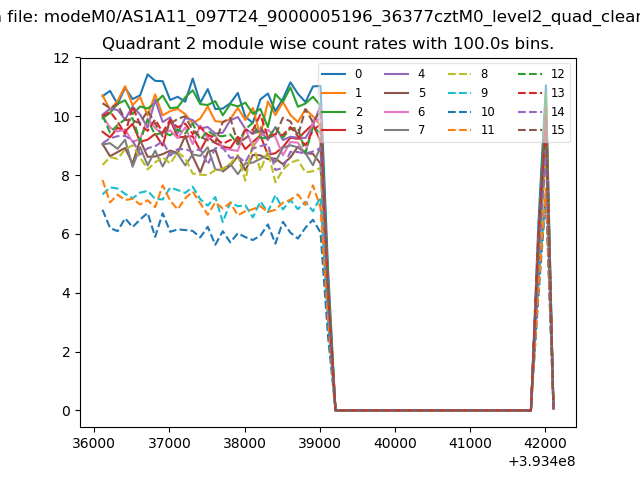
| Module-wise count rates for Quadrant B Data is divided into 100 sec bins |
 |
 |
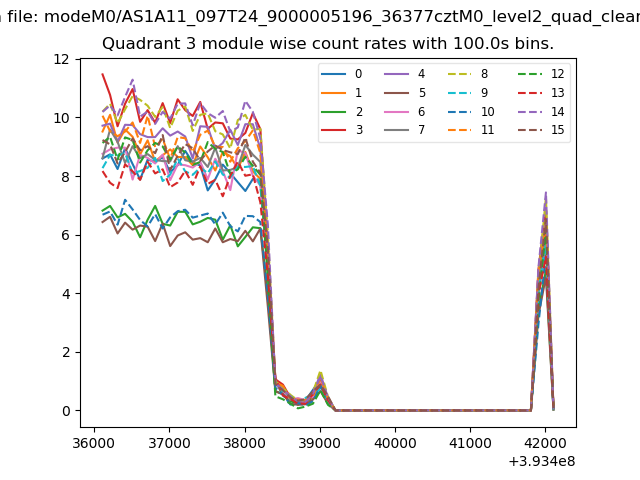
| Module-wise count rates for Quadrant C Data is divided into 100 sec bins |
 |
 |
| Module-wise count rates for Quadrant D Data is divided into 100 sec bins |
 |
 |
| Parameter | Plot |
|---|---|
| CZT HV Monitor | 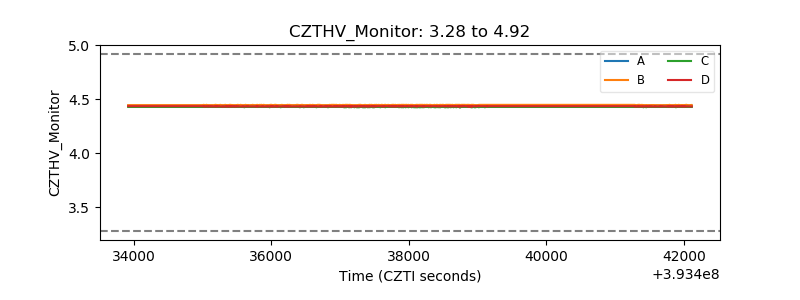 |
| D_VDD | 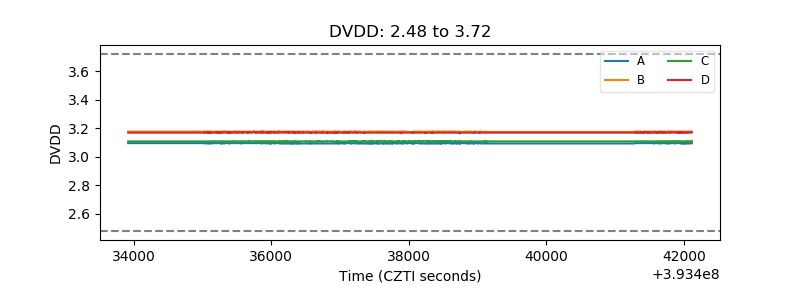 |
| Temperature 1 |  |
| Veto HV Monitor |  |
| Veto LLD | 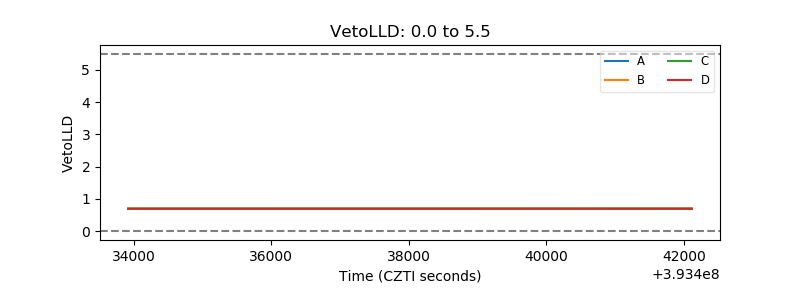 |
| Alpha Counter | 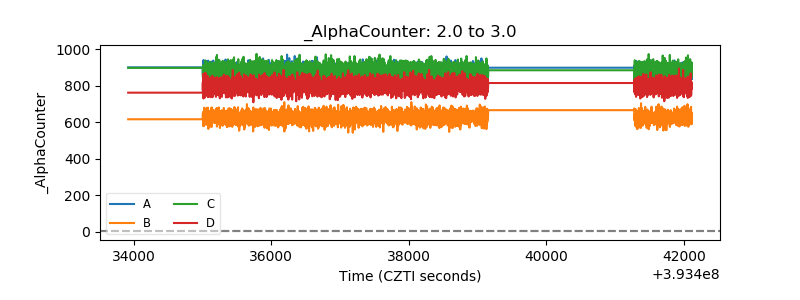 |
| _CPM_Rate | 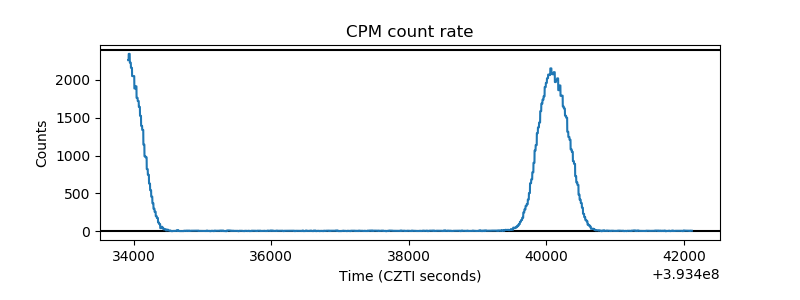 |
| CZT Counter | 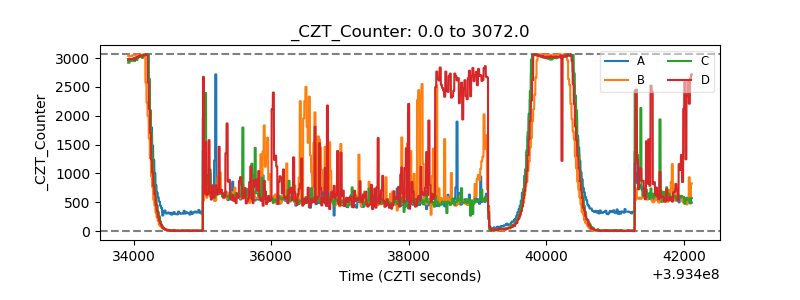 |
| +2.5 Volts monitor | 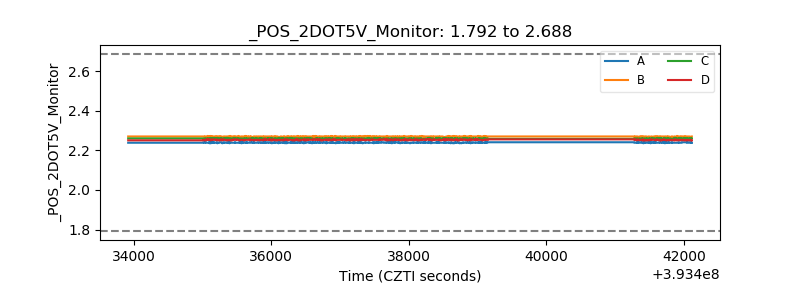 |
| +5 Volts monitor | 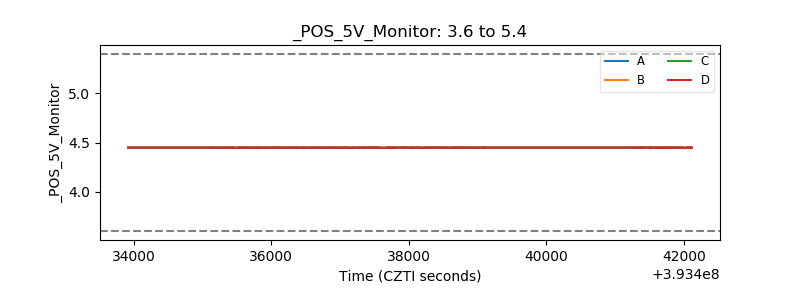 |
| _ROLL_ROT | 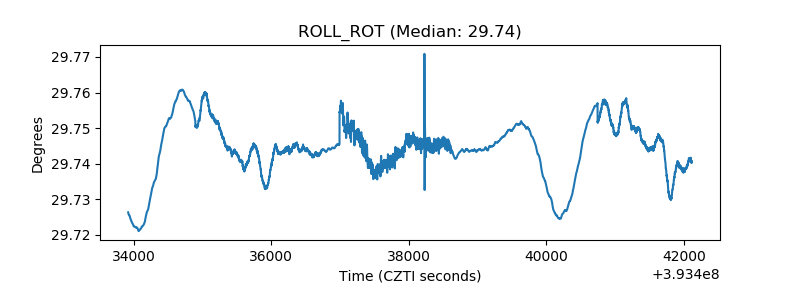 |
| _Roll_DEC | 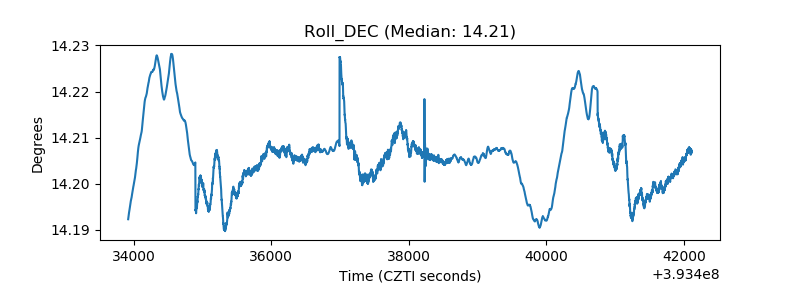 |
| _Roll_RA | 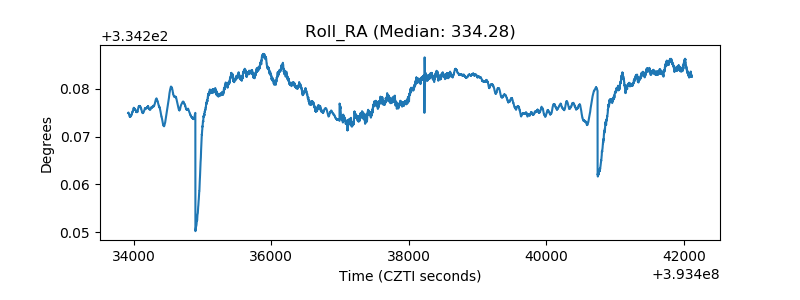 |
| Veto Counter | 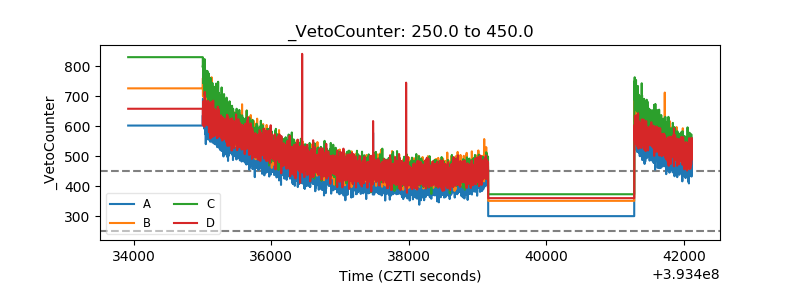 |