| Param | Original file | Final file |
|---|---|---|
| Filename | modeM0/AS1A11_097T24_9000005196_36376cztM0_level2.evt | modeM0/AS1A11_097T24_9000005196_36376cztM0_level2_quad_clean.evt |
| Size (bytes) | 422,072,640 | 61,683,840 |
| Size | 402.5 MB | 58.8 MB |
| Events in quadrant A | 2,836,355 | 394,832 |
| Events in quadrant B | 3,184,444 | 388,979 |
| Events in quadrant C | 2,992,481 | 378,008 |
| Events in quadrant D | 3,431,184 | 356,337 |
| Mode SS | |||
|---|---|---|---|
| Quadrant | BADHDUFLAG | Total packets | Discarded packets |
| A | 0 | 102 | 0 |
| B | 0 | 102 | 0 |
| C | 0 | 102 | 0 |
| D | 0 | 102 | 0 |
| Mode M9 | |||
|---|---|---|---|
| Quadrant | BADHDUFLAG | Total packets | Discarded packets |
| A | 0 | 33 | 0 |
| B | 0 | 33 | 0 |
| C | 0 | 33 | 0 |
| D | 0 | 34 | 0 |
| Mode M0 | |||
|---|---|---|---|
| Quadrant | BADHDUFLAG | Total packets | Discarded packets |
| A | 0 | 11572 | 3 |
| B | 0 | 12681 | 2 |
| C | 0 | 11840 | 2 |
| D | 0 | 13405 | 2 |
| Quadrant | Total seconds | Saturated seconds | Saturation percentage |
|---|---|---|---|
| A | 4980 | 23 | 0.461847% |
| B | 4980 | 66 | 1.325301% |
| C | 4980 | 95 | 1.907631% |
| D | 4980 | 138 | 2.771084% |
Noise dominated data is calculated using 1-second bins in cleaned event files. If a bin has >2000 counts, and if more than 50% of those come from <1% of pixels, then it is considered to be noise-dominated and hence unusable.
| Quadrant | # 1 sec bins | Bins with >0 counts | Bins with >2000 counts | High rate bins dominated by noise | Noise dominated (total time) | Noise dominated (detector-on time) | Marked lightcurve |
|---|---|---|---|---|---|---|---|
| A | 7013 | 4981 | 8 | 8 | 0.11% | 0.16% | 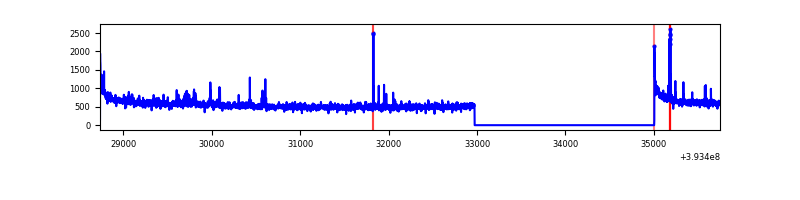 |
| B | 7013 | 4981 | 51 | 51 | 0.73% | 1.02% | 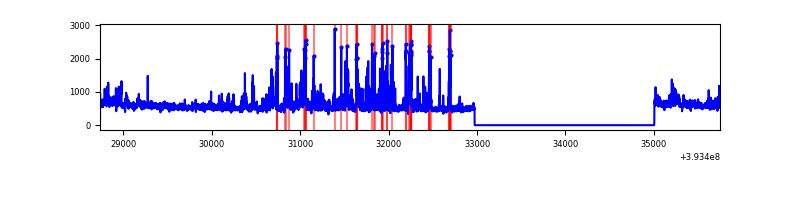 |
| C | 7013 | 4981 | 77 | 77 | 1.10% | 1.55% | 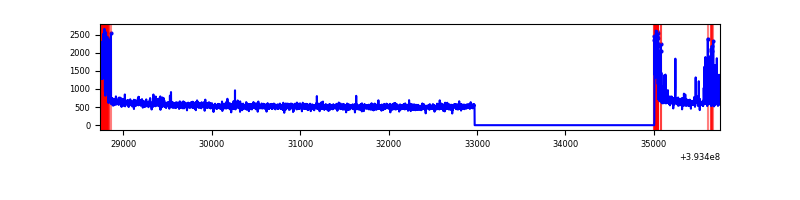 |
| D | 7013 | 4981 | 128 | 128 | 1.83% | 2.57% | 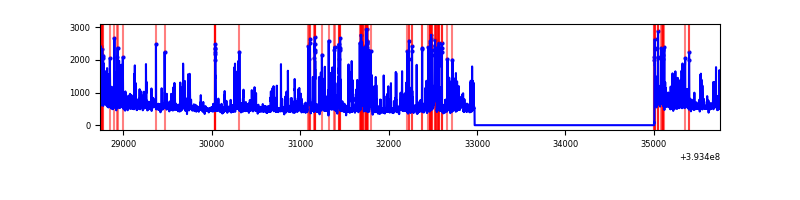 |
Top three noisy pixels from each quadrant. If the there are fewer than three noisy pixels in the level2.evt file, extra rows are filled as -1
| Pixel properties | Quadrant properties | ||||||
|---|---|---|---|---|---|---|---|
| Quadrant | DetID | PixID | Counts | Sigma | Mean | Median | Sigma |
| A | 10 | 83 | 179622 | 1362.9 | 657 | 647 | 131.3 |
| A | 15 | 223 | 91507 | 691.9 | 657 | 647 | 131.3 |
| A | 9 | 143 | 13460 | 97.57 | 657 | 647 | 131.3 |
| B | 5 | 172 | 411756 | 3394.36 | 647 | 632 | 121.1 |
| B | 5 | 255 | 124158 | 1019.86 | 647 | 632 | 121.1 |
| B | 0 | 189 | 69836 | 571.37 | 647 | 632 | 121.1 |
| C | 0 | 10 | 228042 | 1574.98 | 629 | 634 | 144.4 |
| C | 15 | 214 | 214354 | 1480.18 | 629 | 634 | 144.4 |
| C | 0 | 207 | 88841 | 610.9 | 629 | 634 | 144.4 |
| D | 12 | 6 | 260449 | 1721.78 | 628 | 612 | 150.9 |
| D | 13 | 249 | 221461 | 1463.43 | 628 | 612 | 150.9 |
| D | 2 | 250 | 166911 | 1101.96 | 628 | 612 | 150.9 |
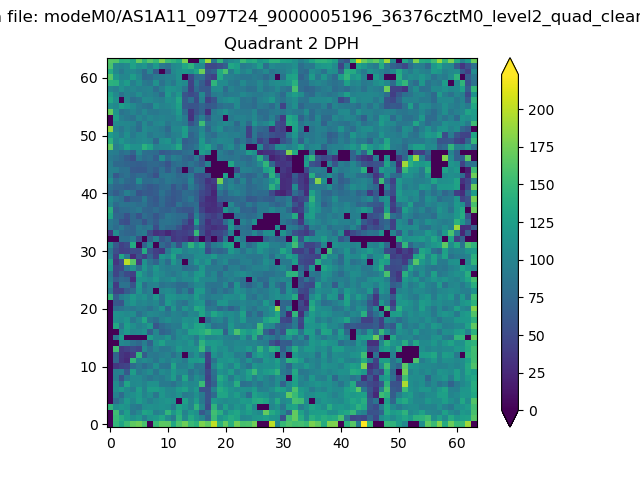
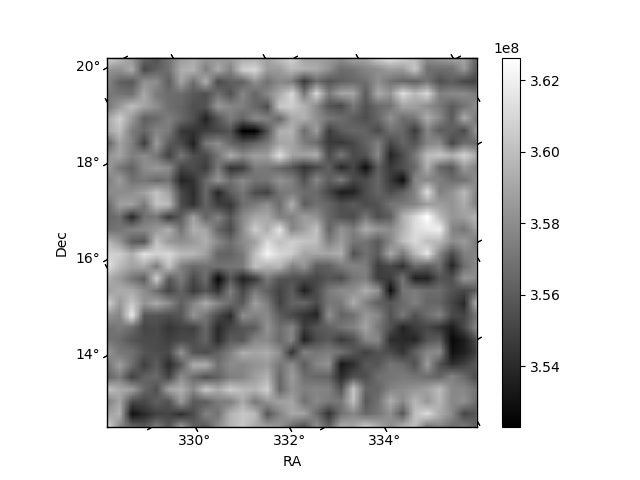
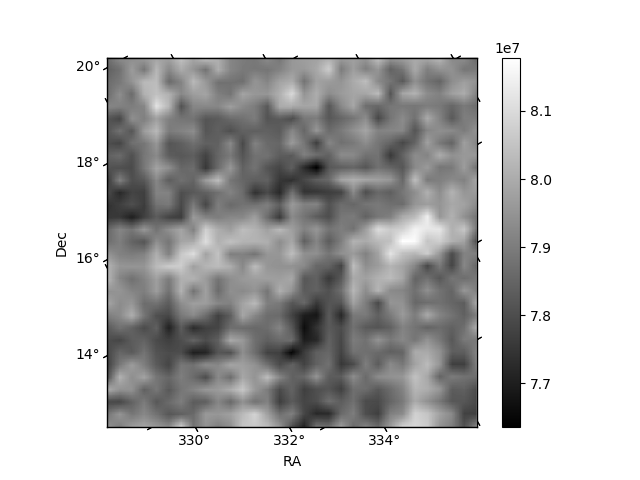
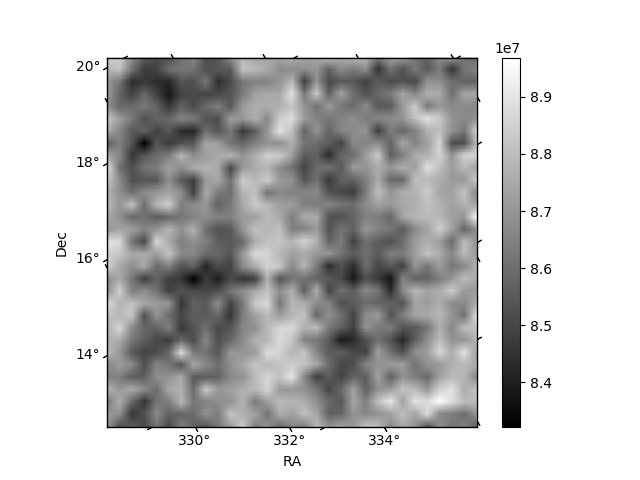
Histogram calculated using DETX and DETY for each event in the final _common_clean file
| Quadrant A | 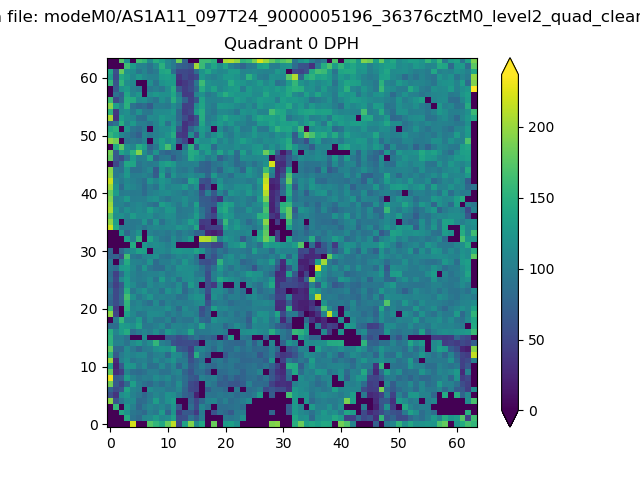 |
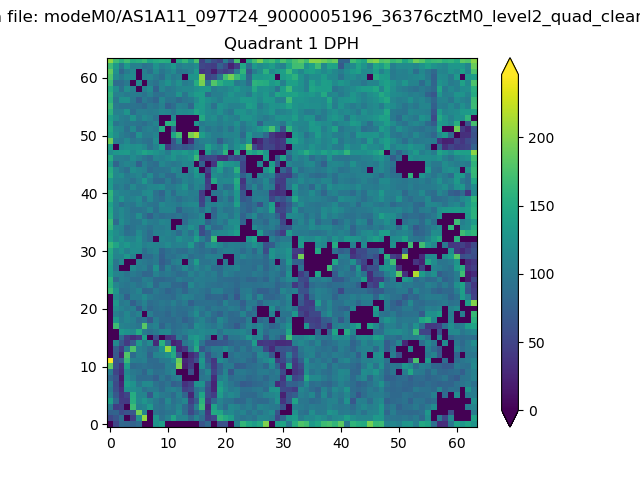 |
Quadrant B |
|---|---|---|---|
| Quadrant D | 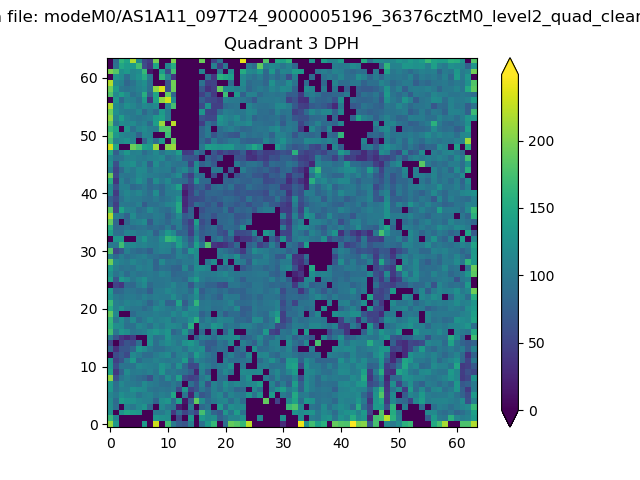 |
 |
Quadrant C |
| Plot type | Count rate plots | Images |
|---|---|---|
| Comparison with Poisson distribution Blue bars denote a histogram of data divided into 1 sec bins. Red curve is a Poisson curve with rate = median count rate of data. |
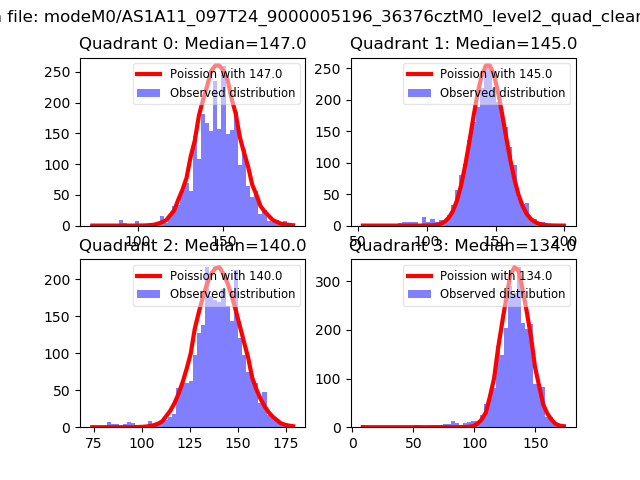 |
 |
| Quadrant-wise count rates Data is divided into 100 sec bins |
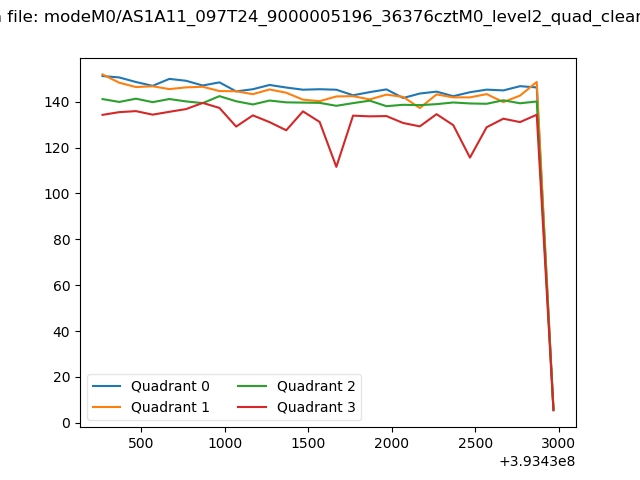 |
|
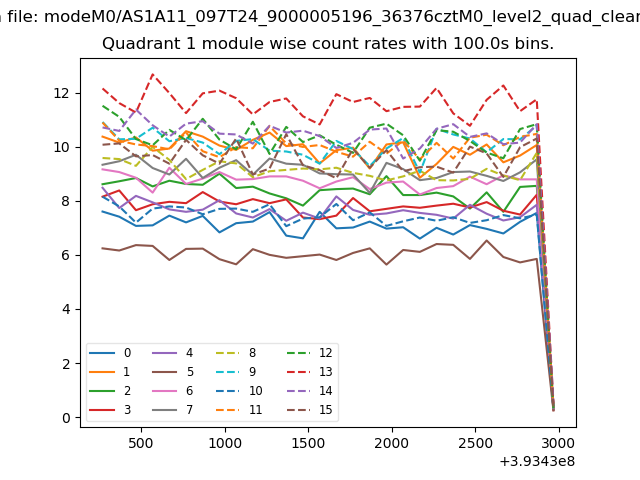
| Module-wise count rates for Quadrant A Data is divided into 100 sec bins |
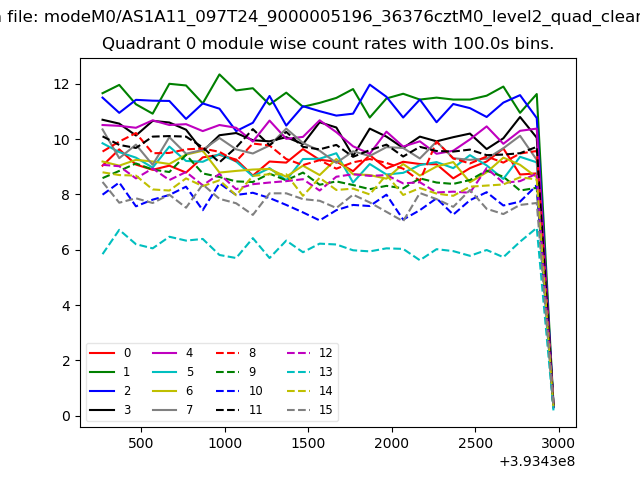 |
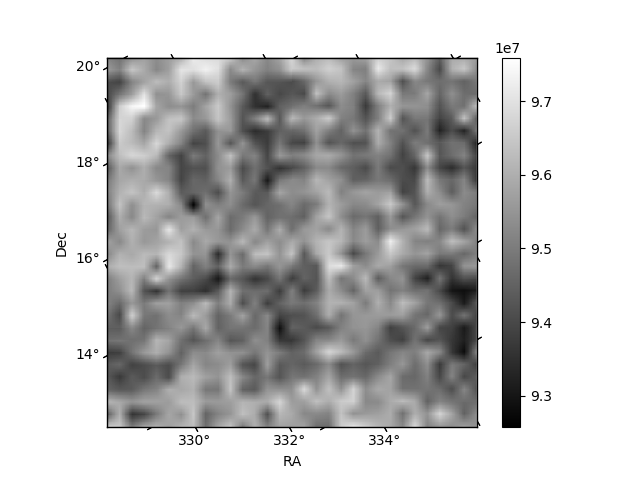 |
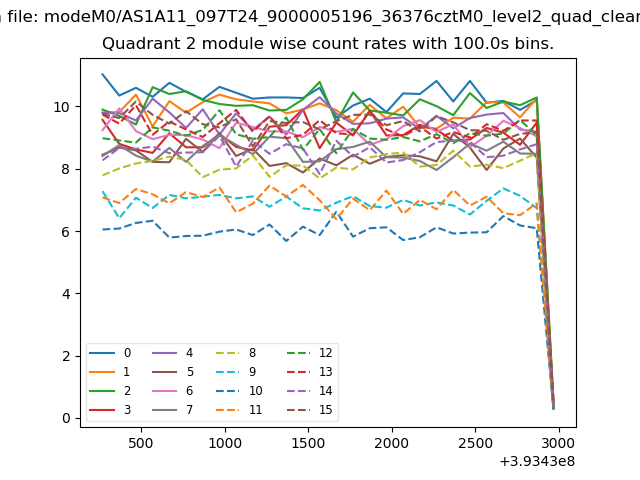
| Module-wise count rates for Quadrant B Data is divided into 100 sec bins |
 |
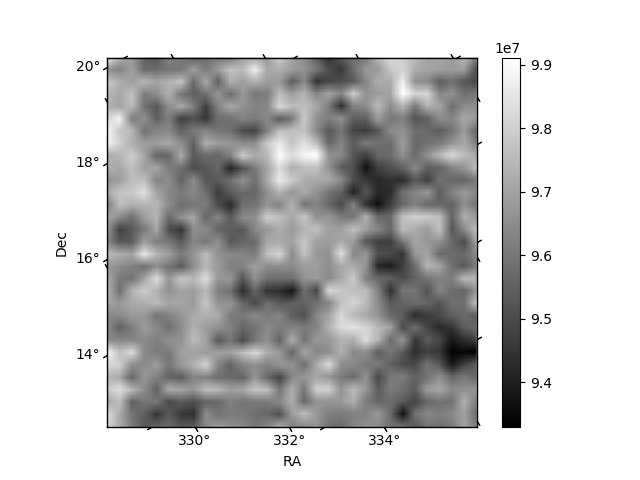 |
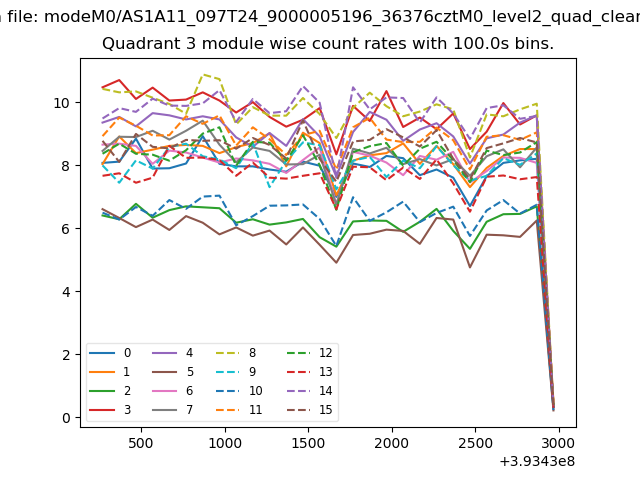
| Module-wise count rates for Quadrant C Data is divided into 100 sec bins |
 |
 |
| Module-wise count rates for Quadrant D Data is divided into 100 sec bins |
 |
 |
| Parameter | Plot |
|---|---|
| CZT HV Monitor | 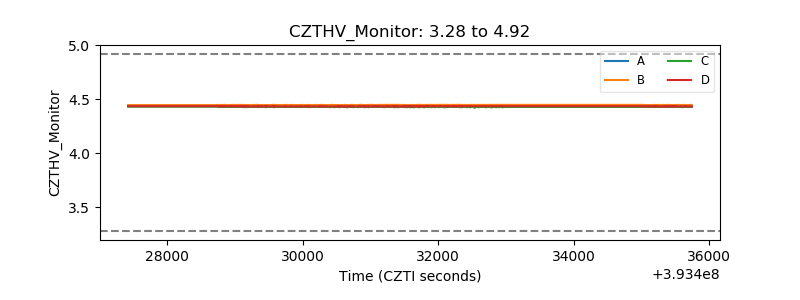 |
| D_VDD | 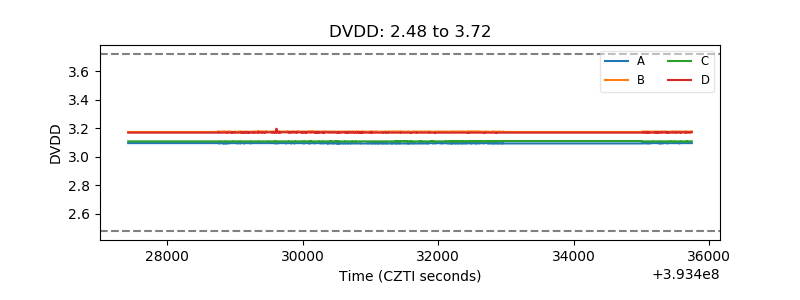 |
| Temperature 1 | 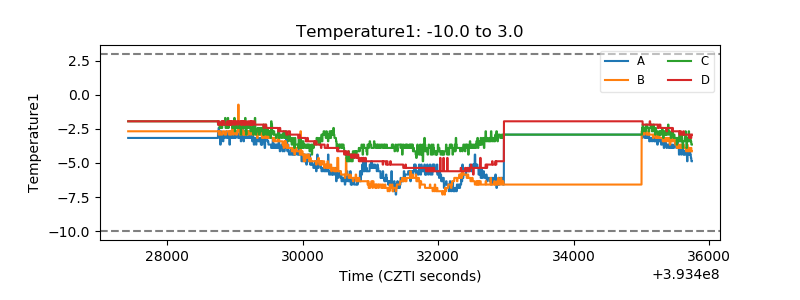 |
| Veto HV Monitor | 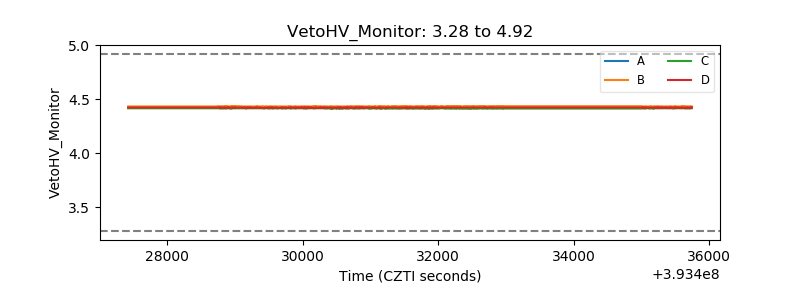 |
| Veto LLD | 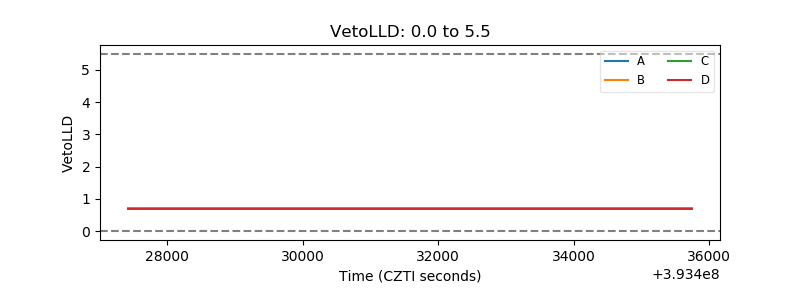 |
| Alpha Counter | 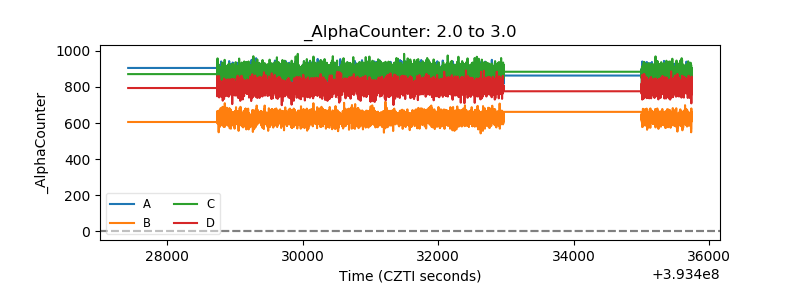 |
| _CPM_Rate | 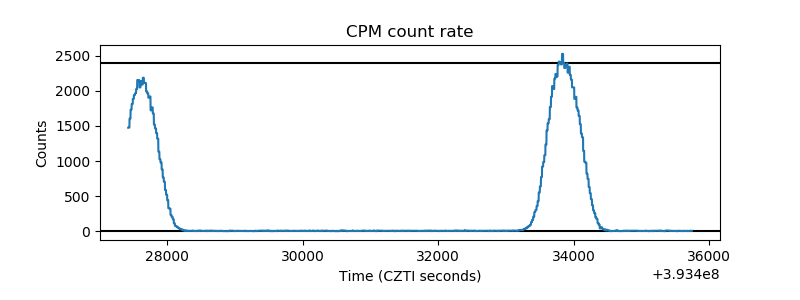 |
| CZT Counter | 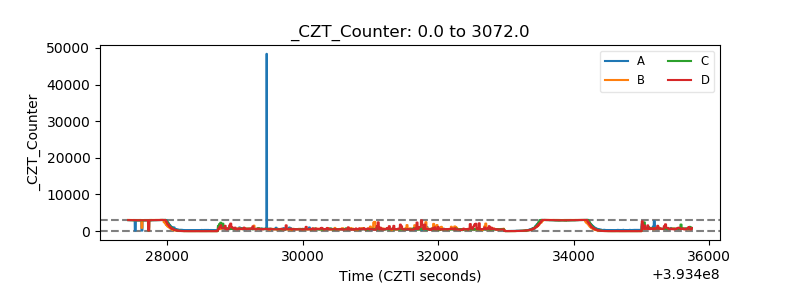 |
| +2.5 Volts monitor | 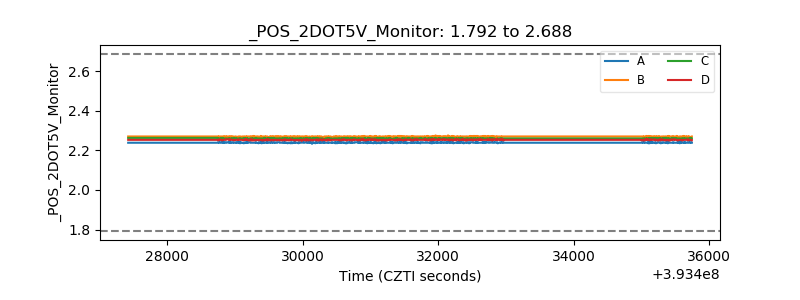 |
| +5 Volts monitor | 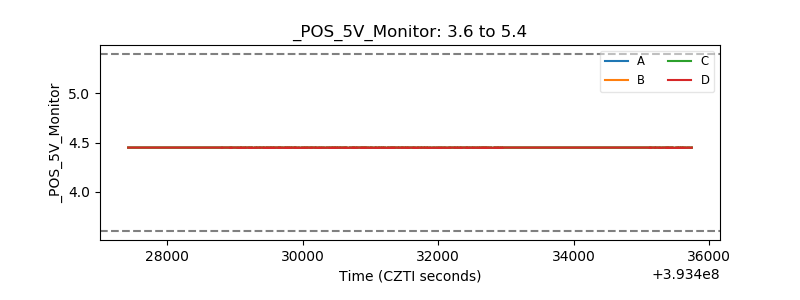 |
| _ROLL_ROT | 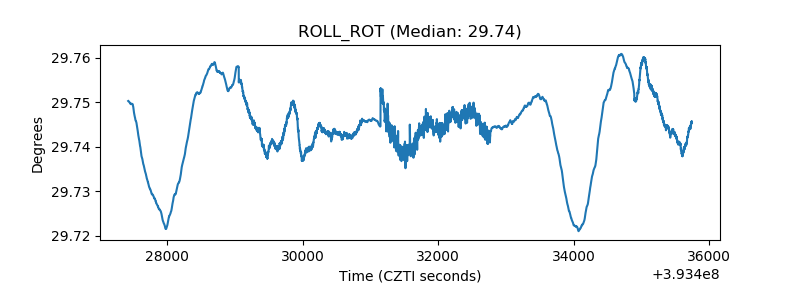 |
| _Roll_DEC | 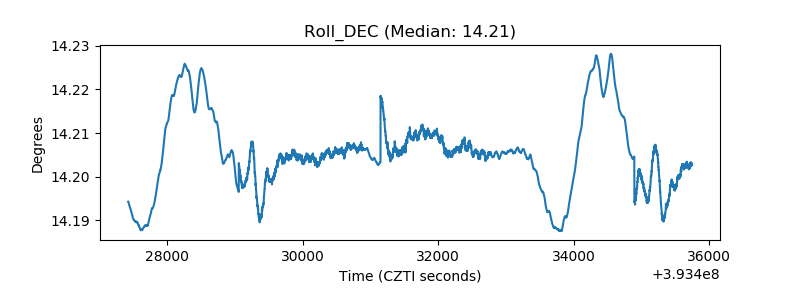 |
| _Roll_RA | 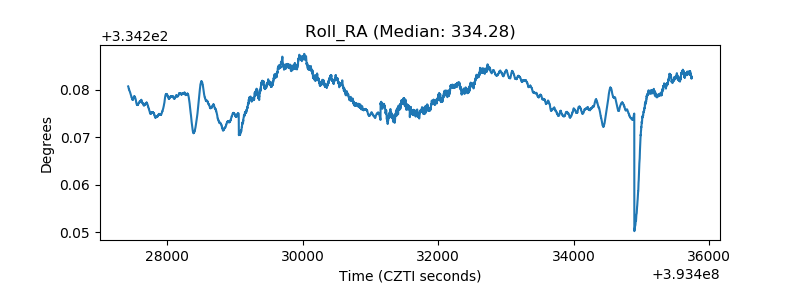 |
| Veto Counter | 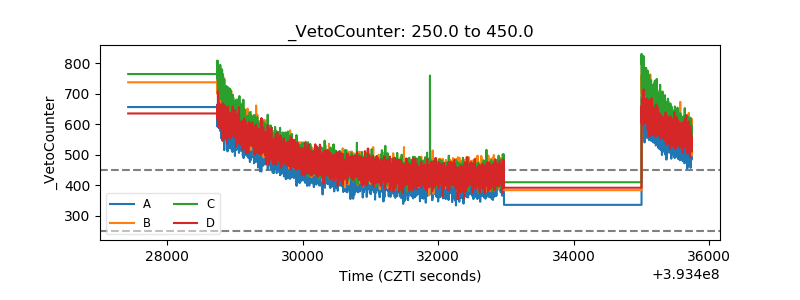 |