| Param | Original file | Final file |
|---|---|---|
| Filename | modeM0/AS1A11_097T24_9000005196_36375cztM0_level2.evt | modeM0/AS1A11_097T24_9000005196_36375cztM0_level2_quad_clean.evt |
| Size (bytes) | 527,287,680 | 52,306,560 |
| Size | 502.9 MB | 49.9 MB |
| Events in quadrant A | 2,968,467 | 332,024 |
| Events in quadrant B | 5,677,059 | 268,238 |
| Events in quadrant C | 3,042,508 | 313,955 |
| Events in quadrant D | 3,922,222 | 298,258 |
| Mode SS | |||
|---|---|---|---|
| Quadrant | BADHDUFLAG | Total packets | Discarded packets |
| A | 0 | 106 | 0 |
| B | 0 | 106 | 0 |
| C | 0 | 106 | 0 |
| D | 0 | 106 | 0 |
| Mode M9 | |||
|---|---|---|---|
| Quadrant | BADHDUFLAG | Total packets | Discarded packets |
| A | 0 | 31 | 0 |
| B | 0 | 31 | 0 |
| C | 0 | 31 | 0 |
| D | 0 | 32 | 0 |
| Mode M0 | |||
|---|---|---|---|
| Quadrant | BADHDUFLAG | Total packets | Discarded packets |
| A | 0 | 12072 | 3 |
| B | 0 | 20350 | 2 |
| C | 0 | 12032 | 2 |
| D | 0 | 15130 | 2 |
| Quadrant | Total seconds | Saturated seconds | Saturation percentage |
|---|---|---|---|
| A | 5298 | 38 | 0.717252% |
| B | 5298 | 1216 | 22.952057% |
| C | 5298 | 70 | 1.321253% |
| D | 5298 | 247 | 4.662137% |
Noise dominated data is calculated using 1-second bins in cleaned event files. If a bin has >2000 counts, and if more than 50% of those come from <1% of pixels, then it is considered to be noise-dominated and hence unusable.
| Quadrant | # 1 sec bins | Bins with >0 counts | Bins with >2000 counts | High rate bins dominated by noise | Noise dominated (total time) | Noise dominated (detector-on time) | Marked lightcurve |
|---|---|---|---|---|---|---|---|
| A | 7241 | 5299 | 31 | 31 | 0.43% | 0.59% | 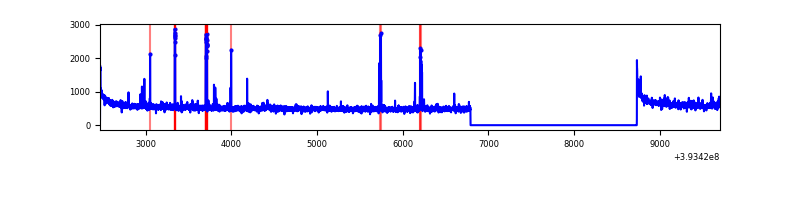 |
| B | 7240 | 5298 | 1072 | 1072 | 14.81% | 20.23% | 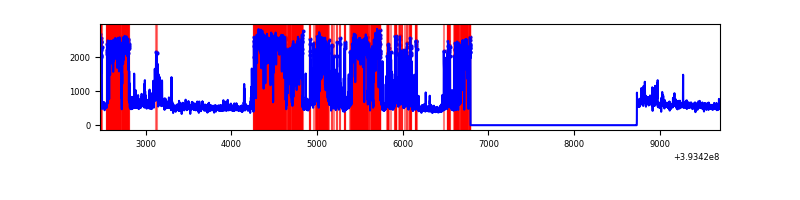 |
| C | 7240 | 5298 | 61 | 61 | 0.84% | 1.15% | 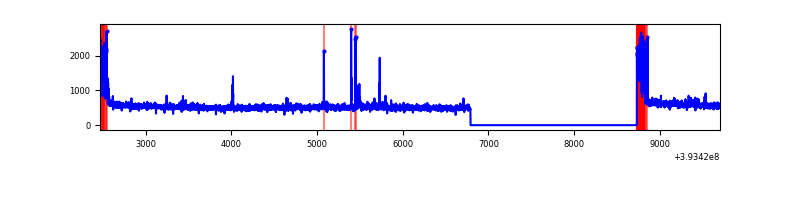 |
| D | 7240 | 5298 | 223 | 223 | 3.08% | 4.21% | 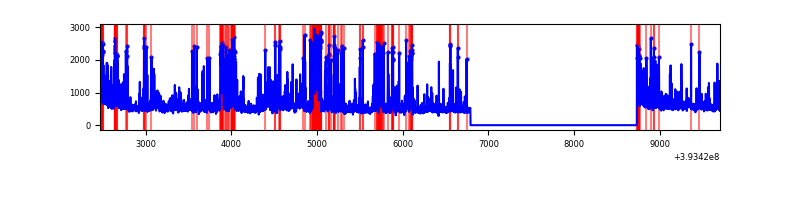 |
Top three noisy pixels from each quadrant. If the there are fewer than three noisy pixels in the level2.evt file, extra rows are filled as -1
| Pixel properties | Quadrant properties | ||||||
|---|---|---|---|---|---|---|---|
| Quadrant | DetID | PixID | Counts | Sigma | Mean | Median | Sigma |
| A | 10 | 83 | 184421 | 1358.89 | 678 | 668 | 135.2 |
| A | 9 | 143 | 92069 | 675.92 | 678 | 668 | 135.2 |
| A | 15 | 223 | 66385 | 485.99 | 678 | 668 | 135.2 |
| B | 5 | 172 | 2894714 | 25585.26 | 598 | 585 | 113.1 |
| B | 5 | 255 | 238697 | 2105.01 | 598 | 585 | 113.1 |
| B | 0 | 189 | 105355 | 926.21 | 598 | 585 | 113.1 |
| C | 0 | 10 | 236987 | 1575.3 | 648 | 654 | 150.0 |
| C | 15 | 214 | 227610 | 1512.79 | 648 | 654 | 150.0 |
| C | 4 | 254 | 41975 | 275.43 | 648 | 654 | 150.0 |
| D | 2 | 250 | 514178 | 3284.3 | 646 | 630 | 156.4 |
| D | 10 | 118 | 224472 | 1431.54 | 646 | 630 | 156.4 |
| D | 12 | 6 | 213698 | 1362.64 | 646 | 630 | 156.4 |
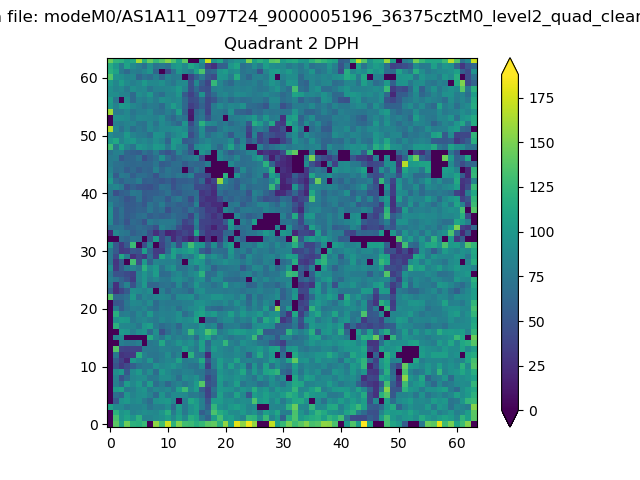
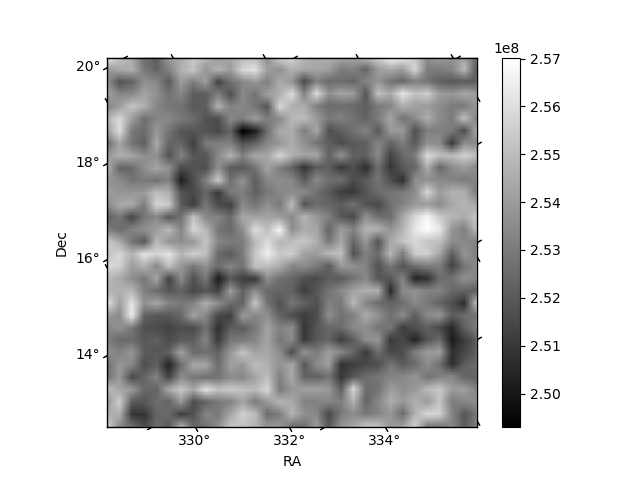
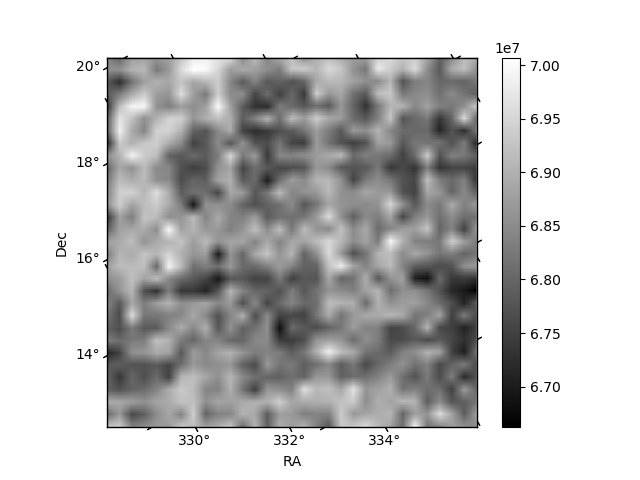
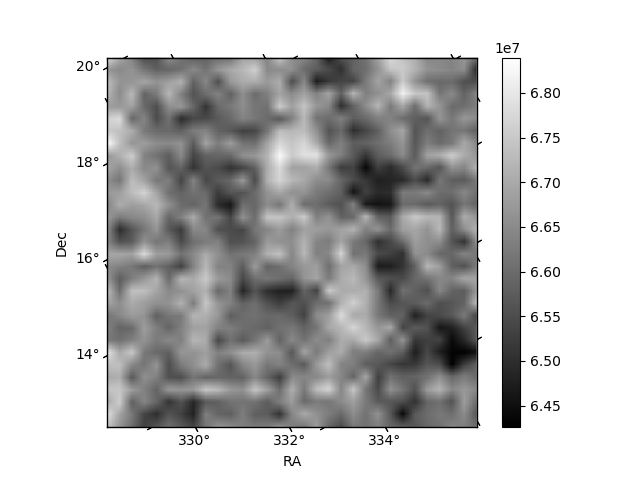
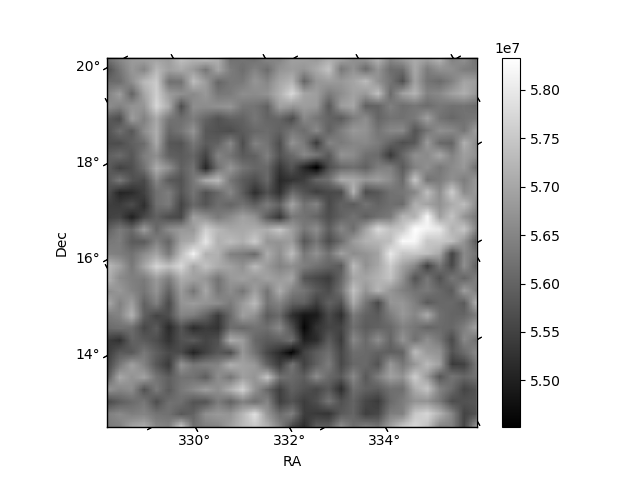
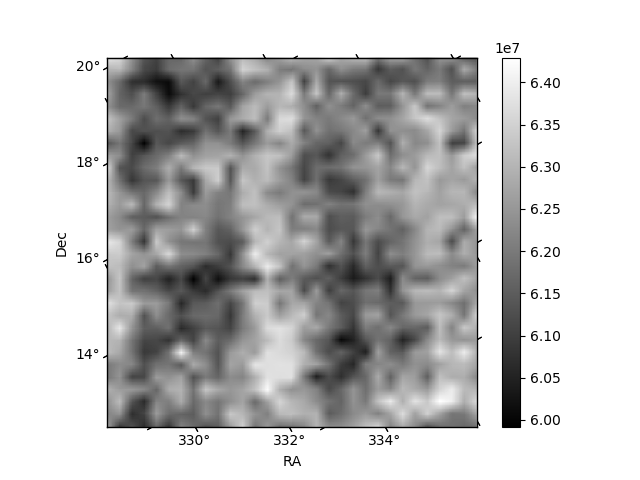
Histogram calculated using DETX and DETY for each event in the final _common_clean file
| Quadrant A | 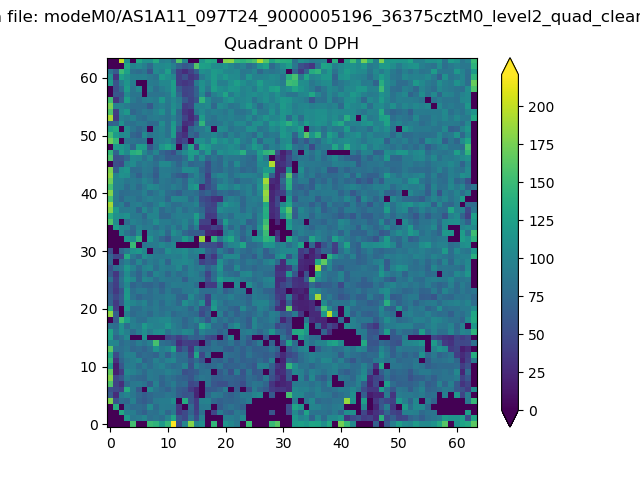 |
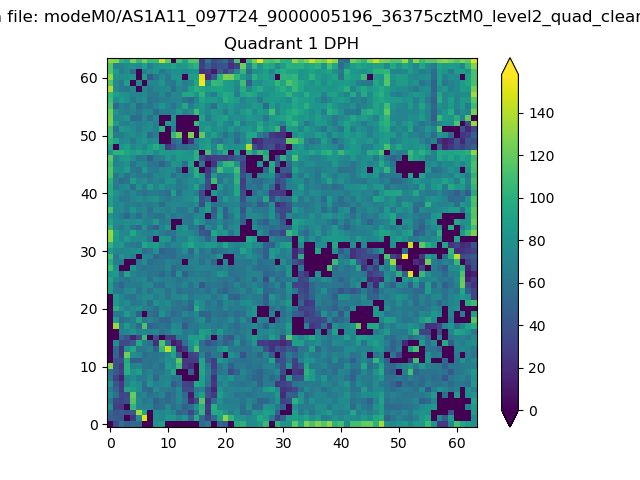 |
Quadrant B |
|---|---|---|---|
| Quadrant D | 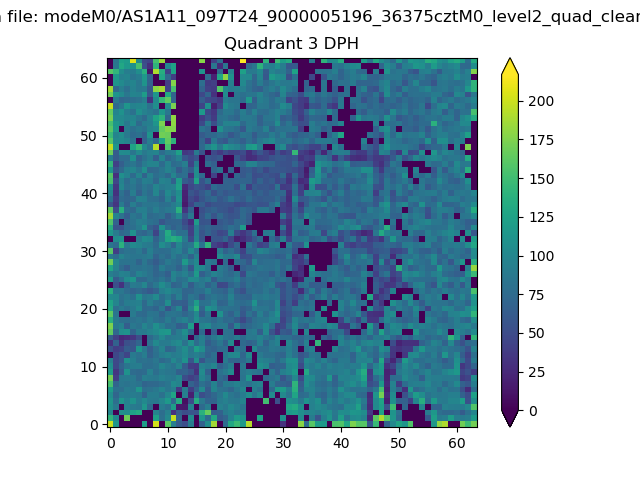 |
 |
Quadrant C |
| Plot type | Count rate plots | Images |
|---|---|---|
| Comparison with Poisson distribution Blue bars denote a histogram of data divided into 1 sec bins. Red curve is a Poisson curve with rate = median count rate of data. |
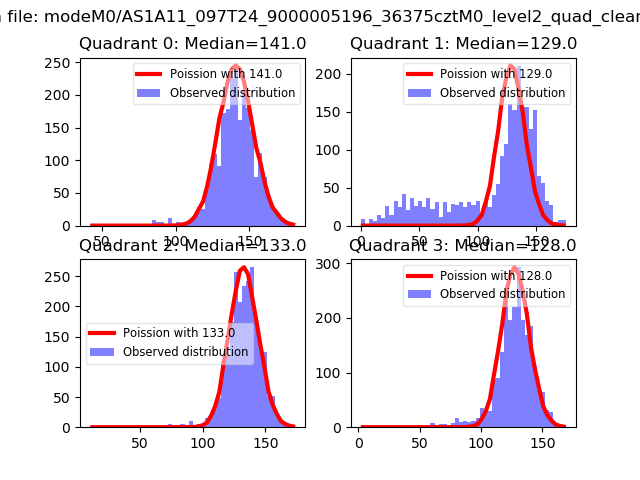 |
 |
| Quadrant-wise count rates Data is divided into 100 sec bins |
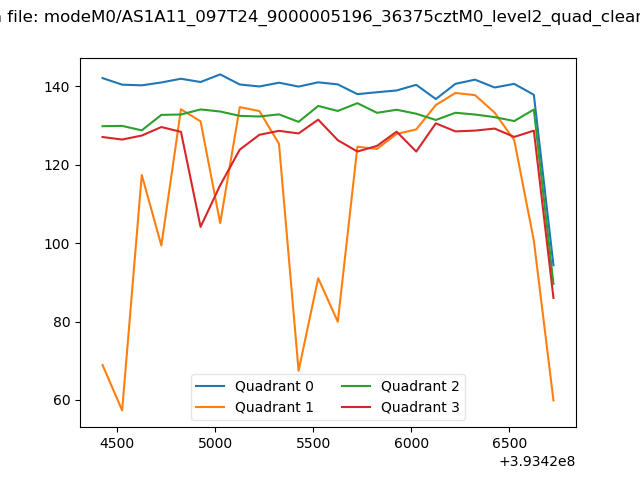 |
|
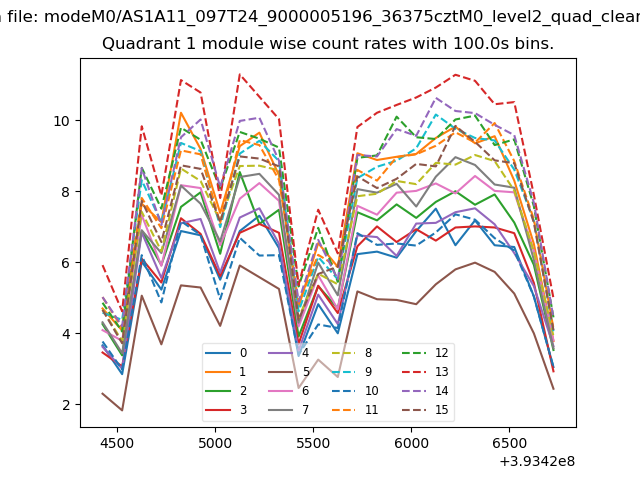
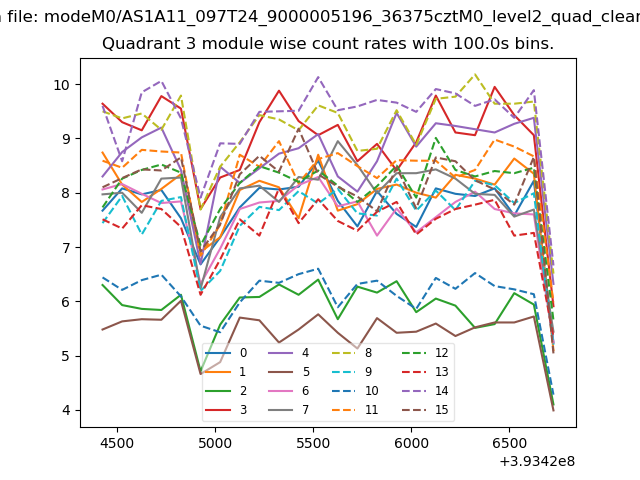
| Module-wise count rates for Quadrant A Data is divided into 100 sec bins |
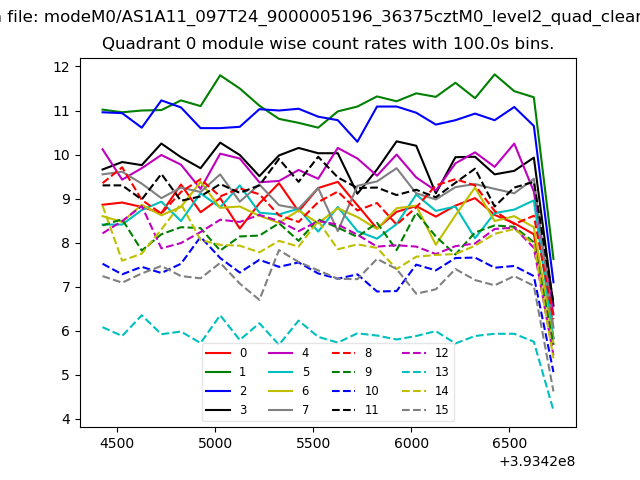 |
 |
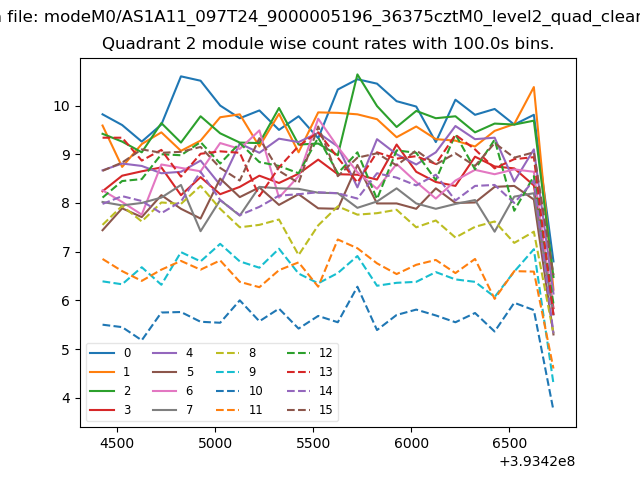
| Module-wise count rates for Quadrant B Data is divided into 100 sec bins |
 |
 |
| Module-wise count rates for Quadrant C Data is divided into 100 sec bins |
 |
 |
| Module-wise count rates for Quadrant D Data is divided into 100 sec bins |
 |
 |
| Parameter | Plot |
|---|---|
| CZT HV Monitor | 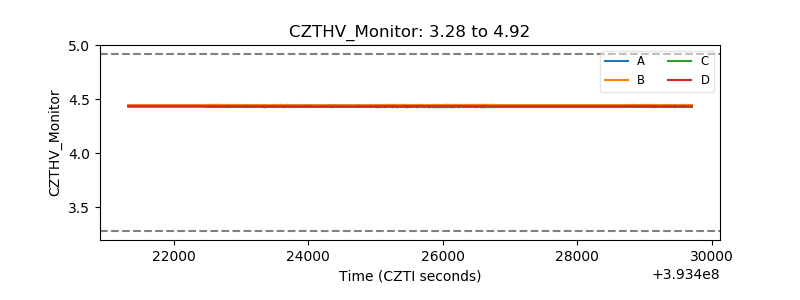 |
| D_VDD | 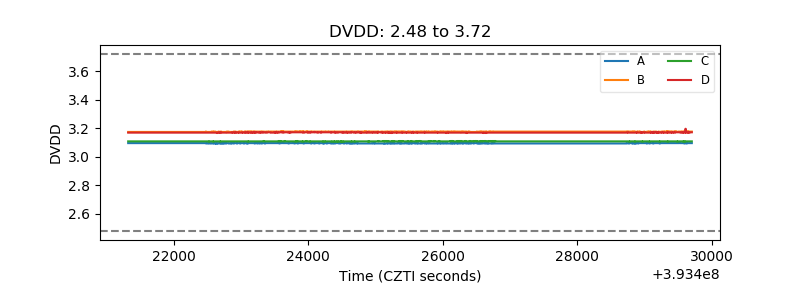 |
| Temperature 1 | 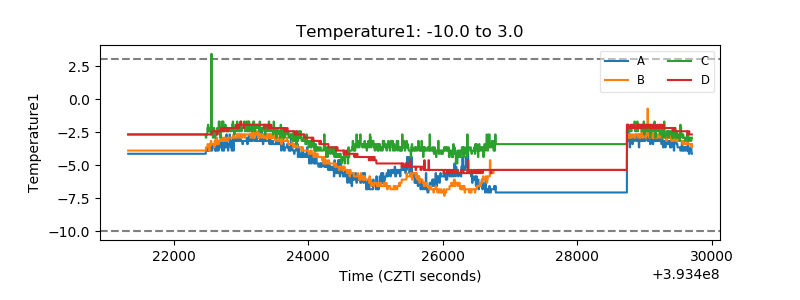 |
| Veto HV Monitor | 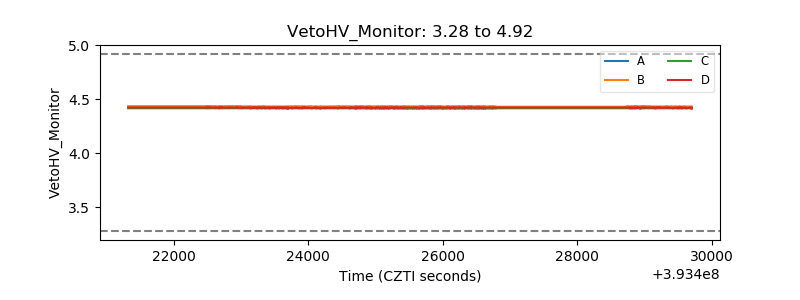 |
| Veto LLD | 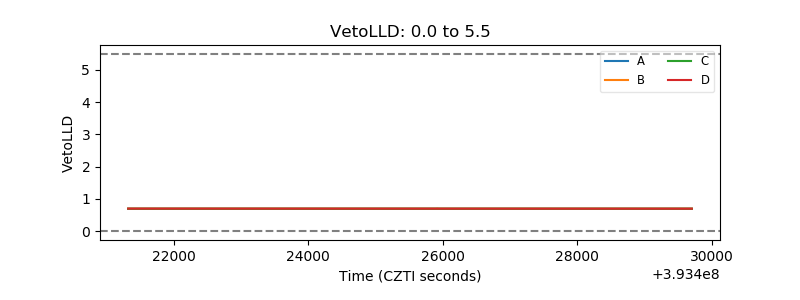 |
| Alpha Counter | 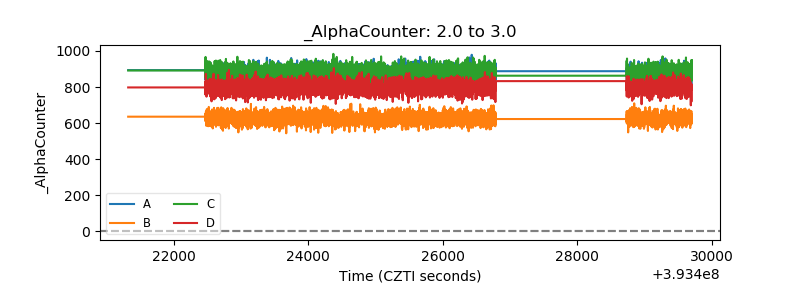 |
| _CPM_Rate | 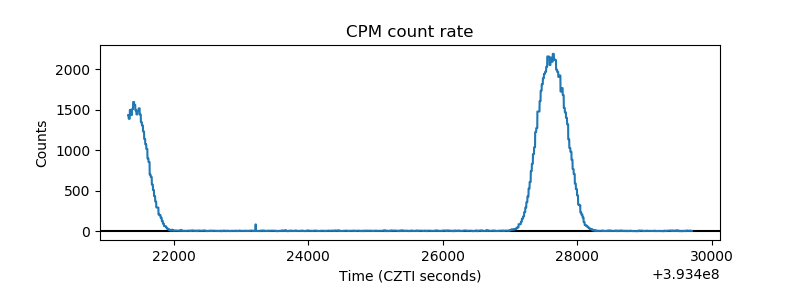 |
| CZT Counter | 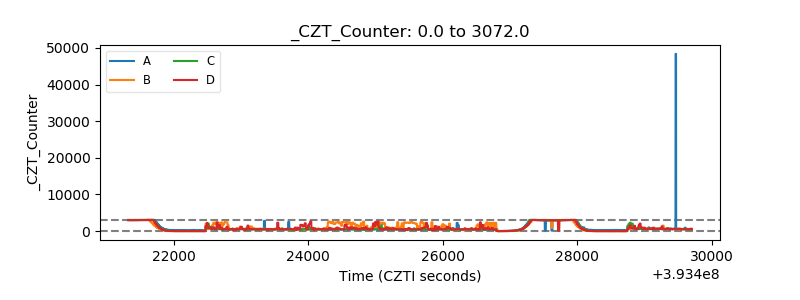 |
| +2.5 Volts monitor | 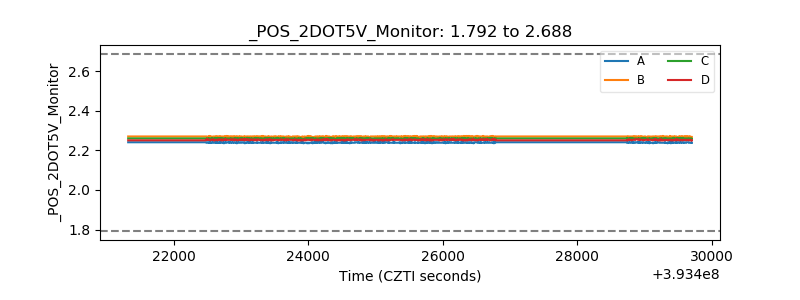 |
| +5 Volts monitor | 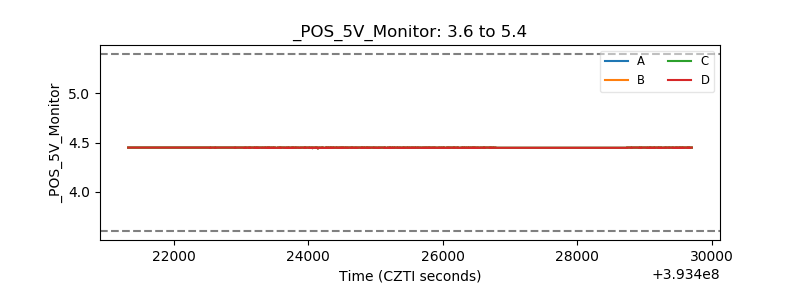 |
| _ROLL_ROT | 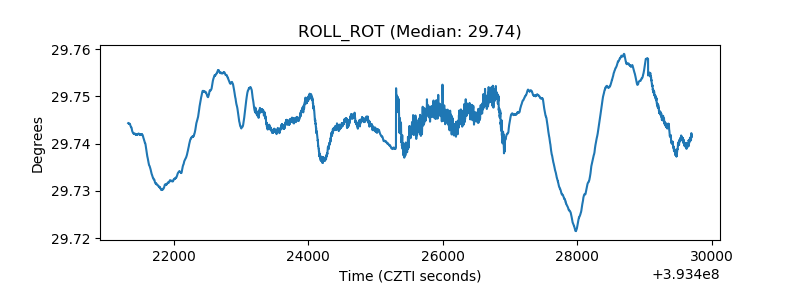 |
| _Roll_DEC | 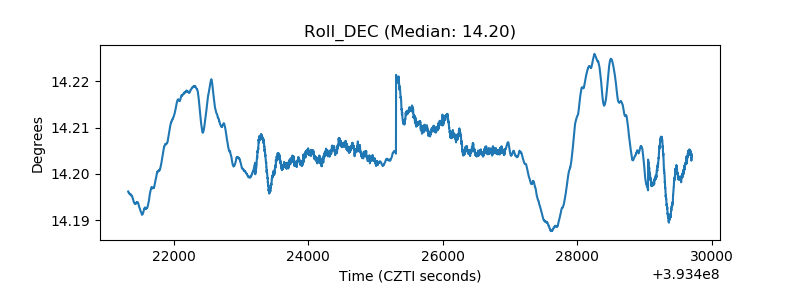 |
| _Roll_RA | 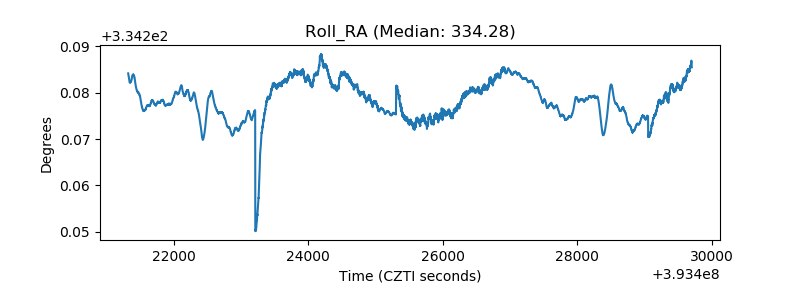 |
| Veto Counter | 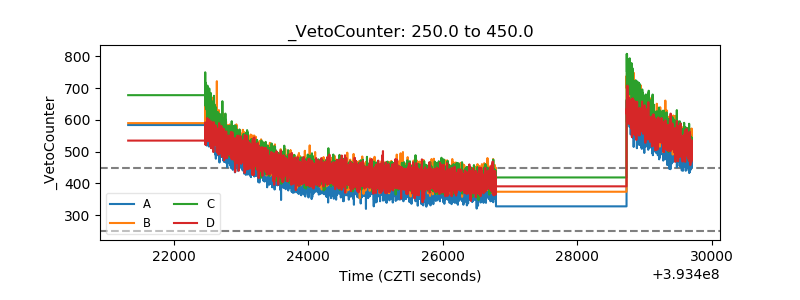 |