| Param | Original file | Final file |
|---|---|---|
| Filename | modeM0/AS1A11_097T24_9000005196_36374cztM0_level2.evt | modeM0/AS1A11_097T24_9000005196_36374cztM0_level2_quad_clean.evt |
| Size (bytes) | 530,167,680 | 49,098,240 |
| Size | 505.6 MB | 46.8 MB |
| Events in quadrant A | 2,845,916 | 296,281 |
| Events in quadrant B | 5,886,719 | 256,386 |
| Events in quadrant C | 2,903,316 | 281,072 |
| Events in quadrant D | 4,049,928 | 270,104 |
| Mode SS | |||
|---|---|---|---|
| Quadrant | BADHDUFLAG | Total packets | Discarded packets |
| A | 0 | 112 | 0 |
| B | 0 | 112 | 0 |
| C | 0 | 112 | 0 |
| D | 0 | 112 | 0 |
| Mode M9 | |||
|---|---|---|---|
| Quadrant | BADHDUFLAG | Total packets | Discarded packets |
| A | 0 | 28 | 0 |
| B | 0 | 28 | 0 |
| C | 0 | 28 | 0 |
| D | 0 | 29 | 0 |
| Mode M0 | |||
|---|---|---|---|
| Quadrant | BADHDUFLAG | Total packets | Discarded packets |
| A | 0 | 11752 | 3 |
| B | 0 | 21109 | 2 |
| C | 0 | 11685 | 2 |
| D | 0 | 15616 | 2 |
| Quadrant | Total seconds | Saturated seconds | Saturation percentage |
|---|---|---|---|
| A | 5457 | 17 | 0.311526% |
| B | 5457 | 1238 | 22.686458% |
| C | 5457 | 46 | 0.842954% |
| D | 5457 | 246 | 4.507971% |
Noise dominated data is calculated using 1-second bins in cleaned event files. If a bin has >2000 counts, and if more than 50% of those come from <1% of pixels, then it is considered to be noise-dominated and hence unusable.
| Quadrant | # 1 sec bins | Bins with >0 counts | Bins with >2000 counts | High rate bins dominated by noise | Noise dominated (total time) | Noise dominated (detector-on time) | Marked lightcurve |
|---|---|---|---|---|---|---|---|
| A | 7251 | 5458 | 14 | 14 | 0.19% | 0.26% | 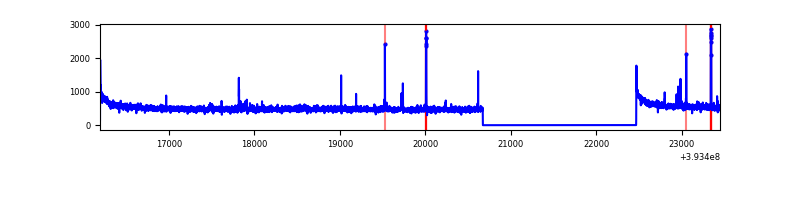 |
| B | 7250 | 5456 | 1012 | 1012 | 13.96% | 18.55% | 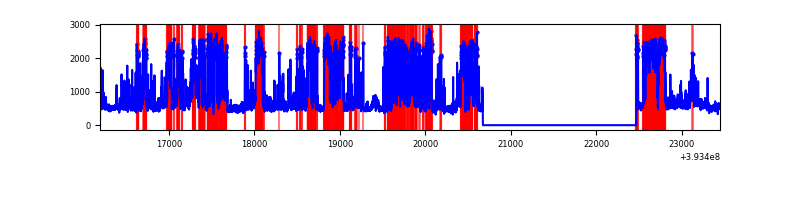 |
| C | 7250 | 5456 | 30 | 30 | 0.41% | 0.55% | 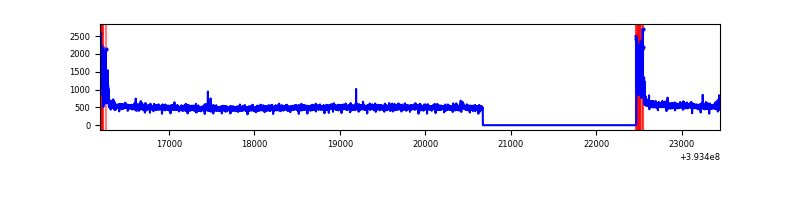 |
| D | 7250 | 5456 | 226 | 226 | 3.12% | 4.14% | 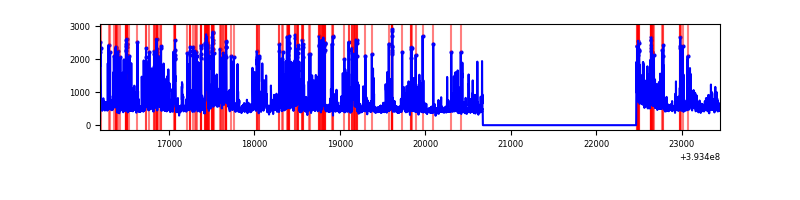 |
Top three noisy pixels from each quadrant. If the there are fewer than three noisy pixels in the level2.evt file, extra rows are filled as -1
| Pixel properties | Quadrant properties | ||||||
|---|---|---|---|---|---|---|---|
| Quadrant | DetID | PixID | Counts | Sigma | Mean | Median | Sigma |
| A | 10 | 83 | 186902 | 1399.84 | 666 | 656 | 133.0 |
| A | 9 | 143 | 58582 | 435.38 | 666 | 656 | 133.0 |
| A | 15 | 223 | 11566 | 82.0 | 666 | 656 | 133.0 |
| B | 5 | 172 | 3201478 | 28280.14 | 591 | 577 | 113.2 |
| B | 0 | 189 | 115570 | 1015.97 | 591 | 577 | 113.2 |
| B | 4 | 232 | 99435 | 873.42 | 591 | 577 | 113.2 |
| C | 15 | 214 | 233891 | 1578.14 | 636 | 643 | 147.8 |
| C | 0 | 10 | 183466 | 1236.97 | 636 | 643 | 147.8 |
| C | 4 | 254 | 8541 | 53.44 | 636 | 643 | 147.8 |
| D | 12 | 6 | 484292 | 3115.8 | 632 | 616 | 155.2 |
| D | 2 | 249 | 334079 | 2148.14 | 632 | 616 | 155.2 |
| D | 2 | 250 | 285897 | 1837.76 | 632 | 616 | 155.2 |
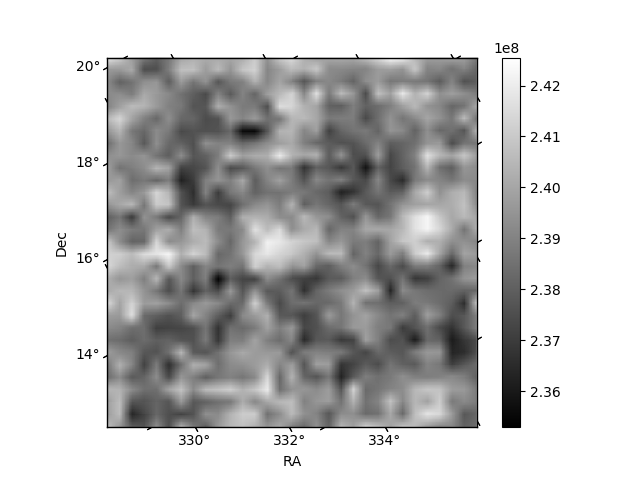
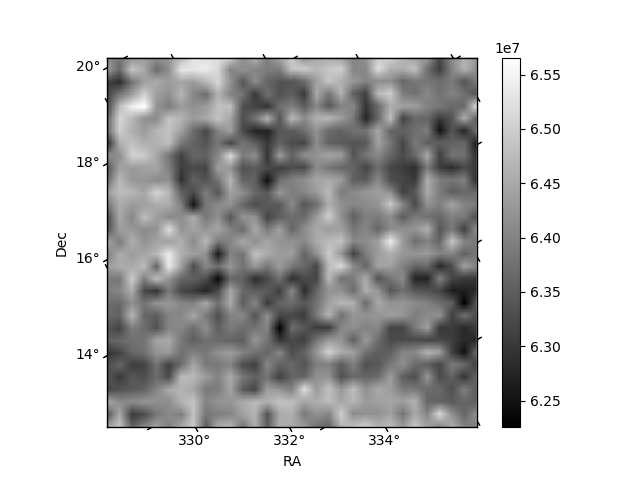
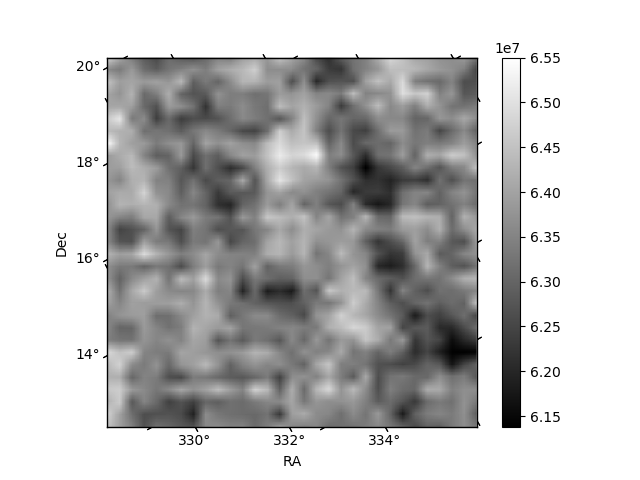
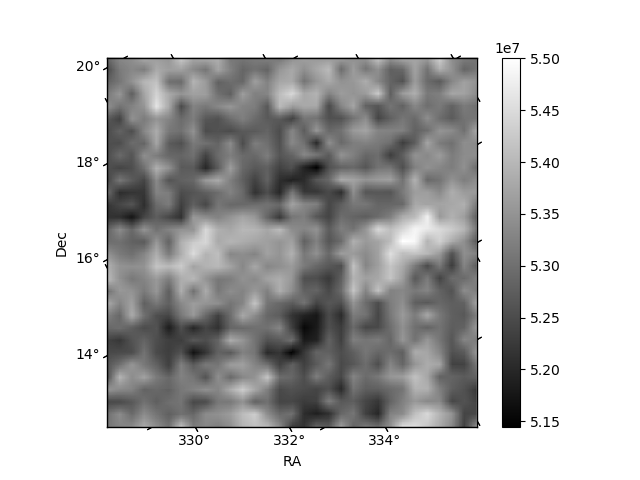
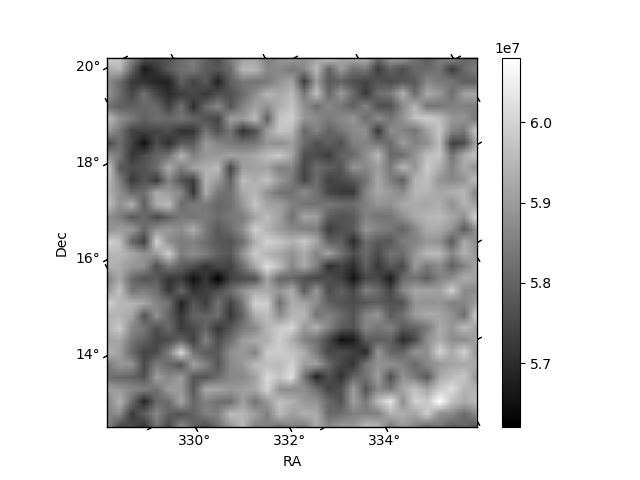
Histogram calculated using DETX and DETY for each event in the final _common_clean file
| Quadrant A | 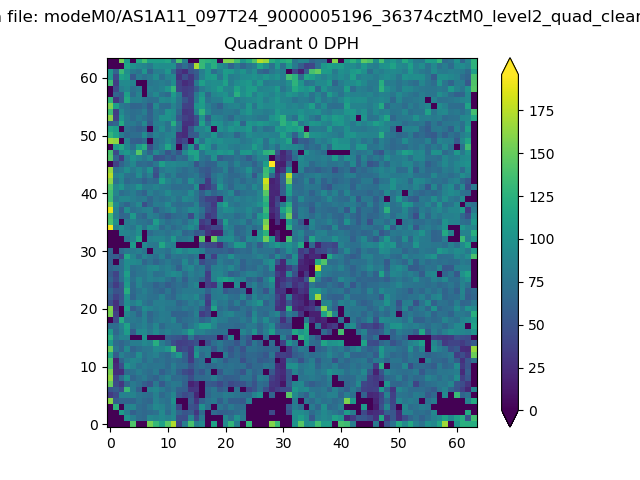 |
 |
Quadrant B |
|---|---|---|---|
| Quadrant D | 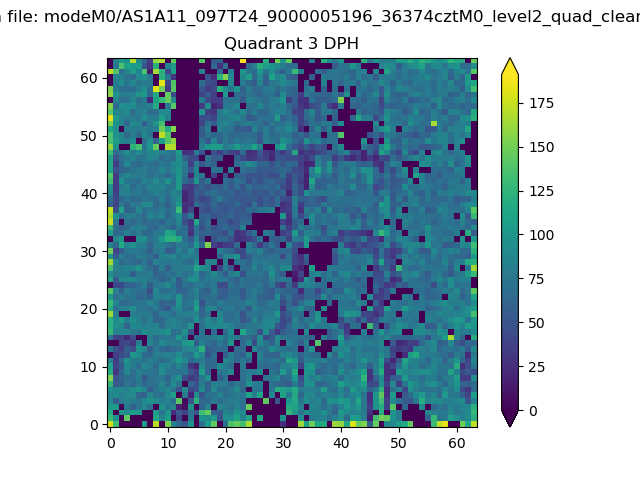 |
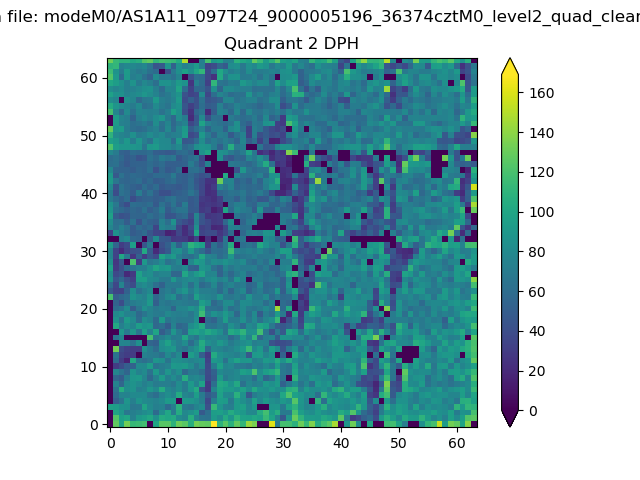 |
Quadrant C |
| Plot type | Count rate plots | Images |
|---|---|---|
| Comparison with Poisson distribution Blue bars denote a histogram of data divided into 1 sec bins. Red curve is a Poisson curve with rate = median count rate of data. |
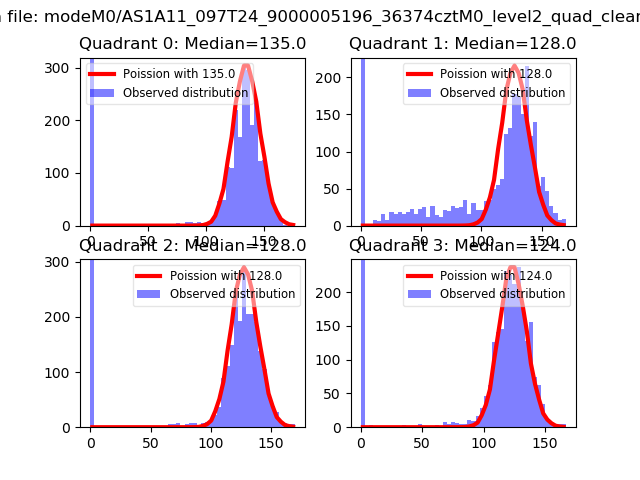 |
 |
| Quadrant-wise count rates Data is divided into 100 sec bins |
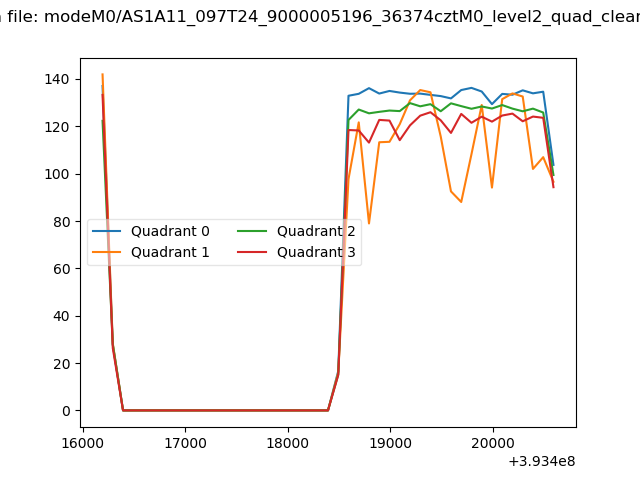 |
|
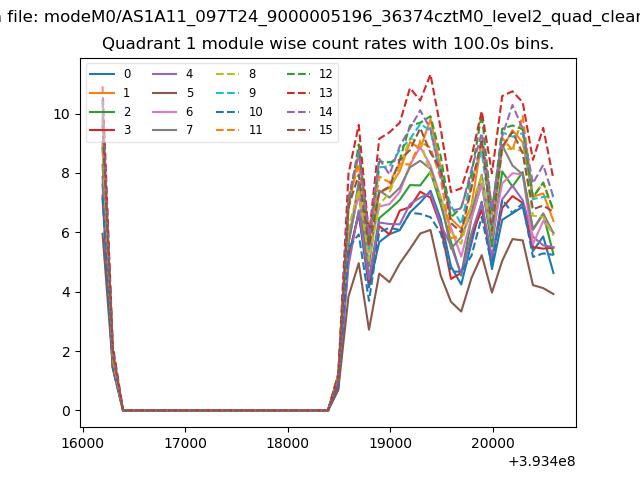
| Module-wise count rates for Quadrant A Data is divided into 100 sec bins |
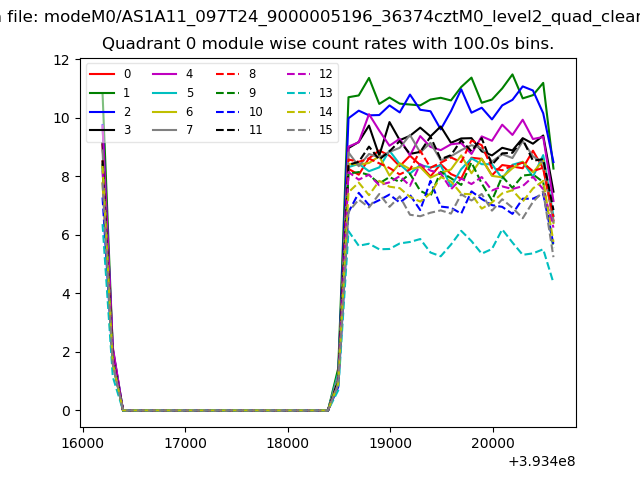 |
 |
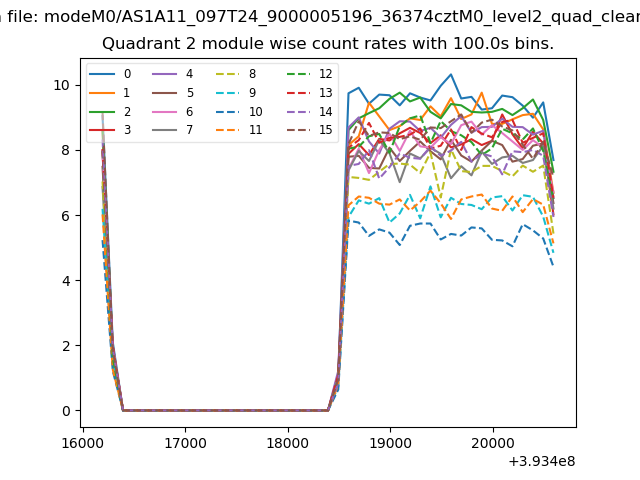
| Module-wise count rates for Quadrant B Data is divided into 100 sec bins |
 |
 |
| Module-wise count rates for Quadrant C Data is divided into 100 sec bins |
 |
 |
| Module-wise count rates for Quadrant D Data is divided into 100 sec bins |
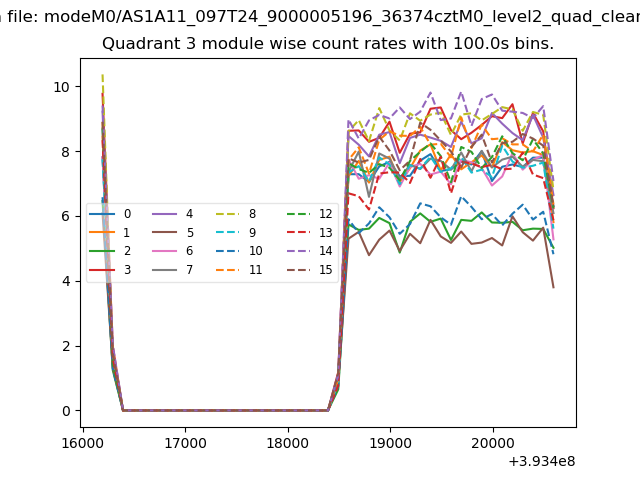 |
 |
| Parameter | Plot |
|---|---|
| CZT HV Monitor | 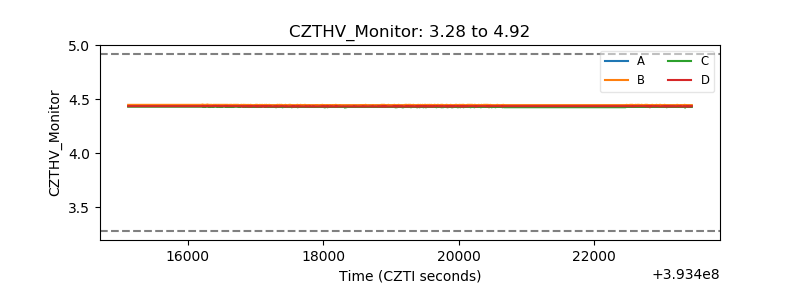 |
| D_VDD | 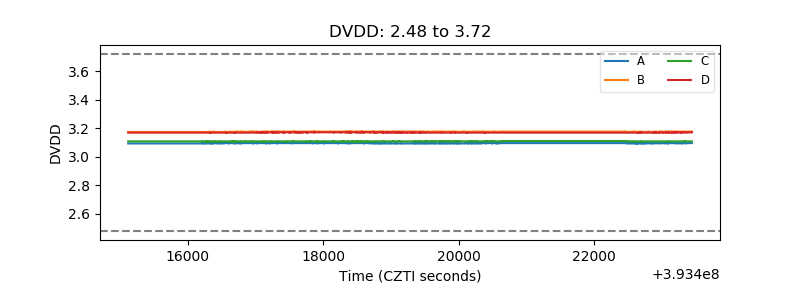 |
| Temperature 1 | 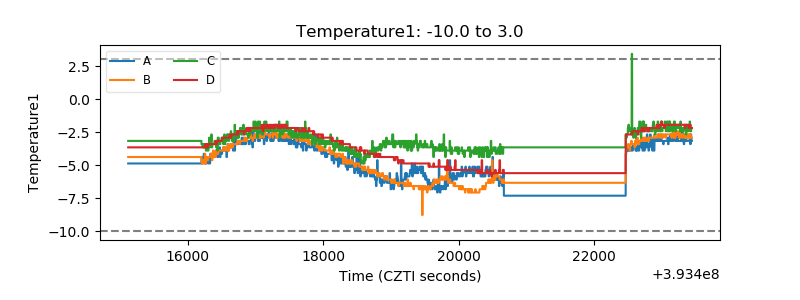 |
| Veto HV Monitor |  |
| Veto LLD | 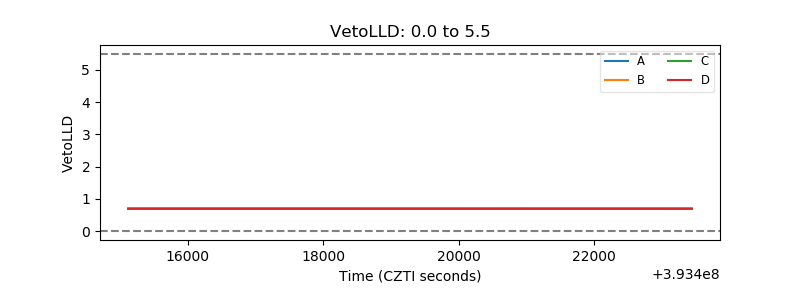 |
| Alpha Counter | 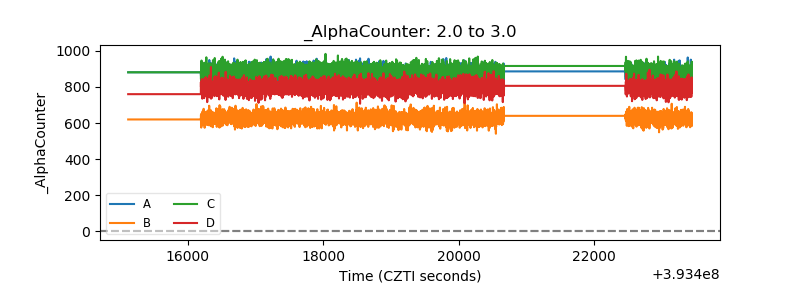 |
| _CPM_Rate | 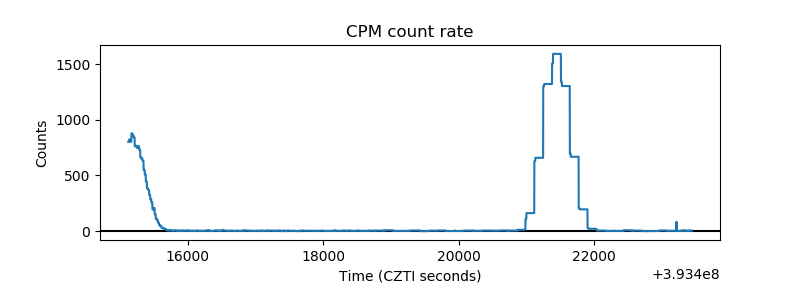 |
| CZT Counter |  |
| +2.5 Volts monitor | 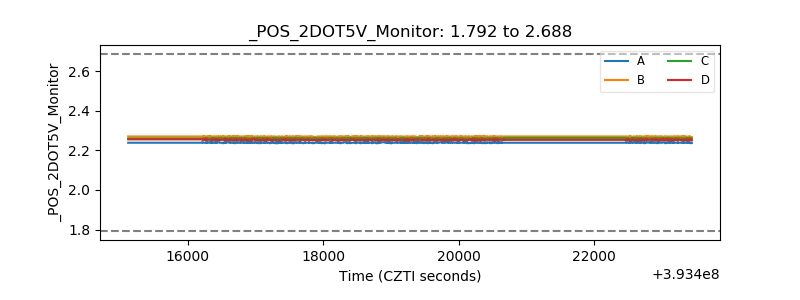 |
| +5 Volts monitor | 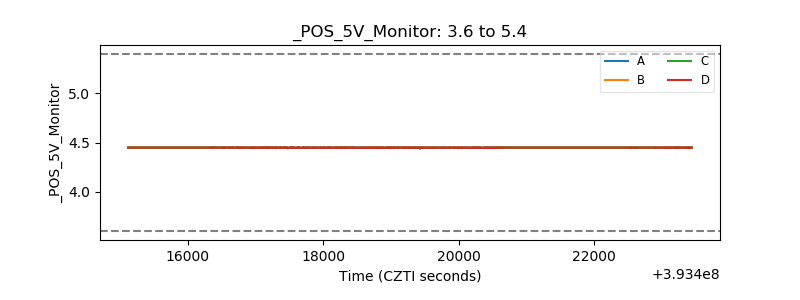 |
| _ROLL_ROT | 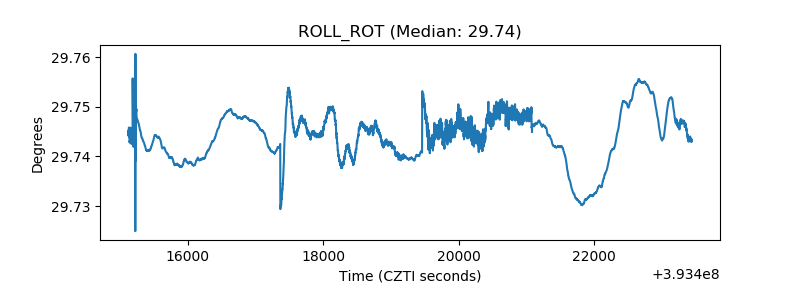 |
| _Roll_DEC | 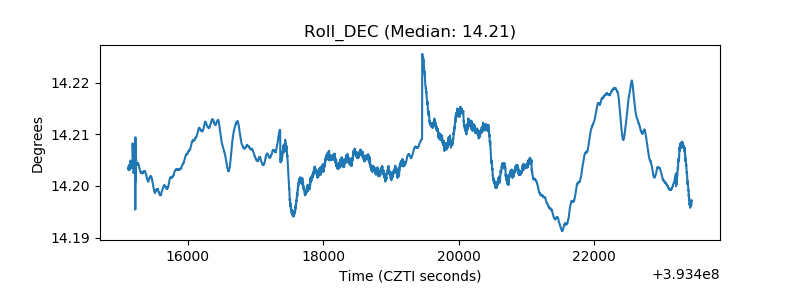 |
| _Roll_RA | 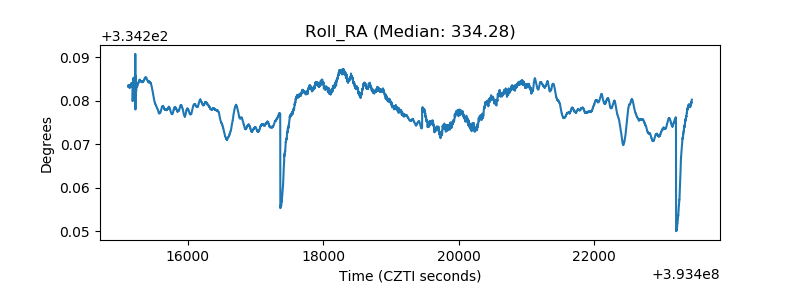 |
| Veto Counter | 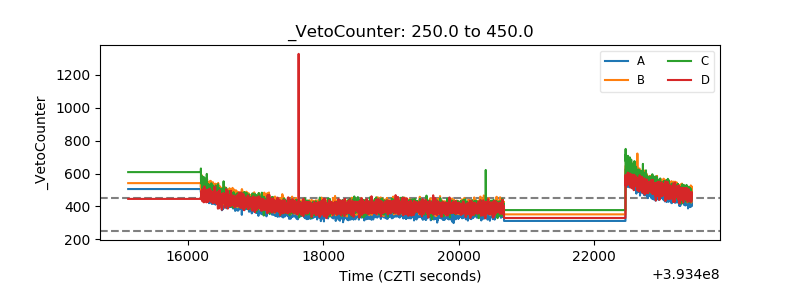 |