| Param | Original file | Final file |
|---|---|---|
| Filename | modeM0/AS1A11_097T24_9000005196_36365cztM0_level2.evt | modeM0/AS1A11_097T24_9000005196_36365cztM0_level2_quad_clean.evt |
| Size (bytes) | 223,531,200 | 36,400,320 |
| Size | 213.2 MB | 34.7 MB |
| Events in quadrant A | 1,408,957 | 235,068 |
| Events in quadrant B | 2,009,087 | 234,464 |
| Events in quadrant C | 1,483,557 | 225,580 |
| Events in quadrant D | 1,685,588 | 216,428 |
| Mode SS | |||
|---|---|---|---|
| Quadrant | BADHDUFLAG | Total packets | Discarded packets |
| A | 0 | 54 | 0 |
| B | 0 | 54 | 0 |
| C | 0 | 54 | 0 |
| D | 0 | 54 | 0 |
| Mode M9 | |||
|---|---|---|---|
| Quadrant | BADHDUFLAG | Total packets | Discarded packets |
| A | 0 | 20 | 0 |
| B | 0 | 20 | 0 |
| C | 0 | 20 | 0 |
| D | 0 | 20 | 0 |
| Mode M0 | |||
|---|---|---|---|
| Quadrant | BADHDUFLAG | Total packets | Discarded packets |
| A | 0 | 5814 | 2 |
| B | 0 | 7758 | 1 |
| C | 0 | 5959 | 1 |
| D | 0 | 6826 | 1 |
| Quadrant | Total seconds | Saturated seconds | Saturation percentage |
|---|---|---|---|
| A | 2661 | 6 | 0.225479% |
| B | 2661 | 336 | 12.626832% |
| C | 2661 | 67 | 2.517850% |
| D | 2661 | 70 | 2.630590% |
Noise dominated data is calculated using 1-second bins in cleaned event files. If a bin has >2000 counts, and if more than 50% of those come from <1% of pixels, then it is considered to be noise-dominated and hence unusable.
| Quadrant | # 1 sec bins | Bins with >0 counts | Bins with >2000 counts | High rate bins dominated by noise | Noise dominated (total time) | Noise dominated (detector-on time) | Marked lightcurve |
|---|---|---|---|---|---|---|---|
| A | 4602 | 2662 | 8 | 8 | 0.17% | 0.30% | 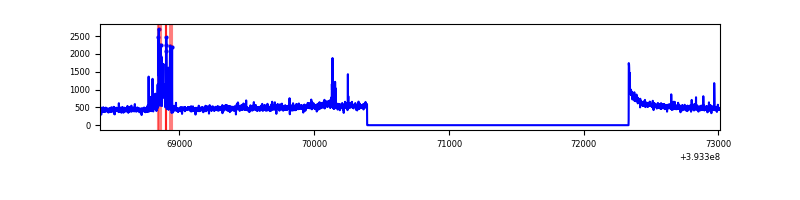 |
| B | 4601 | 2660 | 271 | 271 | 5.89% | 10.19% | 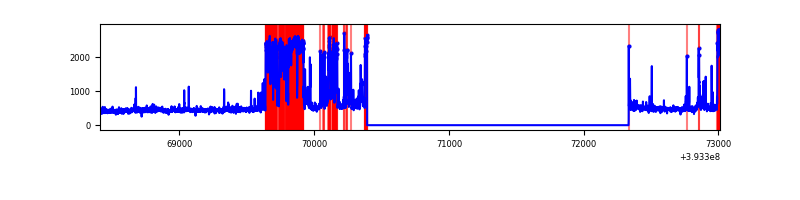 |
| C | 4602 | 2662 | 65 | 65 | 1.41% | 2.44% | 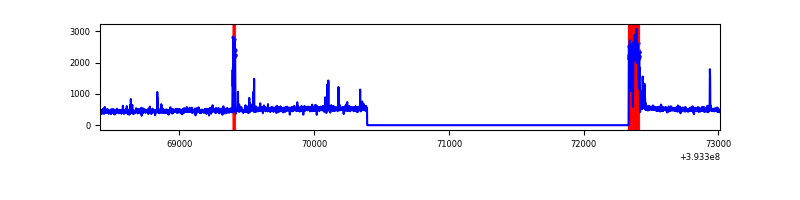 |
| D | 4602 | 2662 | 75 | 75 | 1.63% | 2.82% | 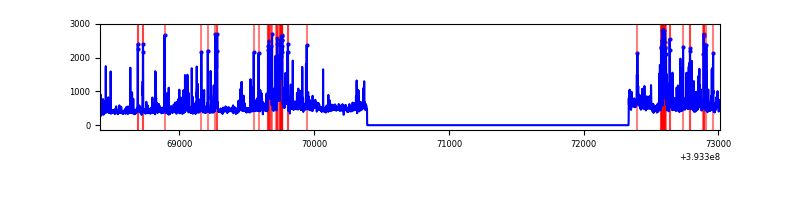 |
Top three noisy pixels from each quadrant. If the there are fewer than three noisy pixels in the level2.evt file, extra rows are filled as -1
| Pixel properties | Quadrant properties | ||||||
|---|---|---|---|---|---|---|---|
| Quadrant | DetID | PixID | Counts | Sigma | Mean | Median | Sigma |
| A | 9 | 143 | 88262 | 1365.62 | 311 | 305 | 64.4 |
| A | 10 | 83 | 87101 | 1347.59 | 311 | 305 | 64.4 |
| A | 12 | 189 | 25682 | 394.0 | 311 | 305 | 64.4 |
| B | 5 | 172 | 790028 | 13978.98 | 287 | 281 | 56.5 |
| B | 5 | 236 | 33982 | 596.53 | 287 | 281 | 56.5 |
| B | 0 | 213 | 10922 | 188.35 | 287 | 281 | 56.5 |
| C | 0 | 10 | 162314 | 2262.15 | 297 | 298 | 71.6 |
| C | 15 | 214 | 113856 | 1585.56 | 297 | 298 | 71.6 |
| C | 0 | 207 | 50018 | 694.22 | 297 | 298 | 71.6 |
| D | 12 | 6 | 374410 | 5126.41 | 298 | 291 | 73.0 |
| D | 7 | 223 | 60502 | 825.05 | 298 | 291 | 73.0 |
| D | 2 | 249 | 39984 | 543.9 | 298 | 291 | 73.0 |
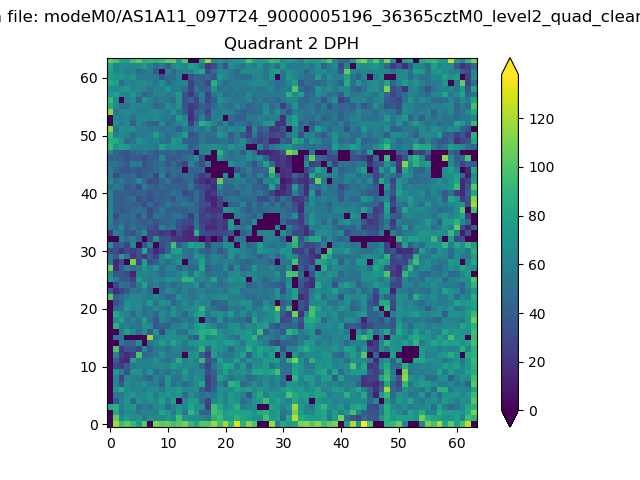
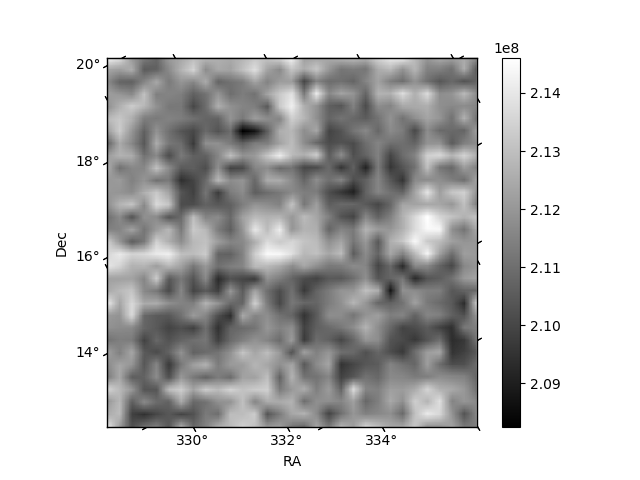
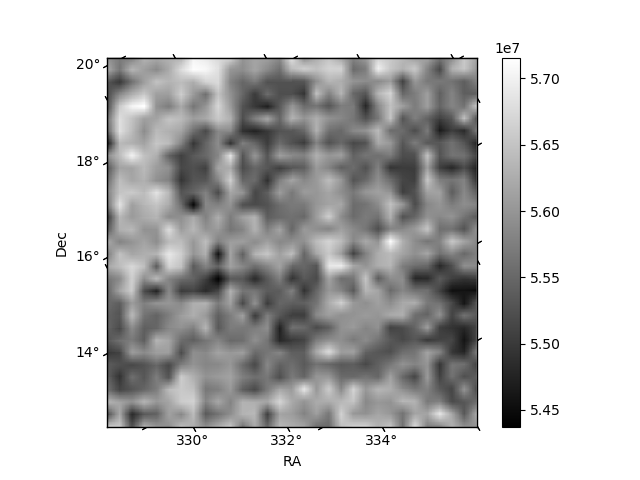
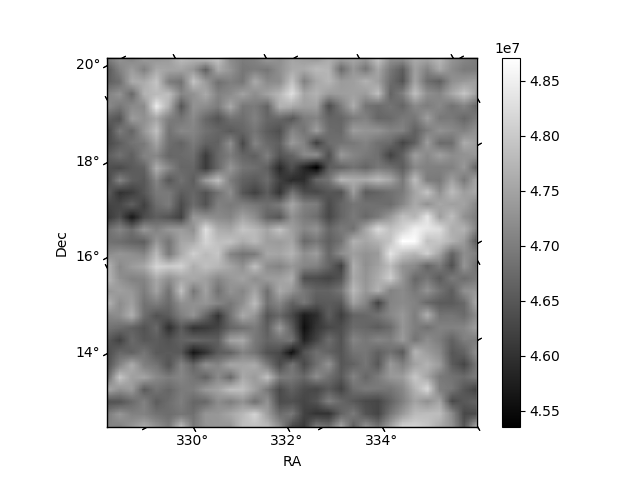
Histogram calculated using DETX and DETY for each event in the final _common_clean file
| Quadrant A | 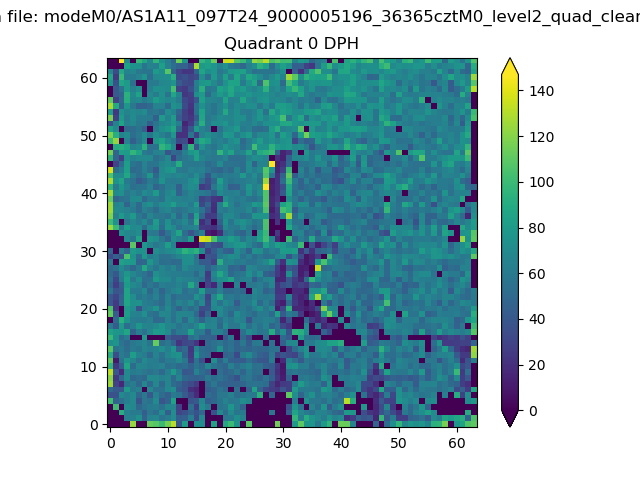 |
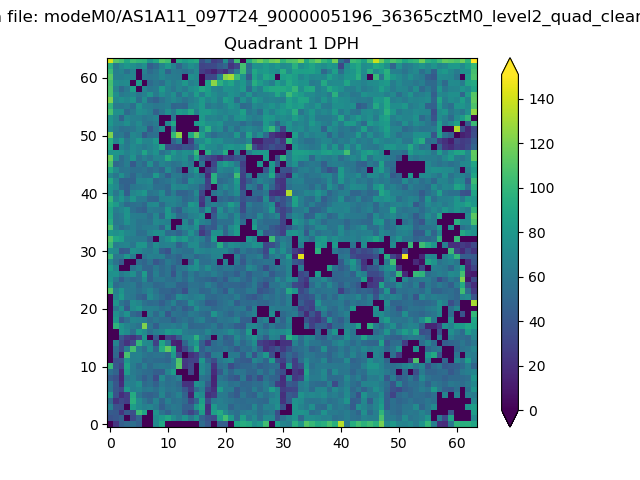 |
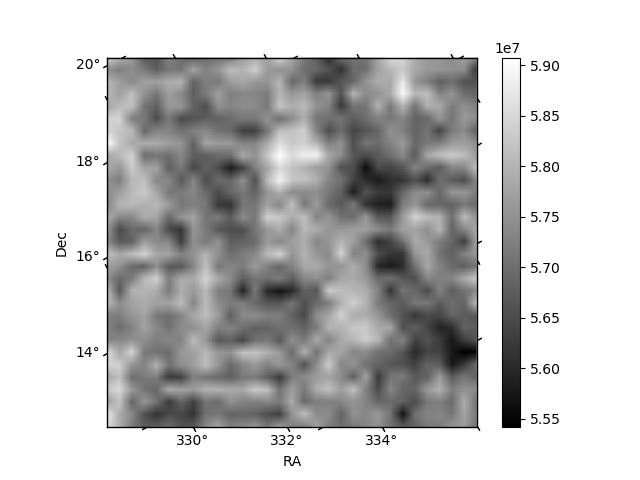
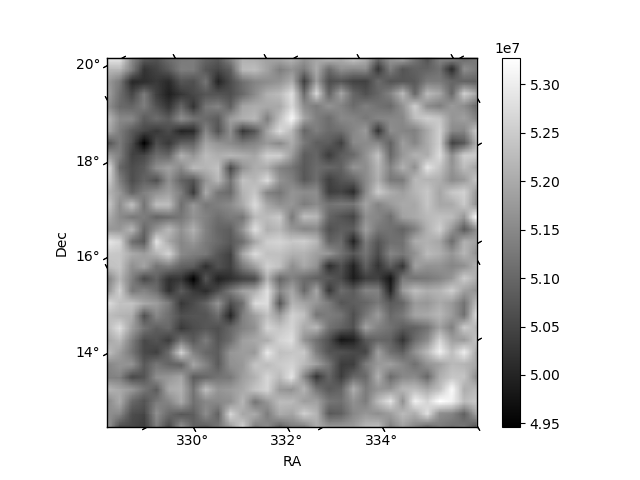
Quadrant B |
|---|---|---|---|
| Quadrant D | 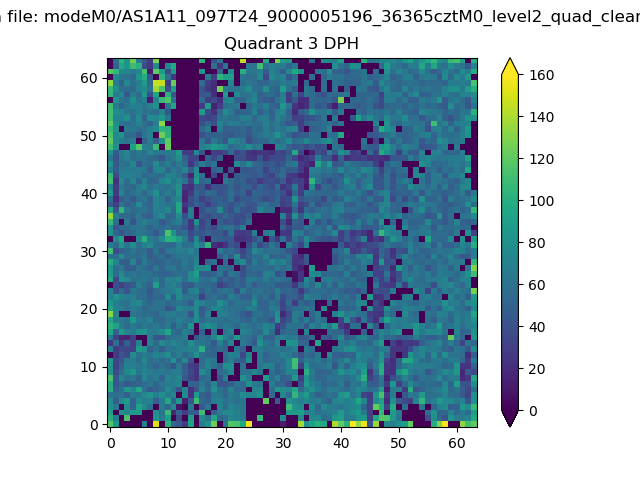 |
 |
Quadrant C |
| Plot type | Count rate plots | Images |
|---|---|---|
| Comparison with Poisson distribution Blue bars denote a histogram of data divided into 1 sec bins. Red curve is a Poisson curve with rate = median count rate of data. |
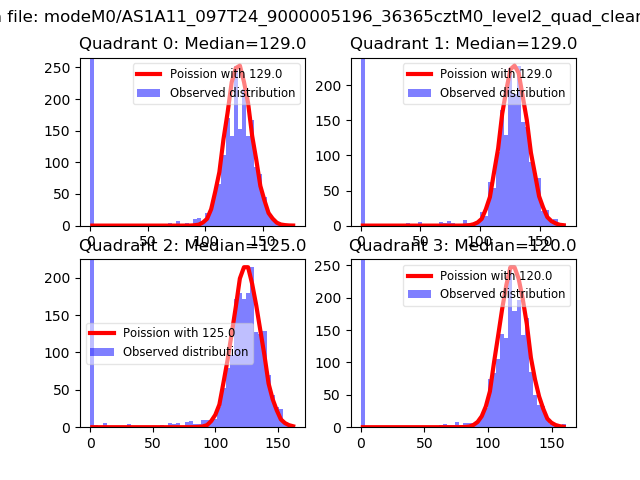 |
 |
| Quadrant-wise count rates Data is divided into 100 sec bins |
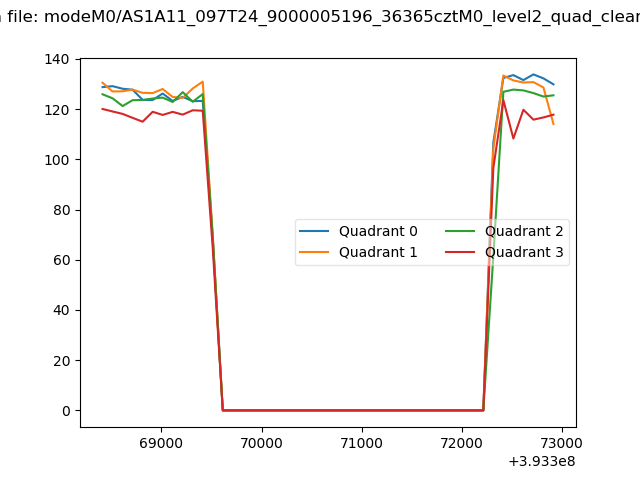 |
|
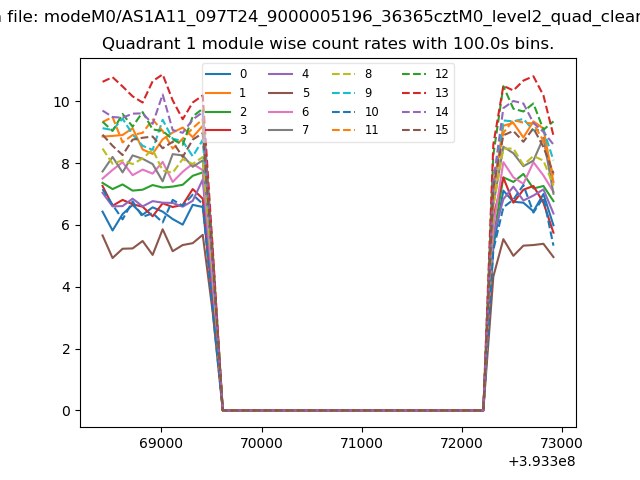
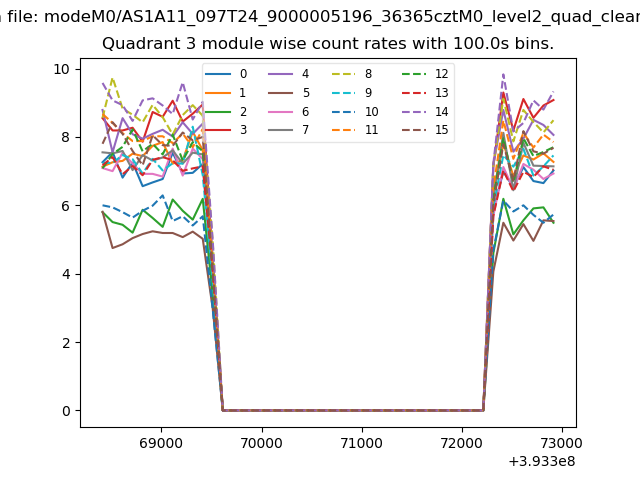
| Module-wise count rates for Quadrant A Data is divided into 100 sec bins |
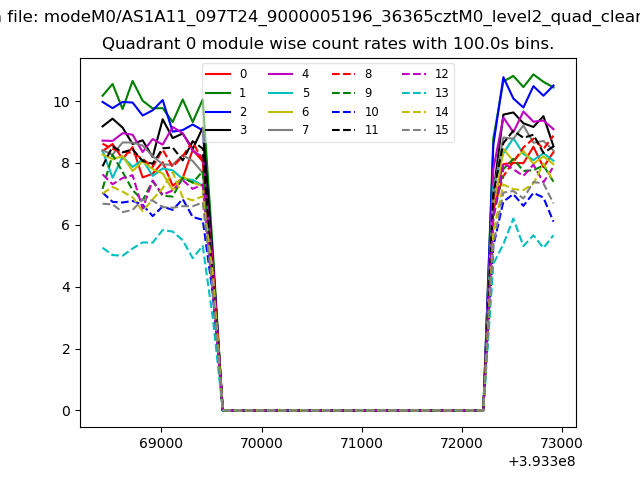 |
 |
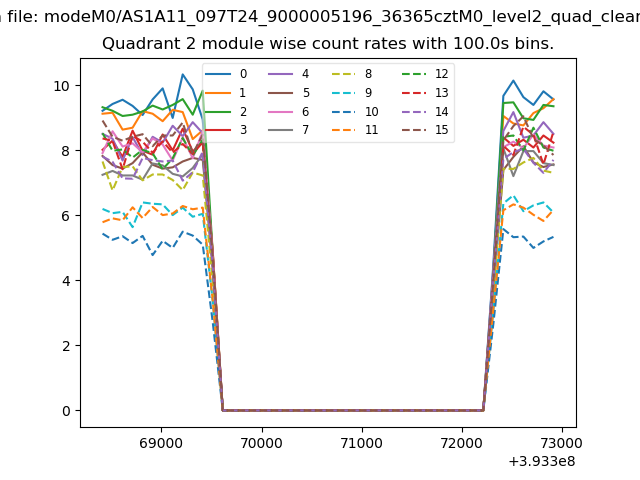
| Module-wise count rates for Quadrant B Data is divided into 100 sec bins |
 |
 |
| Module-wise count rates for Quadrant C Data is divided into 100 sec bins |
 |
 |
| Module-wise count rates for Quadrant D Data is divided into 100 sec bins |
 |
 |
| Parameter | Plot |
|---|---|
| CZT HV Monitor | 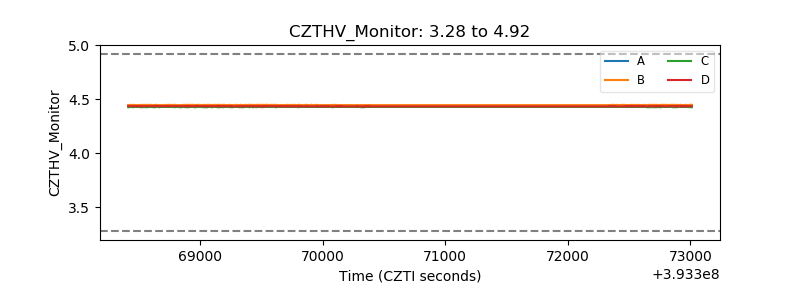 |
| D_VDD | 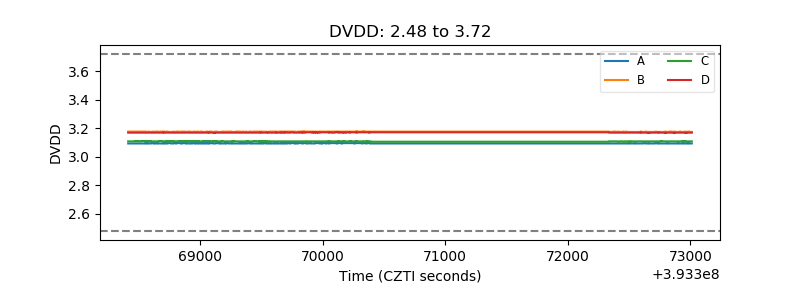 |
| Temperature 1 | 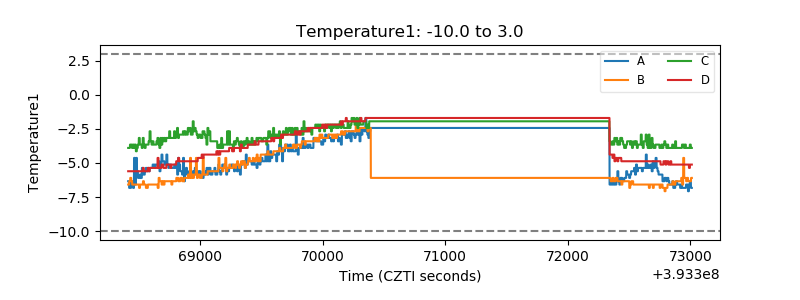 |
| Veto HV Monitor | 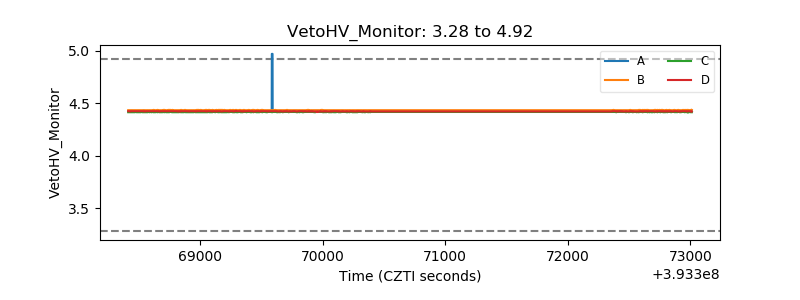 |
| Veto LLD | 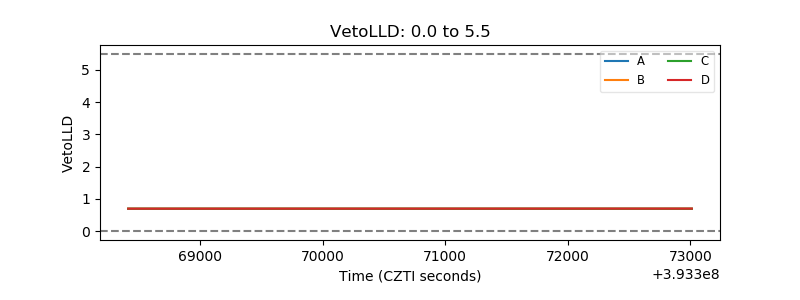 |
| Alpha Counter | 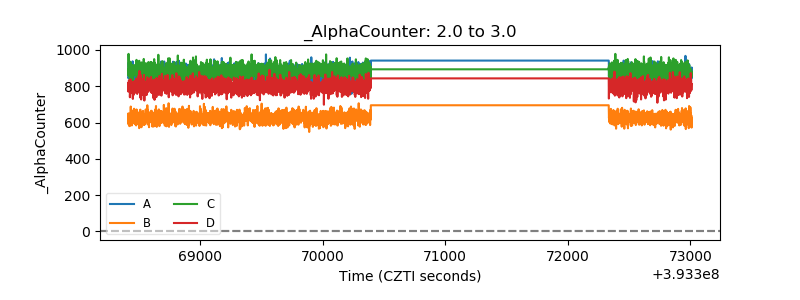 |
| _CPM_Rate | 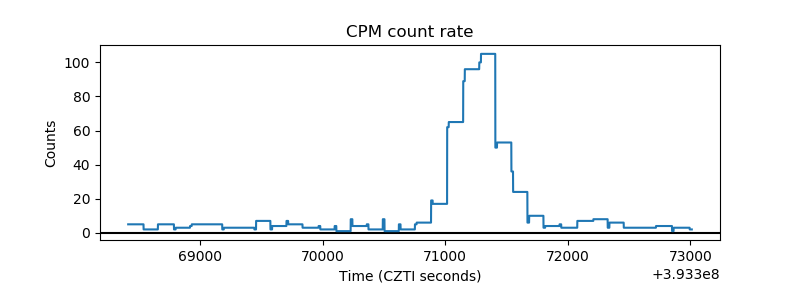 |
| CZT Counter | 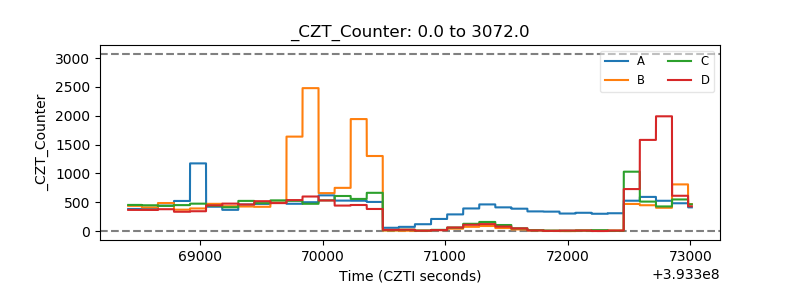 |
| +2.5 Volts monitor | 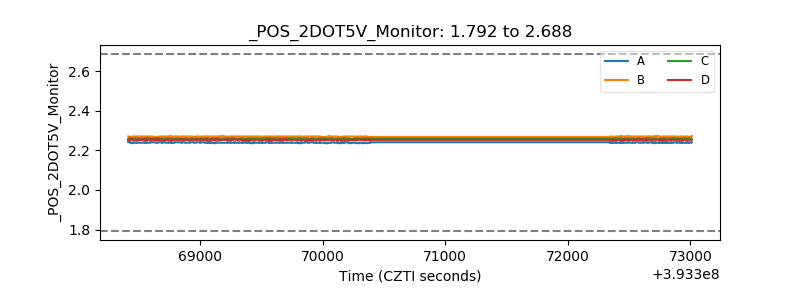 |
| +5 Volts monitor | 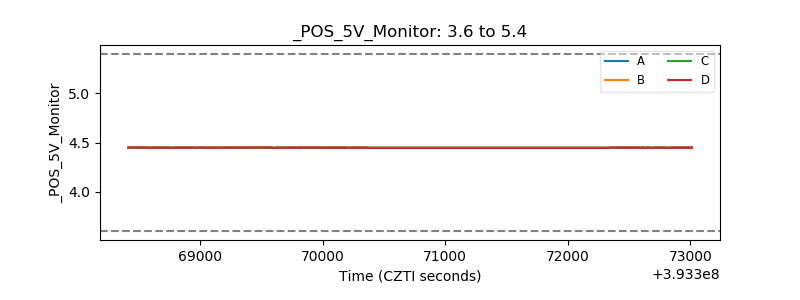 |
| _ROLL_ROT | 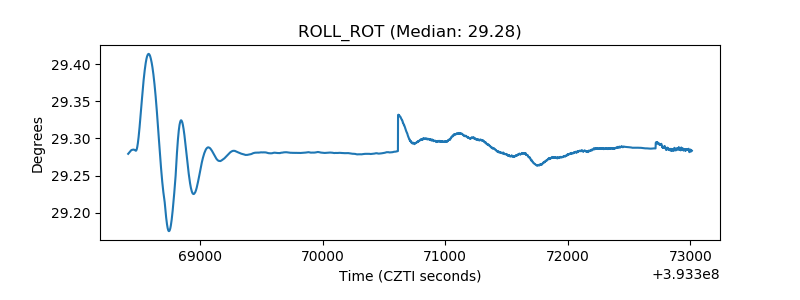 |
| _Roll_DEC | 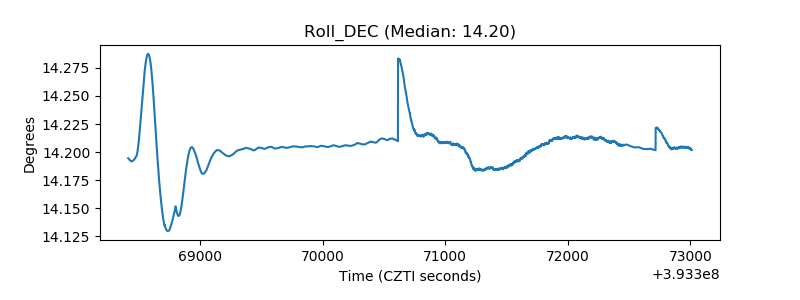 |
| _Roll_RA | 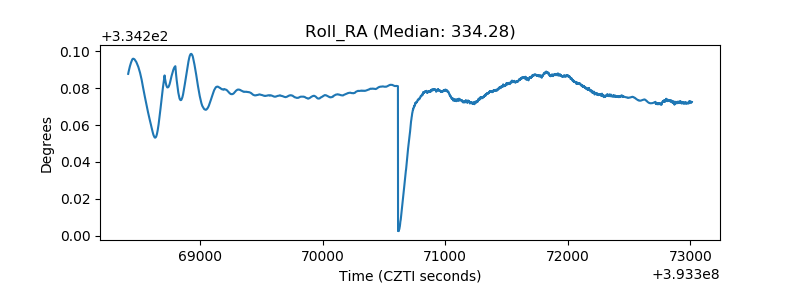 |
| Veto Counter | 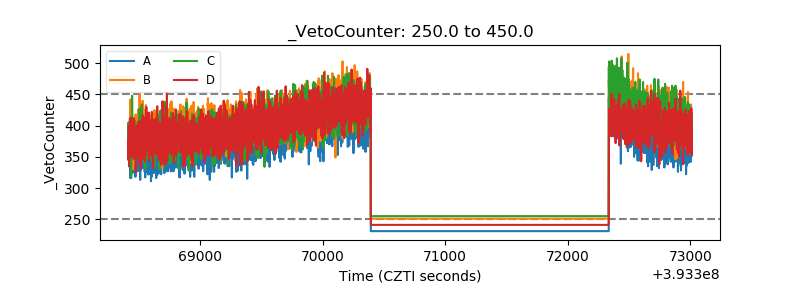 |