| Param | Original file | Final file |
|---|---|---|
| Filename | modeM0/AS1A11_097T24_9000005196cztM0_level2_bc.evt | modeM0/AS1A11_097T24_9000005196cztM0_level2_quad_clean.evt |
| Size (bytes) | 5,069,018,880 | 1,237,008,960 |
| Size | 4.7 GB | 1.2 GB |
| Events in quadrant A | 27,762,535 | 7,848,948 |
| Events in quadrant B | 40,546,735 | 7,654,809 |
| Events in quadrant C | 33,339,547 | 7,685,261 |
| Events in quadrant D | 44,647,425 | 6,999,243 |
| Mode SS | |||
|---|---|---|---|
| Quadrant | BADHDUFLAG | Total packets | Discarded packets |
| A | 0 | 2172 | 0 |
| B | 0 | 2172 | 0 |
| C | 0 | 2172 | 0 |
| D | 0 | 2172 | 0 |
| Mode M9 | |||
|---|---|---|---|
| Quadrant | BADHDUFLAG | Total packets | Discarded packets |
| A | 0 | 380 | 0 |
| B | 0 | 380 | 0 |
| C | 0 | 380 | 0 |
| D | 0 | 380 | 0 |
| Mode M0 | |||
|---|---|---|---|
| Quadrant | BADHDUFLAG | Total packets | Discarded packets |
| A | 0 | 241071 | 0 |
| B | 0 | 300447 | 0 |
| C | 0 | 245109 | 0 |
| D | 0 | 314861 | 0 |
| Quadrant | Total seconds | Saturated seconds | Saturation percentage |
|---|---|---|---|
| A | 106143 | 2243 | 2.113187% |
| B | 106143 | 8493 | 8.001470% |
| C | 106143 | 1953 | 1.839971% |
| D | 106143 | 7697 | 7.251538% |
Noise dominated data is calculated using 1-second bins in cleaned event files. If a bin has >2000 counts, and if more than 50% of those come from <1% of pixels, then it is considered to be noise-dominated and hence unusable.
| Quadrant | # 1 sec bins | Bins with >0 counts | Bins with >2000 counts | High rate bins dominated by noise | Noise dominated (total time) | Noise dominated (detector-on time) | Marked lightcurve |
|---|---|---|---|---|---|---|---|
| A | 144224 | 106163 | 34 | 34 | 0.02% | 0.03% | 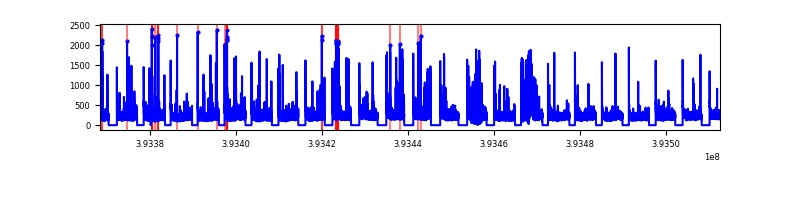 |
| B | 144224 | 106134 | 89 | 89 | 0.06% | 0.08% | 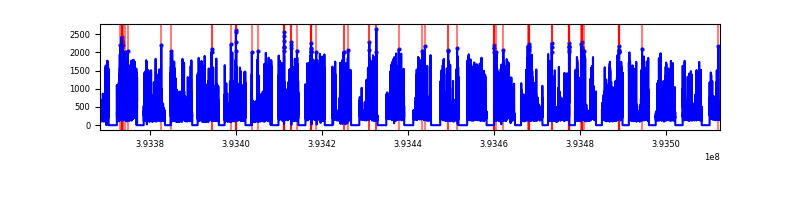 |
| C | 144224 | 106140 | 365 | 365 | 0.25% | 0.34% | 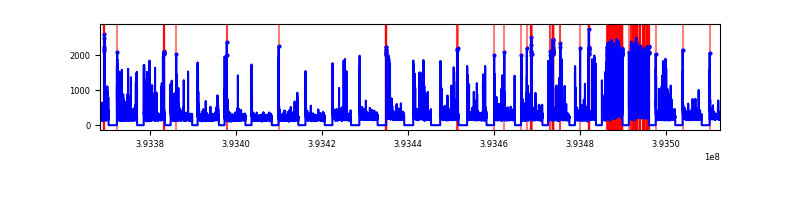 |
| D | 144224 | 106136 | 326 | 326 | 0.23% | 0.31% | 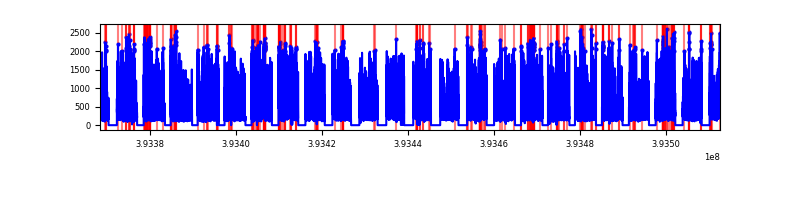 |
Top three noisy pixels from each quadrant. If the there are fewer than three noisy pixels in the level2.evt file, extra rows are filled as -1
| Pixel properties | Quadrant properties | ||||||
|---|---|---|---|---|---|---|---|
| Quadrant | DetID | PixID | Counts | Sigma | Mean | Median | Sigma |
| A | 10 | 83 | 2706658 | 2266.8 | 5454 | 5373 | 1191.7 |
| A | 15 | 223 | 2359062 | 1975.11 | 5454 | 5373 | 1191.7 |
| A | 12 | 189 | 658939 | 548.44 | 5454 | 5373 | 1191.7 |
| B | 5 | 172 | 14693068 | 14133.59 | 5300 | 5190 | 1039.2 |
| B | 5 | 255 | 1697147 | 1628.11 | 5300 | 5190 | 1039.2 |
| B | 4 | 171 | 1285995 | 1232.47 | 5300 | 5190 | 1039.2 |
| C | 4 | 254 | 6178967 | 5179.27 | 5264 | 5220 | 1192.0 |
| C | 15 | 214 | 4233635 | 3547.29 | 5264 | 5220 | 1192.0 |
| C | 0 | 10 | 1520725 | 1271.38 | 5264 | 5220 | 1192.0 |
| D | 12 | 6 | 9622074 | 8046.04 | 5139 | 4988 | 1195.3 |
| D | 2 | 250 | 3322963 | 2775.95 | 5139 | 4988 | 1195.3 |
| D | 2 | 249 | 3297245 | 2754.43 | 5139 | 4988 | 1195.3 |
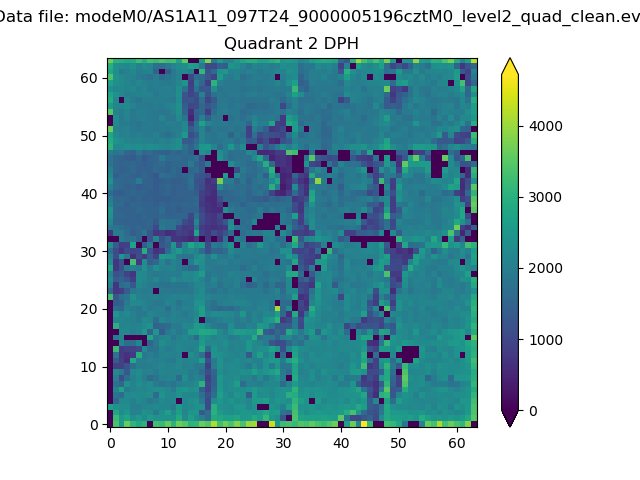
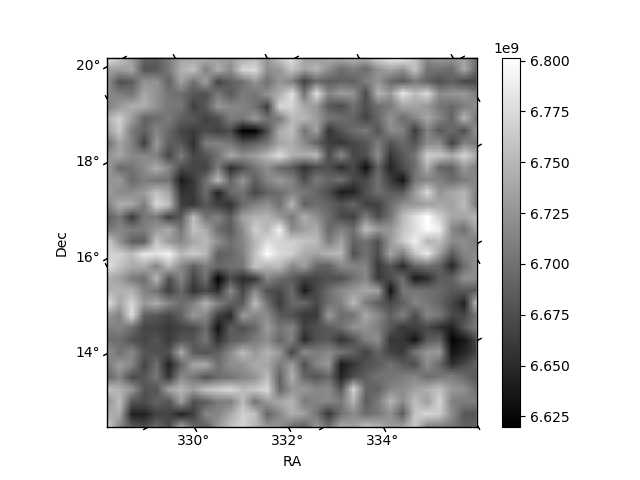
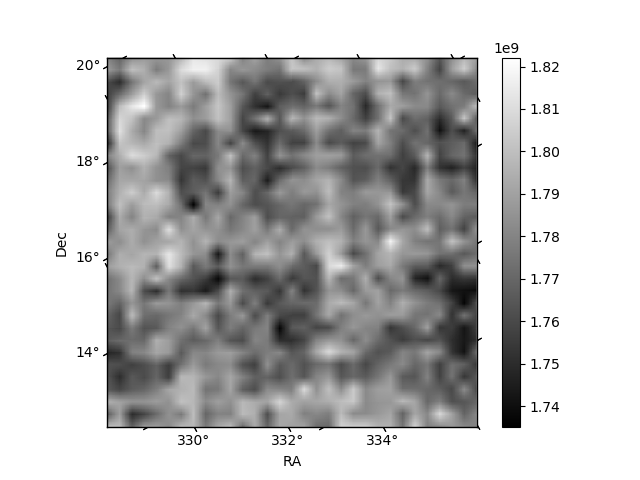
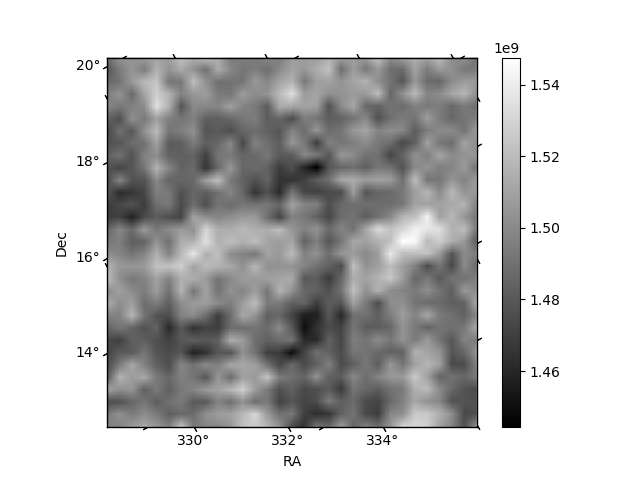
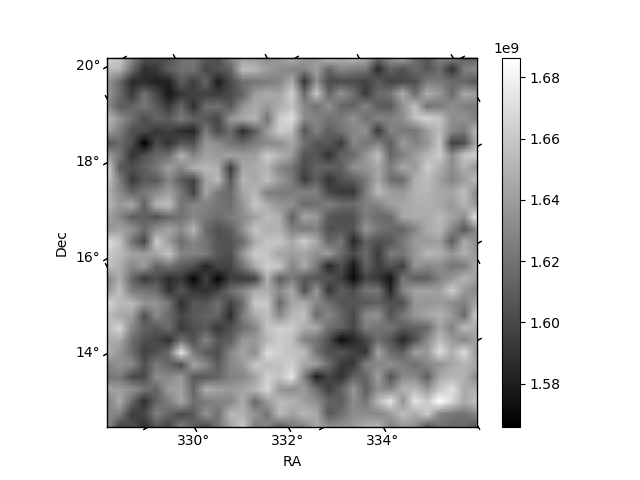
Histogram calculated using DETX and DETY for each event in the final _common_clean file
| Quadrant A | 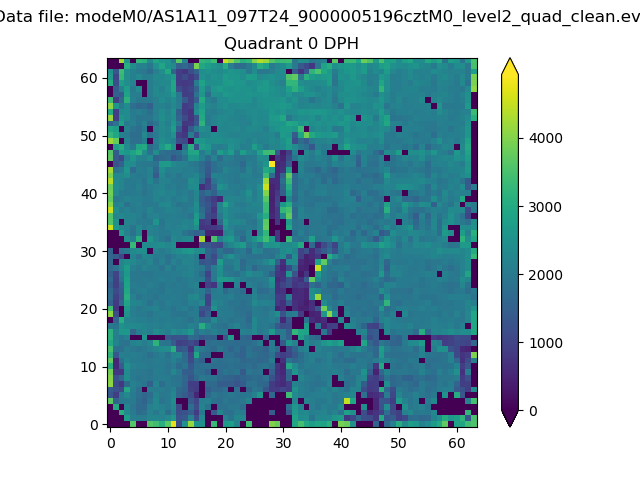 |
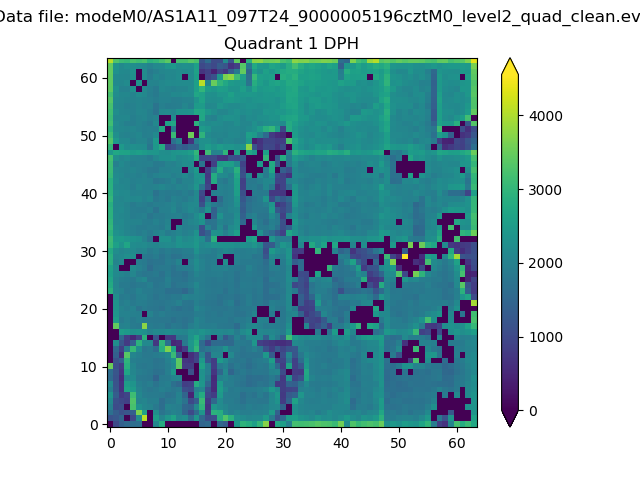 |
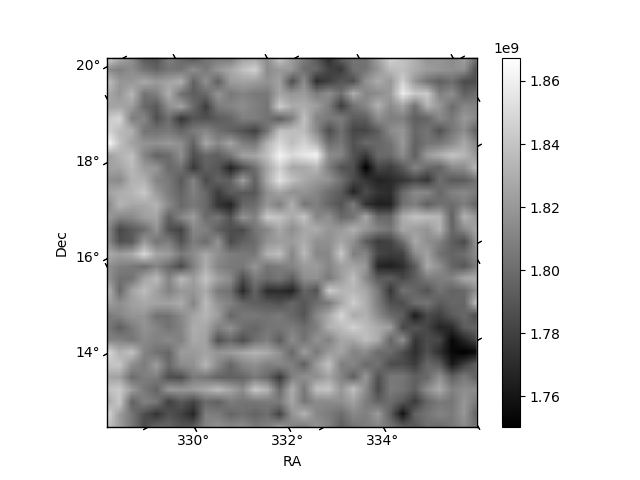
Quadrant B |
|---|---|---|---|
| Quadrant D | 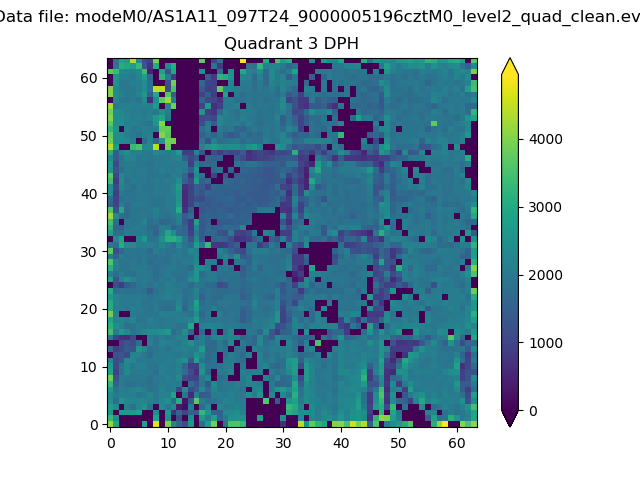 |
 |
Quadrant C |
| Plot type | Count rate plots | Images |
|---|---|---|
| Comparison with Poisson distribution Blue bars denote a histogram of data divided into 1 sec bins. Red curve is a Poisson curve with rate = median count rate of data. |
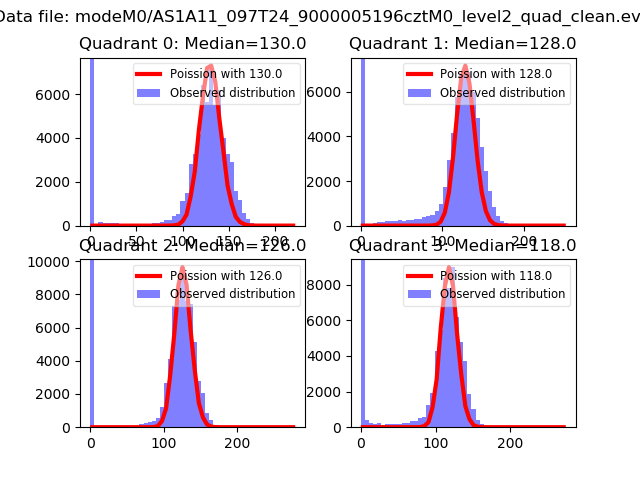 |
 |
| Quadrant-wise count rates Data is divided into 100 sec bins |
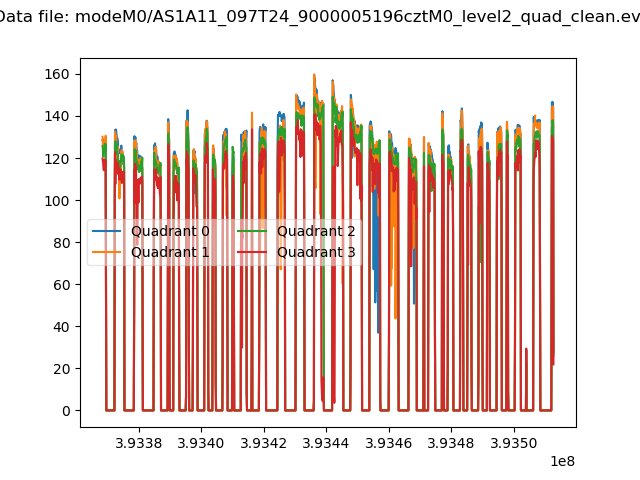 |
|
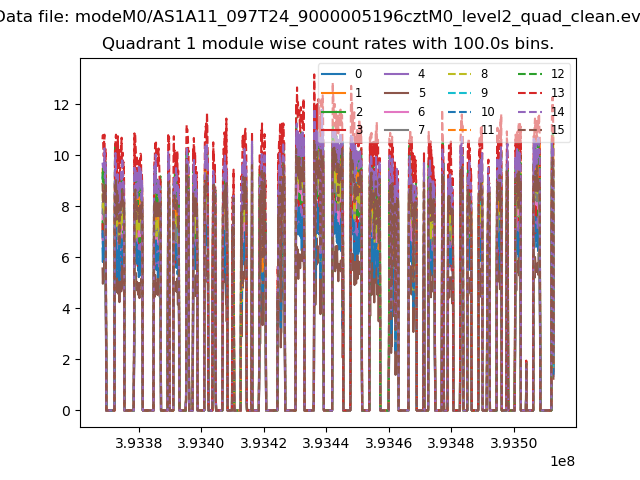
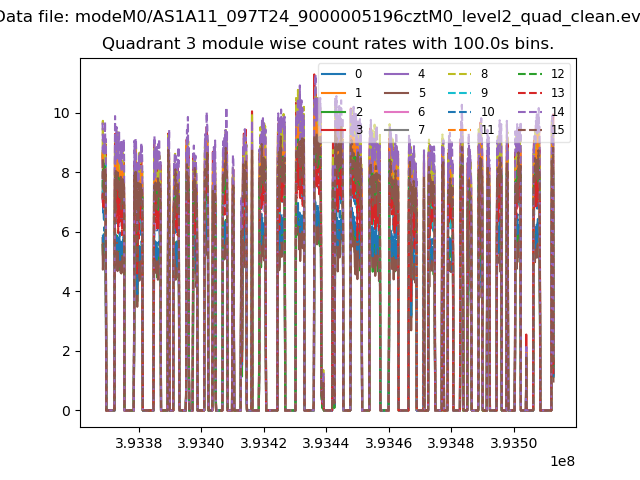
| Module-wise count rates for Quadrant A Data is divided into 100 sec bins |
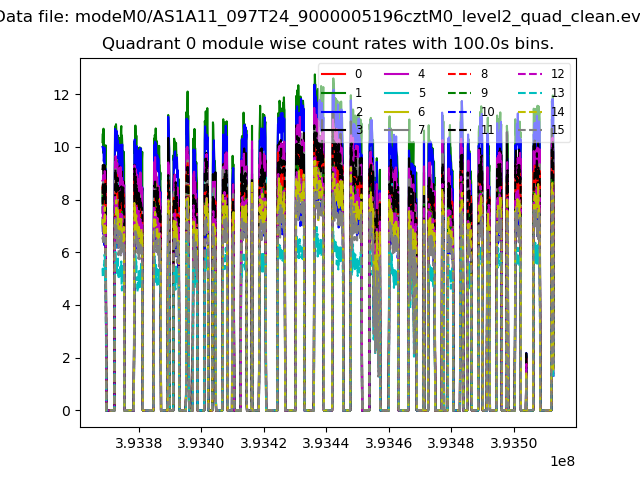 |
 |
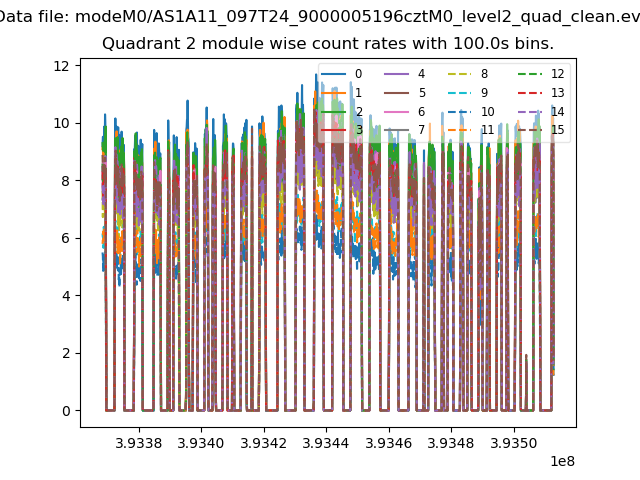
| Module-wise count rates for Quadrant B Data is divided into 100 sec bins |
 |
 |
| Module-wise count rates for Quadrant C Data is divided into 100 sec bins |
 |
 |
| Module-wise count rates for Quadrant D Data is divided into 100 sec bins |
 |
 |
| Parameter | Plot |
|---|---|
| CZT HV Monitor | 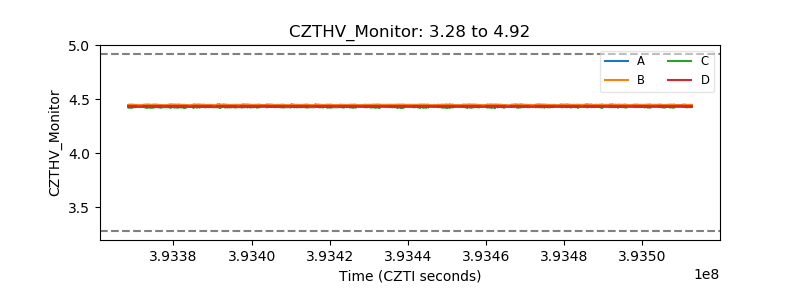 |
| D_VDD | 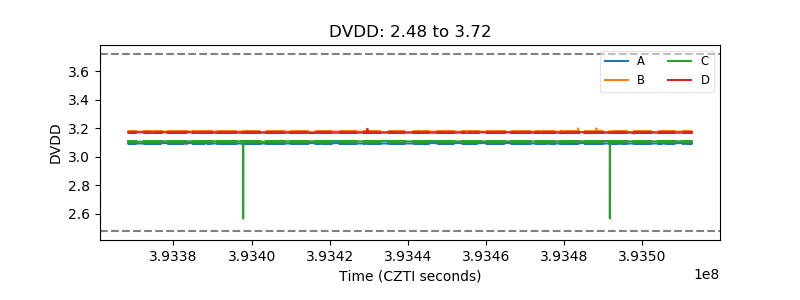 |
| Temperature 1 | 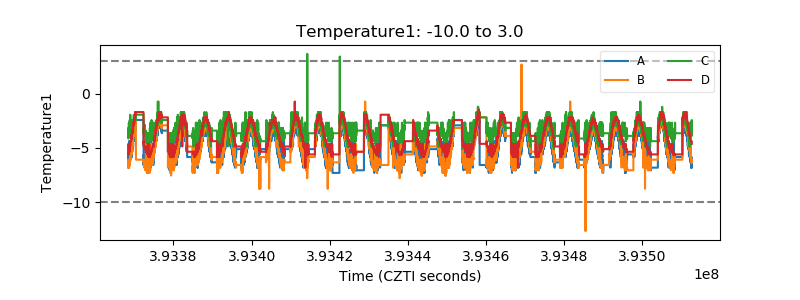 |
| Veto HV Monitor | 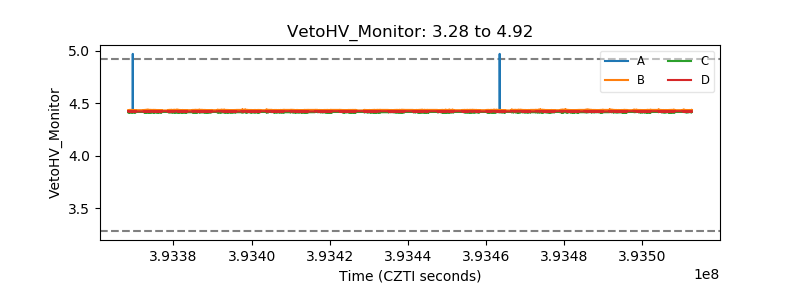 |
| Veto LLD | 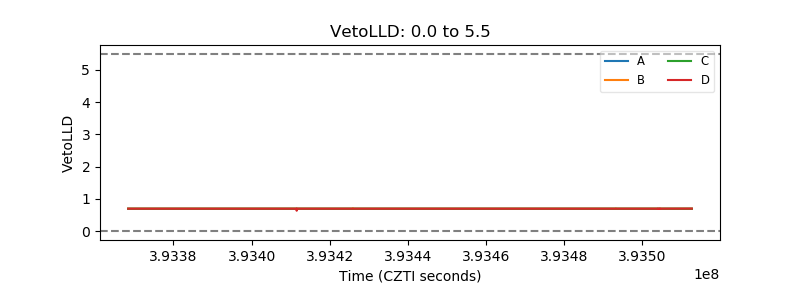 |
| Alpha Counter | 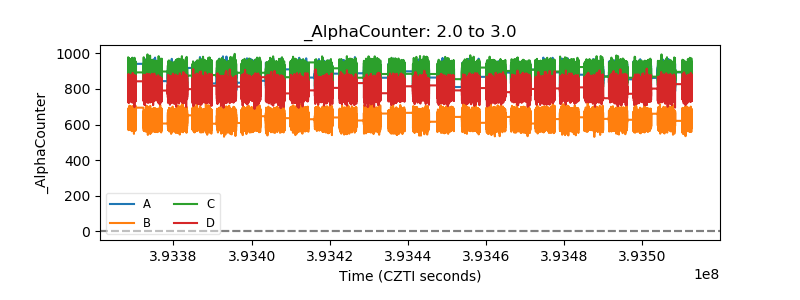 |
| _CPM_Rate | 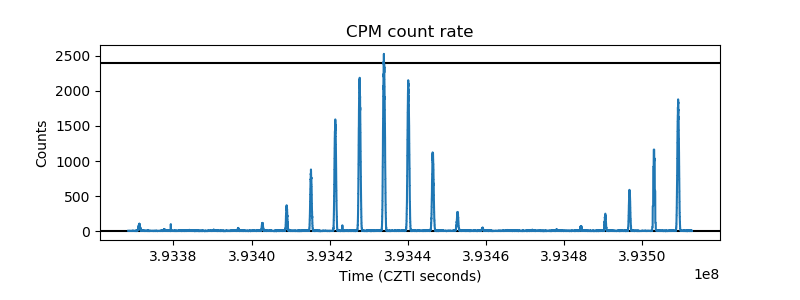 |
| CZT Counter | 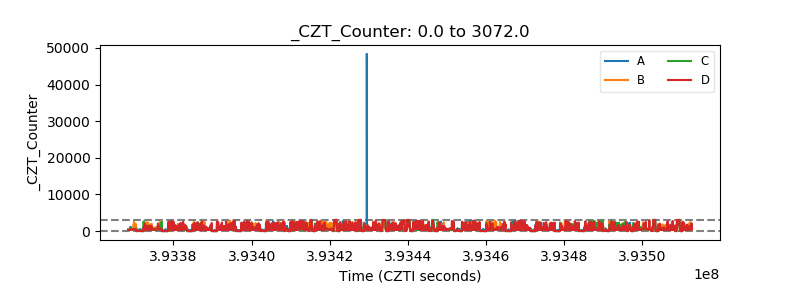 |
| +2.5 Volts monitor | 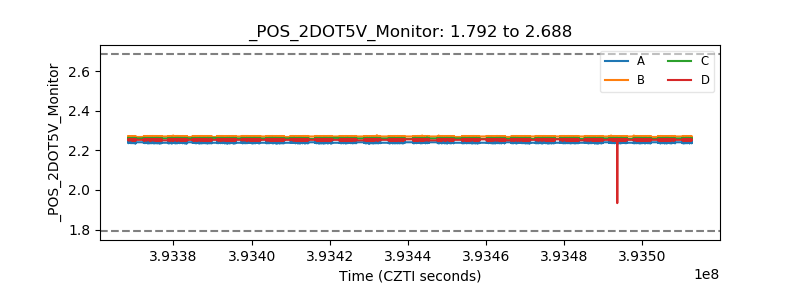 |
| +5 Volts monitor | 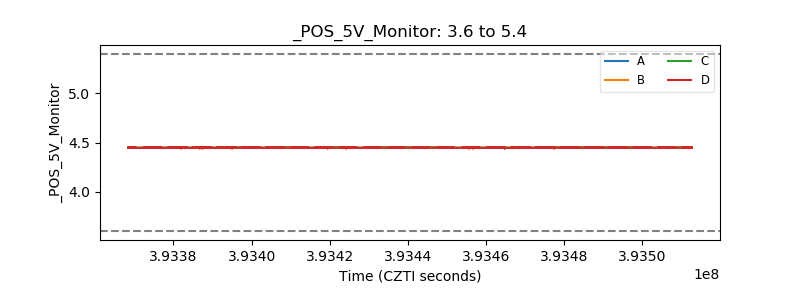 |
| _ROLL_ROT | 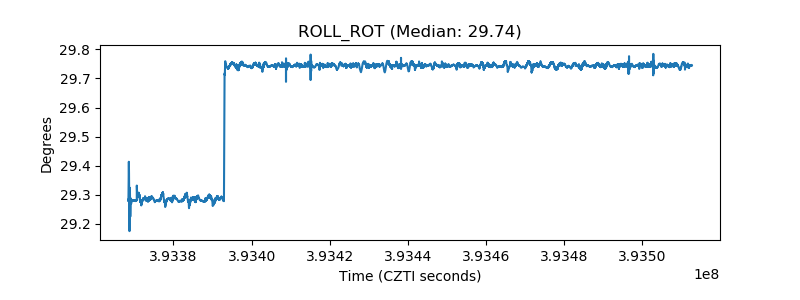 |
| _Roll_DEC | 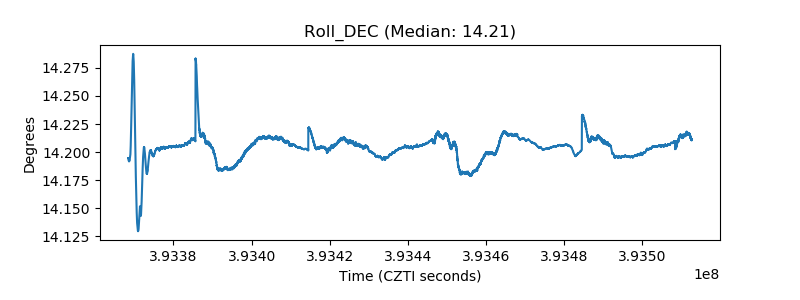 |
| _Roll_RA | 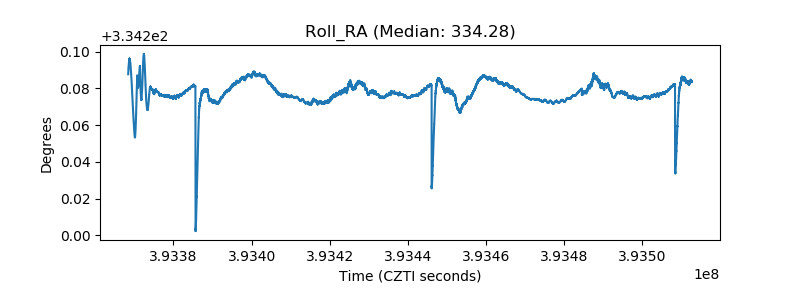 |
| Veto Counter | 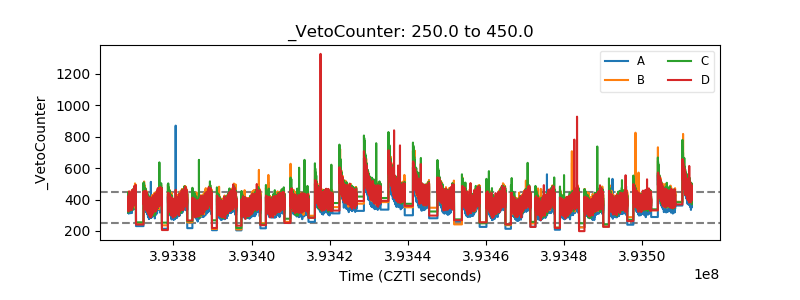 |