| Param | Original file | Final file |
|---|---|---|
| Filename | modeM0/AS1C07_001T08_9000005190_36342cztM0_level2.evt | modeM0/AS1C07_001T08_9000005190_36342cztM0_level2_quad_clean.evt |
| Size (bytes) | 291,360,960 | 53,412,480 |
| Size | 277.9 MB | 50.9 MB |
| Events in quadrant A | 1,872,213 | 343,725 |
| Events in quadrant B | 2,531,108 | 332,632 |
| Events in quadrant C | 1,851,974 | 340,118 |
| Events in quadrant D | 2,301,418 | 324,333 |
| Mode M9 | |||
|---|---|---|---|
| Quadrant | BADHDUFLAG | Total packets | Discarded packets |
| A | 0 | 5 | 0 |
| B | 0 | 5 | 0 |
| C | 0 | 5 | 0 |
| D | 0 | 6 | 0 |
| Mode M0 | |||
|---|---|---|---|
| Quadrant | BADHDUFLAG | Total packets | Discarded packets |
| A | 0 | 8123 | 1 |
| B | 0 | 10068 | 1 |
| C | 0 | 7987 | 1 |
| D | 0 | 9559 | 1 |
| Mode SS | |||
|---|---|---|---|
| Quadrant | BADHDUFLAG | Total packets | Discarded packets |
| A | 0 | 78 | 0 |
| B | 0 | 78 | 0 |
| C | 0 | 78 | 0 |
| D | 0 | 78 | 0 |
| Quadrant | Total seconds | Saturated seconds | Saturation percentage |
|---|---|---|---|
| A | 3912 | 7 | 0.178937% |
| B | 3912 | 188 | 4.805726% |
| C | 3912 | 4 | 0.102249% |
| D | 3912 | 95 | 2.428425% |
Noise dominated data is calculated using 1-second bins in cleaned event files. If a bin has >2000 counts, and if more than 50% of those come from <1% of pixels, then it is considered to be noise-dominated and hence unusable.
| Quadrant | # 1 sec bins | Bins with >0 counts | Bins with >2000 counts | High rate bins dominated by noise | Noise dominated (total time) | Noise dominated (detector-on time) | Marked lightcurve |
|---|---|---|---|---|---|---|---|
| A | 3912 | 3912 | 2 | 2 | 0.05% | 0.05% |  |
| B | 3912 | 3912 | 149 | 149 | 3.81% | 3.81% |  |
| C | 3912 | 3912 | 1 | 1 | 0.03% | 0.03% |  |
| D | 3912 | 3912 | 94 | 94 | 2.40% | 2.40% |  |
Top three noisy pixels from each quadrant. If the there are fewer than three noisy pixels in the level2.evt file, extra rows are filled as -1
| Pixel properties | Quadrant properties | ||||||
|---|---|---|---|---|---|---|---|
| Quadrant | DetID | PixID | Counts | Sigma | Mean | Median | Sigma |
| A | 10 | 83 | 127863 | 1457.07 | 428 | 418 | 87.5 |
| A | 9 | 143 | 35968 | 406.44 | 428 | 418 | 87.5 |
| A | 12 | 189 | 21101 | 236.47 | 428 | 418 | 87.5 |
| B | 5 | 172 | 313334 | 3923.94 | 416 | 405 | 79.7 |
| B | 5 | 255 | 166188 | 2078.82 | 416 | 405 | 79.7 |
| B | 5 | 236 | 137732 | 1722.0 | 416 | 405 | 79.7 |
| C | 15 | 214 | 170049 | 1744.34 | 416 | 418 | 97.2 |
| C | 0 | 10 | 47468 | 483.82 | 416 | 418 | 97.2 |
| C | 4 | 254 | 3131 | 27.9 | 416 | 418 | 97.2 |
| D | 12 | 6 | 305848 | 2938.88 | 416 | 403 | 103.9 |
| D | 13 | 171 | 78254 | 749.05 | 416 | 403 | 103.9 |
| D | 2 | 153 | 72047 | 689.33 | 416 | 403 | 103.9 |
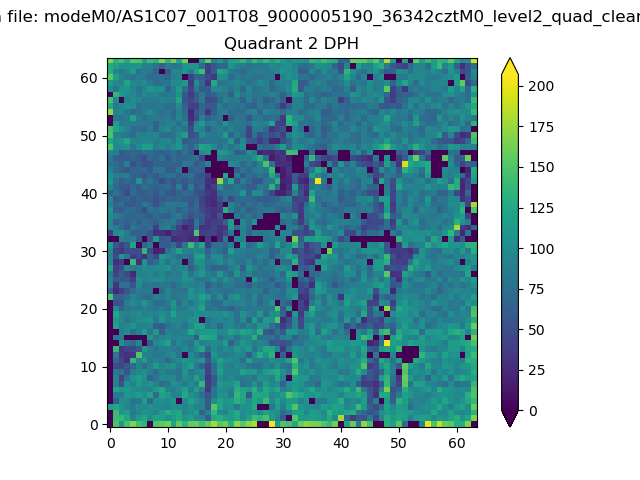
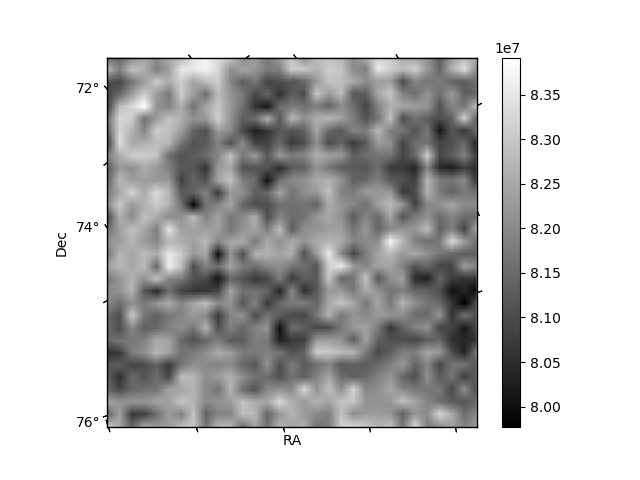
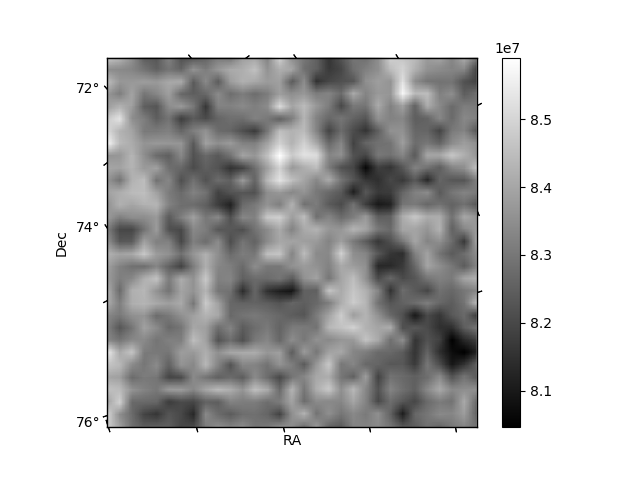
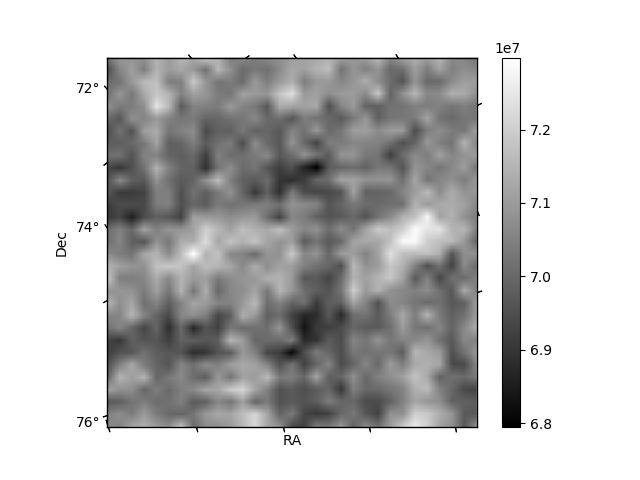
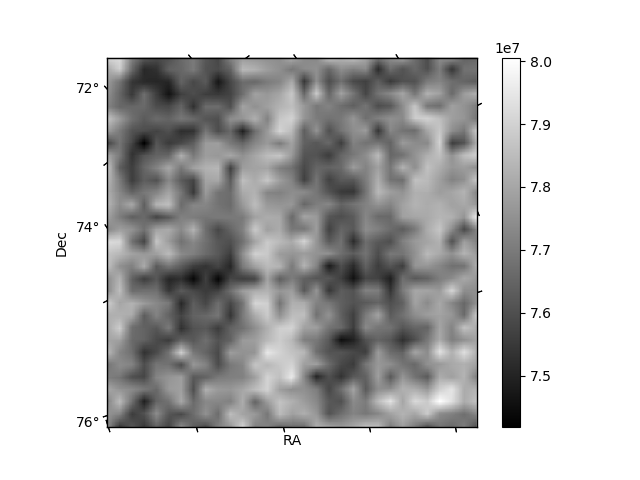
Histogram calculated using DETX and DETY for each event in the final _common_clean file
| Quadrant A | 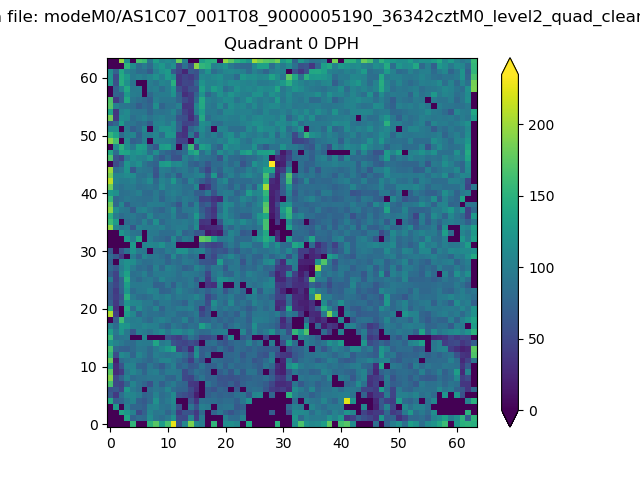 |
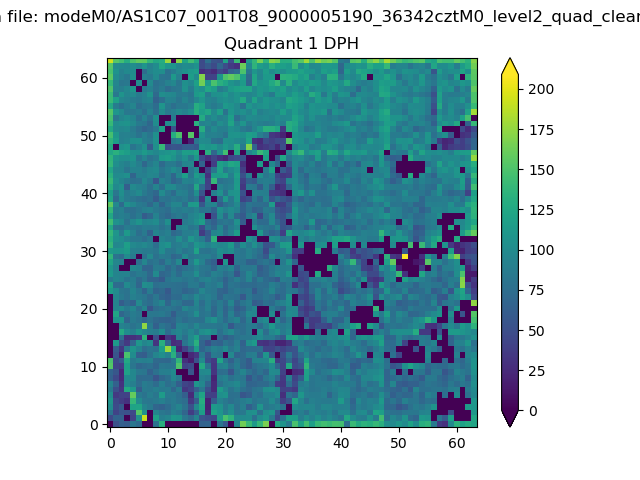 |
Quadrant B |
|---|---|---|---|
| Quadrant D | 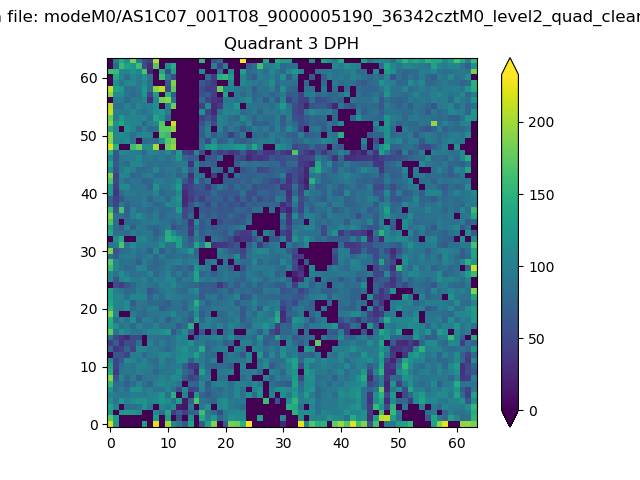 |
 |
Quadrant C |
| Plot type | Count rate plots | Images |
|---|---|---|
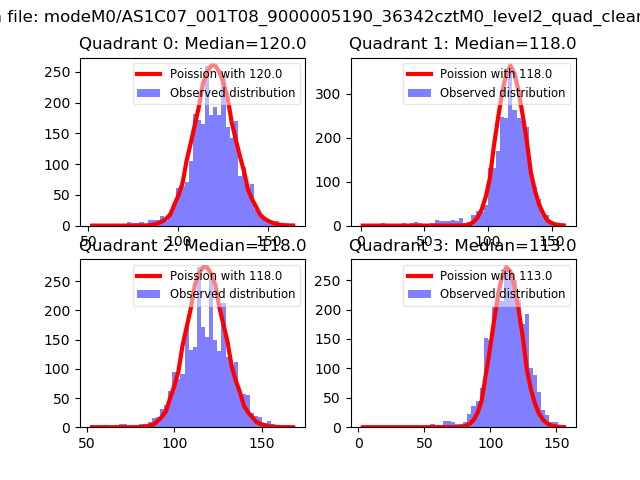
| Comparison with Poisson distribution Blue bars denote a histogram of data divided into 1 sec bins. Red curve is a Poisson curve with rate = median count rate of data. |
 |
 |
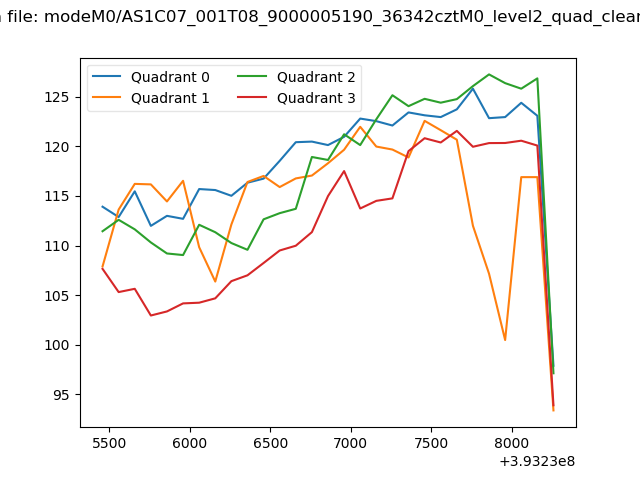
| Quadrant-wise count rates Data is divided into 100 sec bins |
 |
|
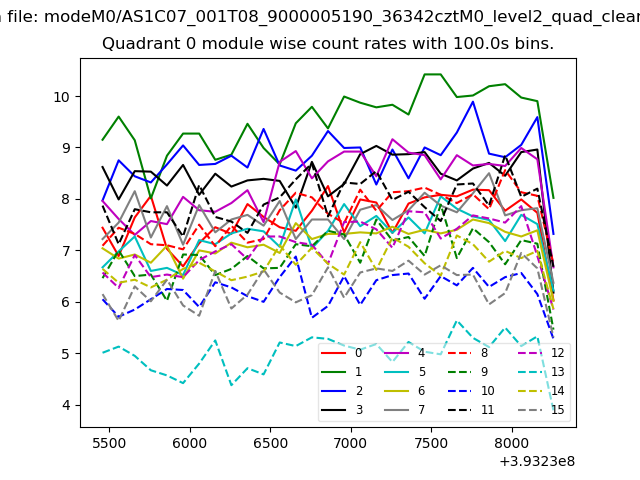
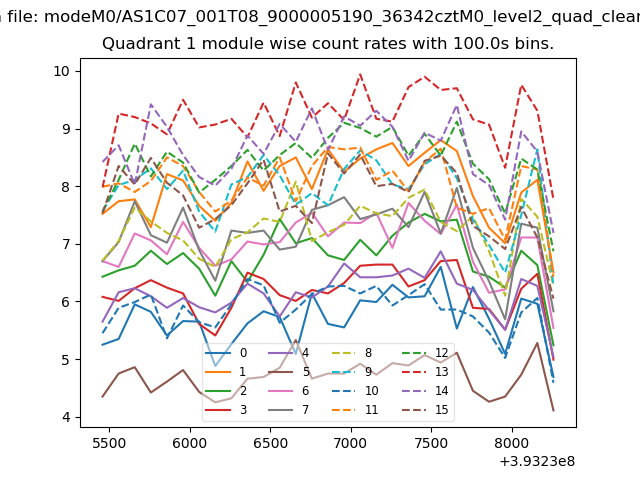
| Module-wise count rates for Quadrant A Data is divided into 100 sec bins |
 |
 |
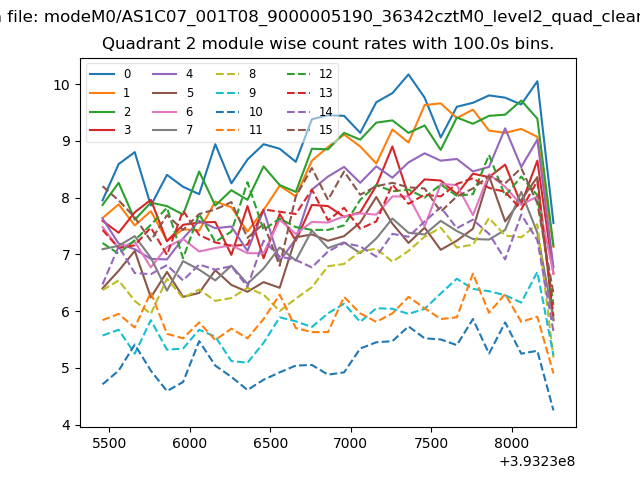
| Module-wise count rates for Quadrant B Data is divided into 100 sec bins |
 |
 |
| Module-wise count rates for Quadrant C Data is divided into 100 sec bins |
 |
 |
| Module-wise count rates for Quadrant D Data is divided into 100 sec bins |
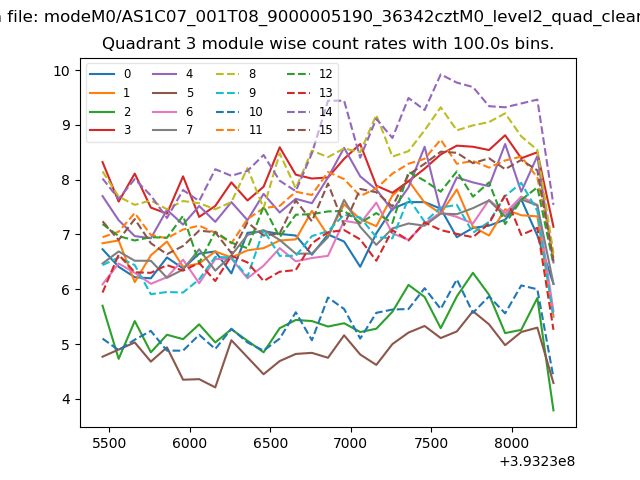 |
 |
| Parameter | Plot |
|---|---|
| CZT HV Monitor | 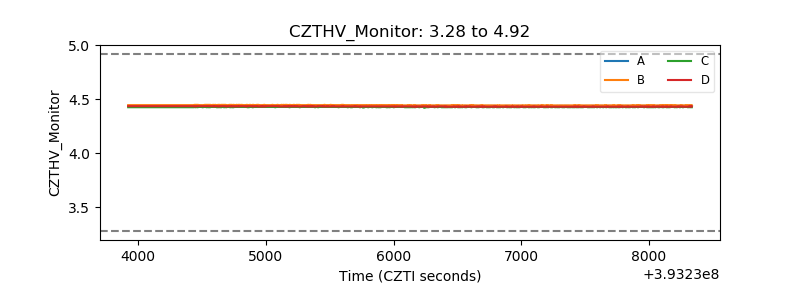 |
| D_VDD | 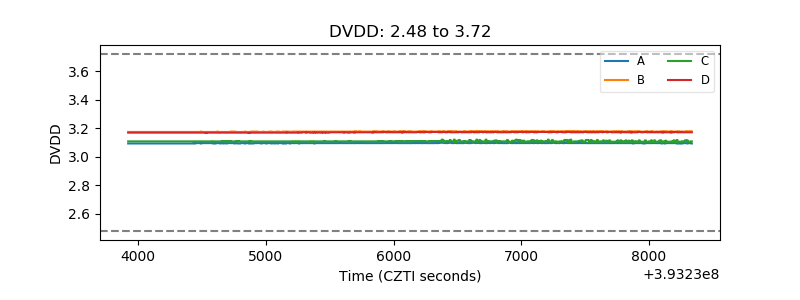 |
| Temperature 1 | 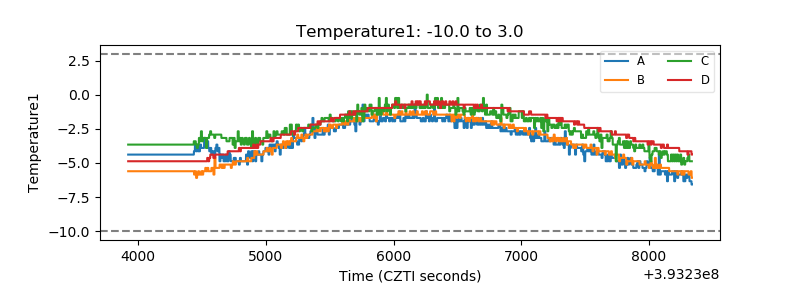 |
| Veto HV Monitor | 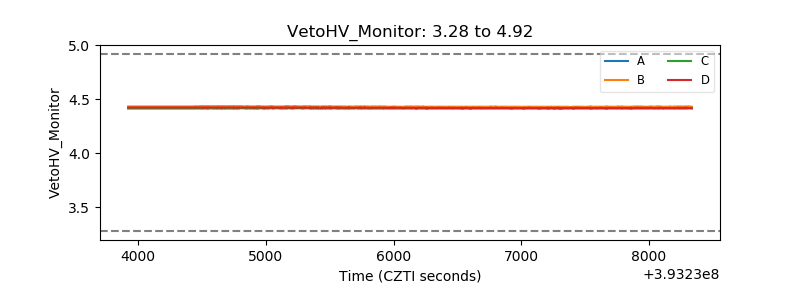 |
| Veto LLD |  |
| Alpha Counter | 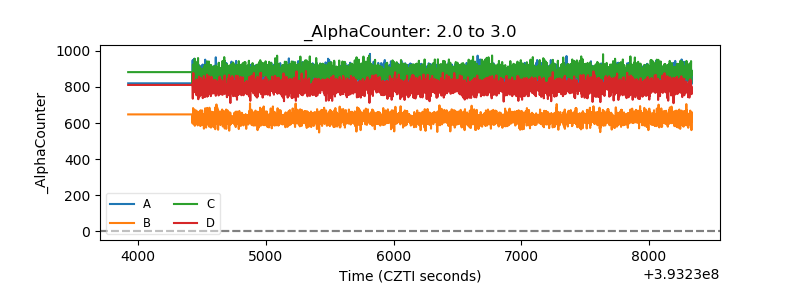 |
| _CPM_Rate | 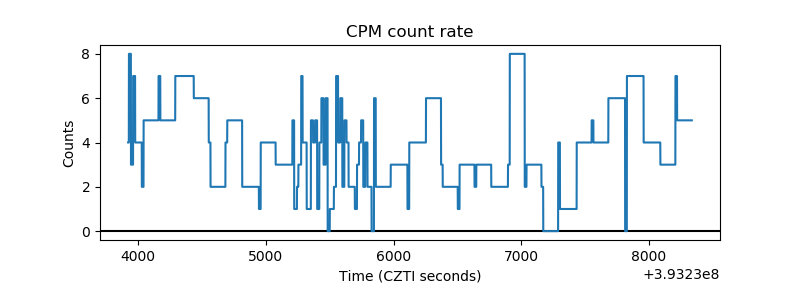 |
| CZT Counter | 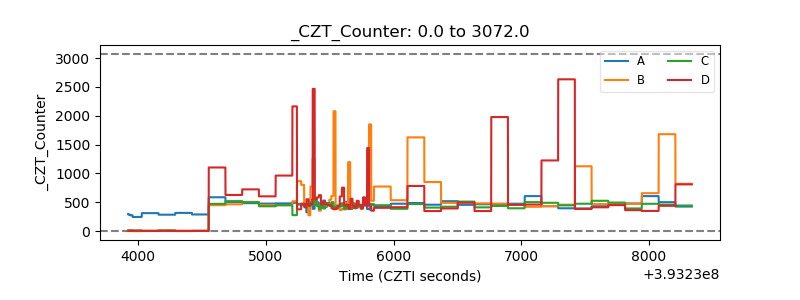 |
| +2.5 Volts monitor | 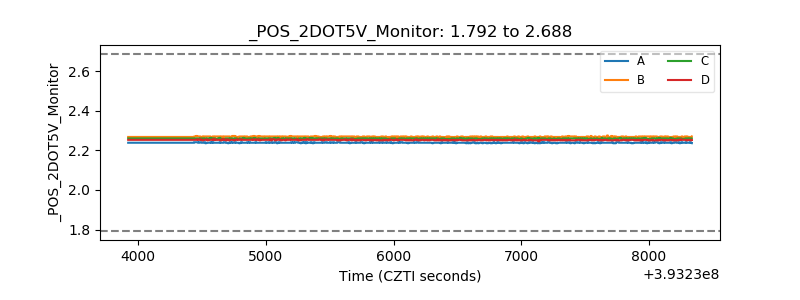 |
| +5 Volts monitor | 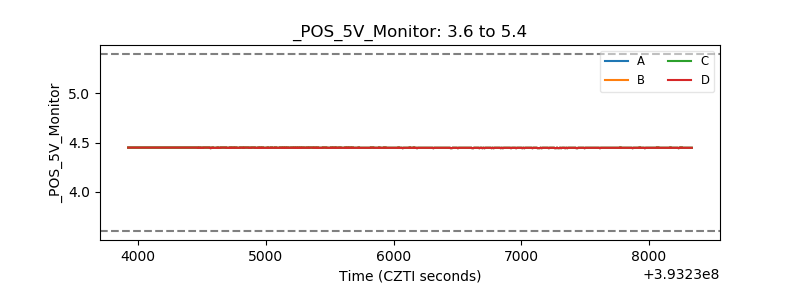 |
| _ROLL_ROT | 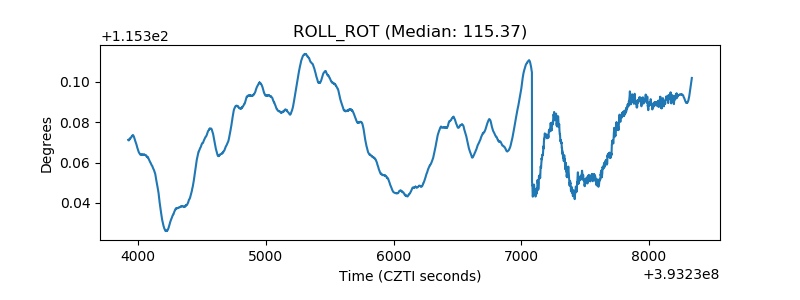 |
| _Roll_DEC | 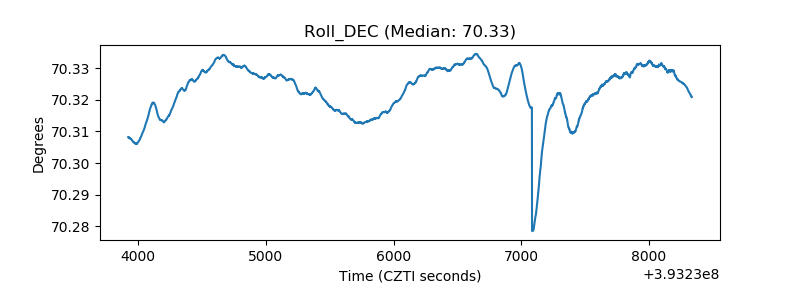 |
| _Roll_RA | 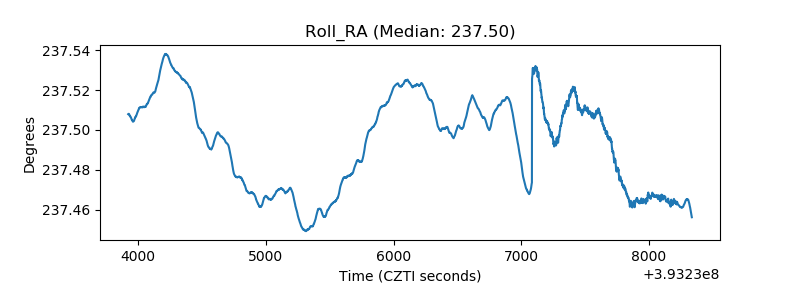 |
| Veto Counter | 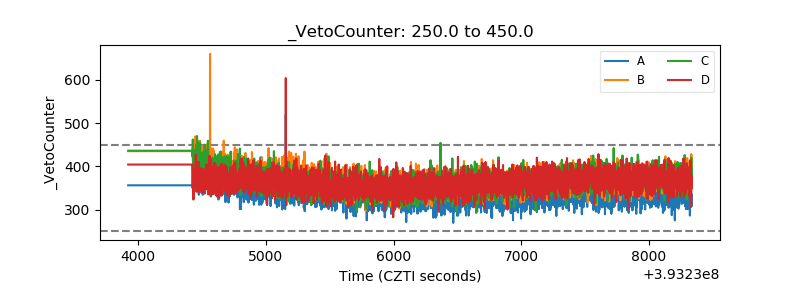 |